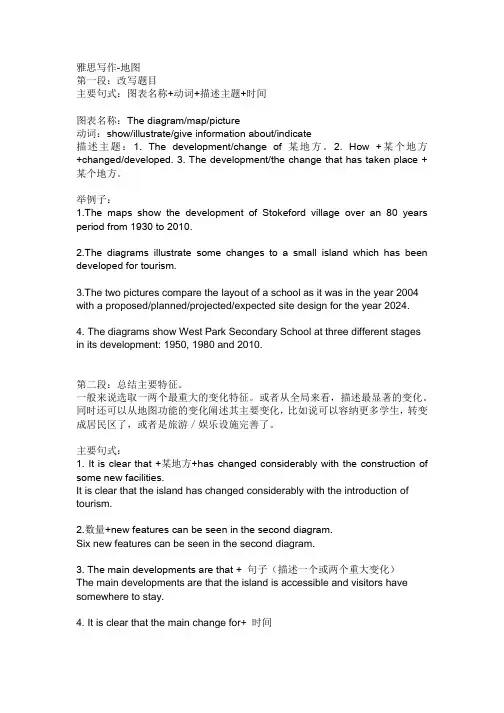
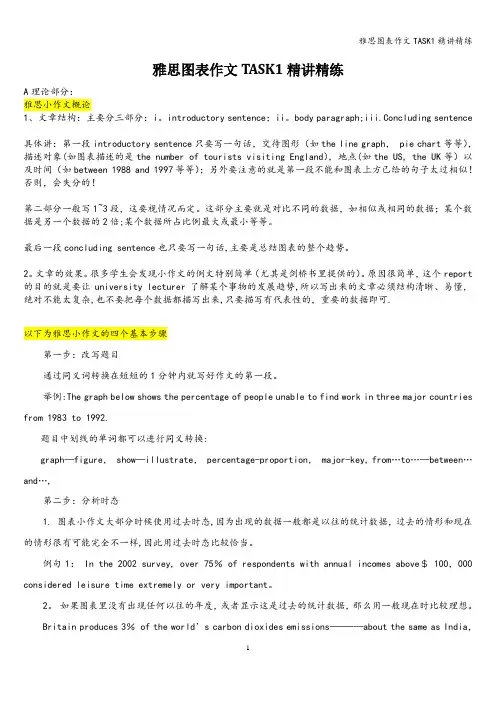
IELTS_Task1_图标作文写作全攻略
- 格式:doc
- 大小:34.50 KB
- 文档页数:7
(一)描写图表的句型1.表示―说明‖的句子结构According toAs can be seen fromAs shown inIt is clear/apparent formWe can see fromIt ca n be seen fromchart/graphtablediagramfigure/statisticsThe2.The chartgraphtablediagram revealsshowssuggestsillustratedemonstrateindicatedescriber elates That ………3.The numberfigurepercentage Of…… nearlyalmostmorethan doubledtripled , as compared withas against thosethatof last year4.From the statisticsinformation given in the tablegraphchart ,we can estimateseeconclude T hat….5.The figurenumberpercentage increaseddroppeddecreased more thanalmostabout six timest wicetwo and a half times ,compared with…6.The percentagenumber is twice4 timeshalf As much as thatthose of 19907.The ratenumber was X percent, lessmore than halfa thirdquarter of the 1998 total.8.By comparison with 1990,it shot upjumpedincreasedrosedecreaseddroppedfell by X percent from X to Y percent to X percent9.It has reachedapproachedrisen to something of a plateauX percentan average of X percent in the past few yearsin 199810.it accounts for(=constitute=make up) 15 percent of the total.11.By 1998, less thanmore thanalmostaboutoveras many asnearly three-quarters ofX percent ofone out of fiveone in fourone half/third of housewivesgraduatesyoung couplesthe number of students12.A has almost/nearlyabout/over a quarterhalf/twiceone third as many students asas much money as B13.A has about/approximatelyexactly/precisely the same numberproportionamount of student smoney as…..14.During the period 1970—1999From 1910 to 1974Since 1980Since the early 1980s ….there Was has been suddensharpdramatica markedsteadyslightgradualfall jumpriseincreasefluctu ationdecreasedeclinereductiondrop inthe number of people whopersonal incomecollege population15.The number of … increasedjumpedrosedecreaseddeclineddroppedfellfluctuated suddenlyrap idly/slowlydramaticallysignificantlyslightlygraduallysharply from 1988 to 1990during the fiv e-year periodThere was a (very) suddenrapiddramarticsignificantsharpsteepsteadygradualslowslight incr easejumprisedecreasedropfallflucuation In the number of…from…to…between…and…上面是一种说法的两种不同表达,写作时要灵活应用。
16.There washas been X accidents/suicidesa X percent increase/decrease in since March,an increase of 3 percent in a three-month periodup from X percent for the same period last year17.That is the second-highestthird-lowest rate in histroy18.The Numberpercentage remained steadystableunchanged during the decadebetween 1990 and 1995from 1990 to 199519.The percentagefigure reached a peaka high pointa low pointthe bottom in Marchat 20%20.The figure reachedpicked 90 percent,the highest level ever recorded since 196021.表示曲线图上最高点和最低点使用下列句型The monthlyThe figuresThe situation peakedreached a peak (a high point)bottomed outrea ched rock(the) bottoma low point in Dcemberat 20%22.表示变化不大或没有变化使用下列句型The number of (cars sold) remained steady(stable)stayed the same from …to….between…a nd….There was littlehardly anyno change in the number of (cars sold) from…to…between...and…(二)描述数据变化趋势时的词汇总结上升:rise,increase,climb,soar,go up,shoot up下降:decrease,drop,decline,reduce,go down不变:level off,level out,remain constant,become steady,stabilize波动:fluctuate用来修饰的副词平稳:slowly,gradually,slightly,steadily急剧和显著:markedly,suddenly,rapidly,sharply,dramatically,abruptly,steeply推测未来:the number of ……is projected(forecasted,expected,predicted)to decline。
The number of….. is # = # in the number of …..(三)重点类型图分析及归类1.饼状图(pie graph)饼状图是由一个圆形和圆内几个扇形组成,各个扇形的比例代表了相应部分在总量中所占的分额,其反映了总量和分量,及分量和分量之间的相对比例关系,所有在叙述中要加以描述。
常用描述:I.首句The two pie charts show(reveals,suggests,illustrate,demonstrate,indicate,describe,relates)the proportion(percentage)of A and B…………in 7 broad categories, divided into…….and……….(one is……,another is…..)II.比较①the biggest difference between 2 group(代表A+B) is in ….,where A make up $% while(=whereas) B constitute $%make up=constitue=accounts forthe highest percentage of A,which was approximately $%,was for …..(=in….)②the percentage of A in …..is more than twice the percentage of B,the ratio is $% to $%($% compared to $%)逗号后面的可以用括号里的来替代.③in………,while there is (not) a great deal of difference between the percentage of A and B(th e former is $% and the latter is $%)in………,while a greater percentage of A than B are found in……. (the former is $% and the l atter is $%)④there are more A in……,reaching $%,compared with $% of B⑤A , which used to be the……..,has became less important, which declined(increased) sharpl y from $% in 1978 to only $% in 1998.⑥by contrast, A has increased(declined),from $% in 1978 to $% in 1998.Compared with B, A……………………Comparing the two groups,某区域 have experienced(=contributed) a decrease in popularity with A.⑦The biggest loss was to某区域.The biggest gains in A were made by 某区域.⑧A which , as a group , have increased by over $%.III.总结句To sum up,In conclusion,It appears that…. The two charts clearly show…….2.曲线图(line graph)牢记三大句式构成文章ⅰ横坐标做主语.横坐标一般为年或具体时间.Eg:1986 –1990 saw (=witness) a steady rise in the number of A.ⅱ纵坐标做主语纵坐标一般为数量.Eg:the number (percentage) of A droped from 1986-1990The number(percentage) of A has a steady decrease from 1986-1990ⅲThere be 句型做主语Eg:there was a steady decrease in the number of A from 1986-1990①总结line graph的句子之间的连贯词there was变化趋势in the number of A from 1986-1990(over next…..yeas),which was followed by 变化趋势and then变化趋势 until 1998 when there was变化趋势 for the next ….yearsUntil=up toFrom 1990 onwards,there was变化趋势 in the number of A which then 变化趋势 at $% in 1994.In 1990,the number reached (was) $%,but 30 years later there was变化趋势.After 变化趋势from…to…,A begin 变化趋势 over the next….years.②峰值描述A attains(=reach) it’s peak at 1990 which about $%.The peak percentage of A is at 1990 which is about $%.交叉点描述A corresponds withB at 1995.A drops steadily from that peak,crossing the line forB at 1995.3.条形图(bar graph)图例1:leisure time in a typical week:by sex and employment status,1998-99hours说明:among employed full-time,men on average had……..,whereas women had………there were……..given for men,but women had……………eg:如果男人没有数据,可以为there were no figures given for male parttime workers.In unemployed categories,leisure time showed ………….比较:in unemployed group,men enjoyed more leisure time---over 80%,compared with 40% for women(同一群体的比较), markedly more than women in retired group(不同群体的比较).反映:…………………. , perhaps reflecting the fact that………………最后:overall,the chart demonstrates that……………………..大家可用以上句式试着连成文章.图例2:说明:low income consumed more hamburghers than other group(=more than other group on ha mburghers),spending more than twice as much as hamburghers than FC and Pizza(both about 40%)high income favoured pizza,spenting $%,followed by FC at $%,then hamburgher at $%.High income appear to less than other group on hamburghers,pizza remain their most pop ular fast-food,followed by FC.大家可用以上句式试着连成文章.图例3:inhabitants(in billions)说明:in 1975,among 3 of the world’s largest cities,san Paulo had the highest population(about 0.5 billion),and ……is the second highest(about …..)……had the lowest population (about ….).in the period 1975to 1990,all cities showed a growth,Tokyo and newyork had by far the lar gest increase (about…..).san Paulo had the smallest growth(about…)as a result in 1990,the number of ….appears the largest population,closely followed by …,t hen…….at……大家可用以上句式试着连成文章.图例4:the table below shows the figures for imprisonment in 3 countries between 1930-1960in great Britain,the numbers in prison has increased from….in 1930 to ….in 1940,apart fro m in 1950 when the numbers in prison fell by….On the other hand , new Zealand and astralia are the only two countries in which the numb ers in prison remain steady from 1930-1960,although there have been slightly fluctuations in this trend.类似这样的图以国家分类比较好.下面的句子都可用于条形图和曲线图的总结句:although there are fluctuation in the number of ……from….to…..,the trend was towards an increase/decrease.以上4大类条形图基本囊括了所有的条形图的种类,很多都是以上4类的变种,所以大家应该熟记以上4类的最基本的表达方法!4.统计表(table)表达方式和比较与以上3类比较方式句式基本相同,但要注意由于表中信息量较多,表达是不要哪个数字都描述,,描述增加最大和最小的,和其中某些数据就可以了.比如:Consumer durables 1972 1974 1975 1976Central heating 37 43 59 64television 93 96 97 98refrigerator 73 88 91 94说明:the greatest increase was central heating,rising from 37% in 1972 to 64% in 1983.next co me refrigerator,rising from 88% in 1974 to 94%in 1976.比较的表达同饼图和条图和线图,他们都是互通的,只要表达清楚就可以了,注意:①结构要求开头部分 :交代图表研究的时间段,研究对象和研究的数据形式(是具体数字还是百分比),争取3个要素用一句话说清.主体段落 :必须具备2个要素:单方面的趋势和数据支持.每一单方面的趋势争取用一句话表达.结尾部分:要写出对照对比的趋势,图表的一切信息来自图表,包括结论也要来自图表,不能发表自己的见解.②时态问题如果题目要求描述曲线图,表格,线形土中过去某个时间固定信息或过去某段时间内变化的信息就一定要用一般过去时和过去进行时.。