图表阐释类作文
- 格式:ppt
- 大小:308.50 KB
- 文档页数:23
图表作文特点:图表作文就是根据图表传递的信息和提供的资料来进行写作。
图表作文有用线条表示的图形,统计图表,曲线坐标图和圆形分析图,条形分析图等。
这些图表都可以用来提供一组或几组数据,反映某种变化或某种趋势。
写作步骤:1、描述图表,得出变化或趋势2、分析变化或趋势产生的原因3、得出结论或提出自己的看法模板:It is obvious in the graphic/table that the rate/ number/ amount Y has undergone dramatic changes. It has gone up/ grown/ fallen/ dropped considerably in recent years(as X varies). At the point of X1, Y reaches its peak value of ….(具体数字)What is the reason for this change? Mainly there are … reasons behind the situation reflected in the graphic/table. First of all, …. More importantly, …. Most important of all, ….From the above discussions, we have enough reason to predict what will happen in the near future. The trend described in the graphic/table will continue for quite a long time (if necessary measures are not taken 括号里的部分用于那些不太好的变化或趋势)Exercises:How People Spent Their HolidayYear 1990 1995 2000Travelling 37% 51% 76%Staying at Home 63% 49% 24%1.上图所示1990年、1995年、2000年某城市人们的度假方式的情况,请描述其变化。
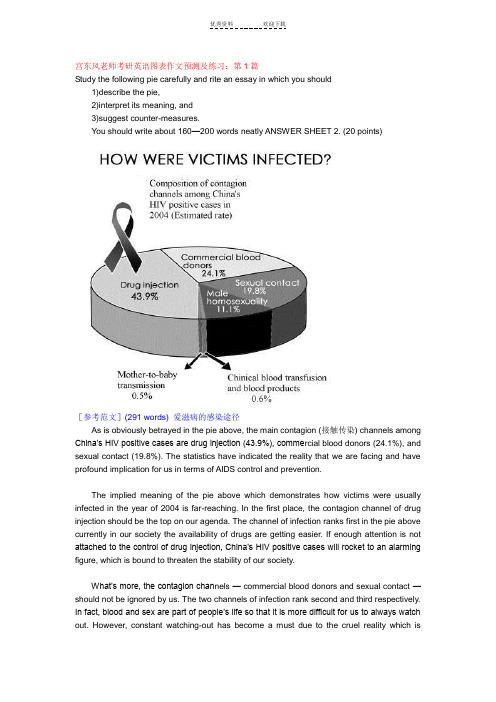
宫东风老师考研英语图表作文预测及练习:第1篇Study the following pie carefully and rite an essay in which you should1)describe the pie,2)interpret its meaning, and3)suggest counter-measures.You should write about 160—200 words neatly ANSWER SHEET 2. (20 points)[参考范文](291 words) 爱滋病的感染途径As is obviously betrayed in the pie above, the main contagion (接触传染) channels among China’s HIV positive cases are drug injection (43.9%), comme rcial blood donors (24.1%), and sexual contact (19.8%). The statistics have indicated the reality that we are facing and have profound implication for us in terms of AIDS control and prevention.The implied meaning of the pie above which demonstrates how victims were usually infected in the year of 2004 is far-reaching. In the first place, the contagion channel of drug injection should be the top on our agenda. The channel of infection ranks first in the pie above currently in our society the availability of drugs are getting easier. If enough attention is not attached to the control of drug injection, China’s HIV positive cases will rocket to an alarming figure, which is bound to threaten the stability of our society.What’s more, the contagion chan nels — commercial blood donors and sexual contact —should not be ignored by us. The two channels of infection rank second and third respectively. In fact, blood and sex are part of people’s life so that it is more difficult for us to always watch out. However, constant watching-out has become a must due to the cruel reality which isrevealed in the pie above. Otherwise, everybody in our society will be in danger of being infected with HIV positive.Counter measures must be taken in order contain the current situation. In the first place, we must offer medical treatment to those who are already infected. In the second place, we must popularize the knowledge of AIDS in our society, especially among young people. Most importantly, the idea of prevention should be the uppermost in our work and life.宫东风老师考研英语图表作文预测及练习:第2篇Study the following chart carefully and write an essay in which you should1)describe the chart,2)deduce the purpose of the painter of the chart.You should write about 160—200 words neatly ANSWER SHEET 2. (20 points)[参考范文]2004年不同疾病的死亡率(248 words)As is apparently betrayed in the chart above, among the leading causes of death among 15 — 59-year-olds worldwide in the year of 2004 are HIV/AIDS, heart failure, tuberculosis and so forth, which cover both external and internal factors. What the chart reveals mirrors a social reality, which is in effect thought-provoking.The aim of the painter of the chart is to make us have a clear understanding of the leading causes of death so as to improve our life span and the quality of life. In the first place, some diseases such as HIV/AIDS and cancer are still No. 1 enemies since we still have no better way to deal with them. Consequently, we must work hard in this aspect and try our best to find the cure as early as possible. In the second place, psychological stress on us should not be neglected in terms of leading causes of death. Causes such as heart failure and suicide areclosely related with psychological stress.Therefore, to protect our life, we must first of all attach importance to our state of mind. Last but not least important, some leading causes such as respiratory illness is associated with our environment pollution. Therefore, the improvement of our environment can contribute to the protection of our life. In sum, the chart above reminds us that the leading causes of death result from diseases, psychological stress, and environmental pollution. In order to have a better life, something must be done in the relevant aspects mentioned above.宫东风老师考研英语图表作文预测及练习:第3篇Study the following chart carefully and write an essay in which you should1)describe the chart,2)account for the status revealed, and3)make a relevant prediction.You should write about 160—200 words neatly ANSWER SHEET 2. (20 points)The number of Scientific breakthroughs over the past years in P.R. China (Estimated)[参考范文](228 words) 从2001-2004年4年当中中国在科学成就上突破表As is apparently betrayed in the chart above, the number of scientific breakthroughs over the past years in P.R. China has been climbing and rocketed to 120 cases in the year of 2004, which is a shocking news to people both at home and abroad. People may wonder what is behind the great achievement.The foremost reasons for the tremendous feat which is revealed in the chart above can beillustrated as follows. To begin with, idea that science and technology are also productivity has contributed to the increase of scientific breakthrough. Over the years, more and more people realize that we are living in an era of knowledge explosion. If we want to survive and develop in the current world, we must keep pace with the development of science and technology. Thus, scientific breakthrough crop up by each passing day. What’s more, the Opening-up and Reform has also brought about the increase of scientific breakthroughs. The Opening-up and Reform has improved the development of China’s economy, which has laid a solid foundation for the increase of scientific breakthroughs. In sum, our new idea and Opening-up and Reform are the preconditions of the tremendous increase of scientific breakthroughs.As our country develops at a high speed, more scientific breakthroughs will come into our life since we have more solid economic foundation, advanced equipment and facilities, and super talents.宫东风老师考研英语图表作文预测及练习:第4篇Study the following chart carefully and write an essay to1) describe the chart,2) state your attitude toward the event, and3) suggest counter-measures.You should write about 160—200 words neatly ANSWER SHEET 2. (20 points)[参考范文](172 words) 世界恐怖案件调查表As is apparently betrayed in the chart above, the number of terror attacks over the past four years has been climbing and rocketed to 204 cases in the year of 2004. This is a shockingfigure to everyone and every nation in the world, which has aroused the deep concern of the international community.In my view, terrorist offences against civilians cannot be justified in any way. Action of the kind is no doubt criminal regardless of their motivation, be it political or personal. The terror attack on children and women like the case in Russia not long ago is never forgivable. In fact, terror attack is a threat to the world peace and stability.Counter-measures should be taken to fight against terrorism. To begin with, there is a greater and more urgent need for the international community to collaborate now. What’s more, the legislative framework of international co-operation against terrorism should be perfected. Most importantly, the world community should carefully explore terrorism’s breading grounds while probing effective means to counter it.宫东风老师考研英语图表作文预测及练习:第5篇Study the following drawing carefully and write an essay to1)describe the picture2)deduce the reasons for the predictions revealed, and3)put forward your suggestions.You should write about 160—200 words neatly ANSWER SHEET 2. (20 points)[参考范文](256 words) 预测中国人口寿命As is apparently betrayed in the drawing above, the average life spans of the world population and China’s population will reach fifty years and one hundred years respectively by the year of 2300. And by then the number of people above the age of sixty will account for thirty-eight percent of the total world population. This is a great change in human history, which has made us think deeply.The foremost reasons for the predictions which are indicated in the drawing above can be illustrated as follows. To begin with, the rapid development of the world economy hascontributed to the predictions. Over these years, the world economy is developing at a surprising speed, which has supplied people all over the world with adequate daily necessities. What’s more, the development of medical science has brought about the predictions. Over the past years, a number of medical breakthroughs have been made in the field of medical science, which has greatly protected people and improved the quality of people’s life. With the further growth of the world economy and medical science, the UN predictions will be more persuasive.By the way, here are suggestions of mine for the predictions revealed in the drawing above. The international community including China must now make preparations for the coming of the day. Much knowledge concerning senior citizens should be popularized. More public facilities for senior citizens should be set up. More professionals on senior citizens should be strictly trained. Only in this way can we live in a peaceful and harmonious environment.宫东风老师考研英语图表作文预测及练习:第6篇Study the following chart carefully and write an essay in which you should1)describe the chart,2)deduce the purpose of the painter of the chart, and3)suggest counter-measures.You should write about 160—200 words neatly ANSWER SHEET 2. (20 points)[参考范文](280 words) 关于南京大屠杀知道情况的问卷调查As is apparently betrayed in the chart above, the number of people who know the date of the Nanjing Massacre (大屠杀) is only one out of fifteen, which is really surprising to every Chinese. The social phenomenon is not a trivial matter and should arouse the great concern of our society.The aim of the painter of the chart is to remind us that we are forgetting what we should always keep in mind as a Chinese. Everyone in the world has his/her motherland. As a Chinese, we should have a good understanding of the history of our motherland. Without a good understanding of the history, we can not be a qualified Chinese. In the history of our nation, many significant events have ever taken place. The Nanjing Massacre is just one of them, which have left us an unforgettable memory. To forget events of the kind means that we betray our nation, that we are losing our national spirit, that we lack patriotism (爱国精神), and that we are destroying our future. The phenomenon which is revealed in the chart above is pervasive and must be curbed. Otherwise, it will impair the development of our motherland.Counter-measures must be taken to rectify the trend of the kind revealed in the chart above. Mostly importantly, laws and regulations must be established to popularize the knowledge of the history of our motherland. Besides, activities at national level should be organized to mark the significant events in our history. In sum, we must attach more importance to our history in order to make our country become a strong and powerful nation in the world.宫东风老师考研英语图表作文预测及练习:第7篇Study the following chart carefully and write an essay to1)depict the chart, and2)deduce the reasons behind the fact.You should write about 160—200 words neatly on NSWER SHEET 2. (20 points)[参考范文](235 words) 考研人数从2003-2005年持续上升As is vividly betrayed in the chart above, the number of MS/MA candidates has been climbing over the past years and rocketed to 1.3 million in the year of 2005. People at different walks of life may wonder what is behind the figure.The foremost reasons for the great increase of MA/MS candidates over the past years can be illustrated as follows. In the first place, the idea that knowledge is power has contributed to the enormous increase of MA/MS candidates. At present, we are living in an era of knowledge explosion. If we want to survive in the current society, we must have good command of knowledge. To be exact, knowledge learning has become a life-long work.Therefore, more and more people are content with their four-year college education and apply for MA/MS degree. In the second place, the current unsatisfactory job-hunting has resulted in the great increase of MS/MA candidates over the past years. At the moment, the supply of the college graduates overtakes the demand for the college graduates.As a result, many college graduates can not find jobs that they really enjoy and want. Some of their jobs are even irrelevant to their majors. Therefore, they would like to conduct further study instead of doing the work that they dislike. As a consequence, more and more people apply for MA/MS degree, which has led to the great increase of MA/MS candidates.宫东风老师考研英语图表作文预测及练习:第8篇Study the following chart carefully and write an essay to1)describe the chart,2)deduce the possible reasons of the increase of the gold medals.You should write about 160—200 words neatly on ANSWER SHEET 2. (20 points)[参考范文]中国在奥运会上金牌逐渐上升(197 words)As is vividly portrayed in the chart above, the number of gold medals which are snatched by P.R. China has been climbing and rocketed to 32 at the 2004 Athens Olympic Games. This is a great achievement in Chinese sports. People both at home and abroad may wonder what has brought about the great success.The foremost reasons for the great achievement which is revealed in the chart above can be illustrated as follows. To begin with, the Opening-up and Reform has contributed to the growth of Chinese sports. The Opening-up and Reform since 1978 has improved the development of economy in China, which has laid a solid foundation for the development of sports in China.Thus, without the Opening-up and Reform, the 32 gold medals would be a pie in the sky. What’s more, the international exchanges have brought about the growth of Chinese sports. On one hand, we sent Yao Ming to NBA and Liu Xiang to participate in international events of various kinds. On the other hand, we have invited foreign professionals to come to China and coach our national teams.Therefore, without the international exchanges, the 32 gold medals would be an empty talk.宫东风老师考研英语图表作文预测及练习:第9篇Study the following chart carefully and write an essay in which you should1)describe the chart,2)account for the fact revealed in the chart.You should write about 160-200 words neatly on ANSWER SHEET 2. (20 points)[参考范文](238 words)As is vividly betrayed in the chart above, the number of scholars returning from the overseas has been climbing over the past years and rocketed to over 50 thousand in the year of 2004. People may wonder what is behind the amazing figure.The foremost reasons for the tremendous increase which is clearly revealed in the chart above can be illustrated as follows. To begin with, a set of preferential policies has contributed to the increase of the number. To attract the students studying overseas to return, our government has set up a suite of preferential policies in terms of salaries, residing place, housing, choice of jobs, and children’s education. Without the preferential policies, the increase of the number is out of the question.What’s more, the rapid development of our motherland has led to the increase of the number of scholars returning from overseas. Since 1978, China has carried out Opening-up and Reform, which has greatly improved the grow th of China’s economy. The robust economy has laid a solid foundation for the rapid development of scientific field, which makes P.R.China a most inviting country to both Chinese at home and abroad and foreigners. Therefore, without the great leap of our motherland over the past years, the increase of the scholars returning from overseas would be impossible.In one word, our preferential policy and rapid development of our motherland are the foundation of the increase revealed in the chart above.图表作文10:1997年考研英语真题作文Directions:A. Study the following set of pictures carefully and write an essay in no less than 120 words.B. Your essay must be written clearly on the ANSWER SHEET.C. Your essay should cover all the information provided and meet the requirements below:OUTLINE:优秀资料欢迎下载1. Interpret the following picture.2. Predict the tendency of tobacco consumption and give your reasons.【参考范文】The problem of smoking has received more and more concern from all over the world. As is indicated by the pictures, smokers for nearly 20% of the world population. And tobacco has caused a loss of 200 billion U.S. dollars and claimed 3 million lives annually.However, it is billion that the world tobacco production witnessed a decrease from 14.364 billion pounds in 1994 to 14.2 in 1995. according to this change. I confidently believe that there will be less and less tobacco consumption in the future, generally for two reasons. On the one hand, being aware of the harm of smoking, more and more people join in the fight against it. They either try their best to give up smoking or advise others not to smoke any longer.On the other hand, many governments have attached more attention to this social hazard and take various measures to put an end to it. Therefore, I have every reason to believe that the fight against smoking will be won by us human beings at last.。

高考英语作文高三英语复习时要覆盖各类作文题材,以便在考场上看到任何类型的题目都能轻松搞定。
以下为大家整理了图表分析类作文题目及范文,供同学们参阅。
图表作文是高中英语作文中较常见的类型,要求学生通过图中数据和提示内容写一短文,属于比较、对照类。
也可根据提示写为议论文。
通常我们采取三段式写法:第一段:描述图表,得出结论。
第二段:紧扣主题,根据图表比较分析原因,论证结论。
第三段:发表议论,提出自己的看法。
常用句式:1. As can be seen from the chart,...As is shown in the chart,...2. The chart shows that about 60 percent of students want to go to college...3. From the graph/data/results/information above,it can be seen/concluded/show/estimated...4.The graph shows the changes in the number of...over the period from...to...pared with...,the number of the students of...高中英语作文图表作文万能模板:As is shown by the figure/percentage in the table /picture,____ has been on rise/ decrease,significantly/dramatically rising/decreasing from ____ in _____ to _____ in _____. From the sharp rise/decline in the chart,it goes without saying that _____.There are at least two good reasons accounting for _____. In one hand,____.In the other hand,_____ is due to the fact that ______.In addition,______ is responsible for _____. Maybe there are some other reasons to show ______.But it is generally believed that the above mentioned reasons are commonly convincing.As far as I am concerned,I hold the point of view that _______. I am sure my opinion is both sound and well-grounded.DIY:高考英语图表分析类作文题目1最近,你参加了高三年级组织的“你最重视哪科作业”的调查,结果见下面的饼状图。

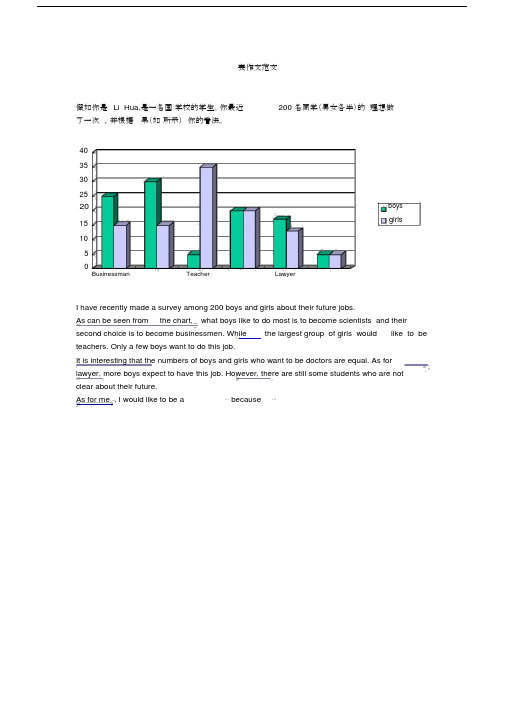
表作文范文假如你是Li Hua,是一名国学校的学生。
你最近200 名同学(男女各半)的理想做了一次,并根据果(如所示)你的看法。
4035302520boysgirls15105Businessman Teacher LawyerI have recently made a survey among 200 boys and girls about their future jobs.As can be seen from the chart, what boys like to do most is to become scientists and their second choice is to become businessmen. While the largest group of girls would like to be teachers. Only a few boys want to do this job.It is interesting that the numbers of boys and girls who want to be doctors are equal. As for lawyer, more boys expect to have this job. However, there are still some students who are notclear about their future.As for me , I would like to be a⋯because⋯7崇文一模某英文报纸正在开展题为“中学生课堂注意力”的专栏讨论,你校准备参加,并请你代表学校写一篇文章给该英文报纸投稿。
下面的图表为你校的调查结果,请你根据所提供的信息做简要说明,并根据提示给出改善的建议。
注意:图中数据为学生人数百分比。
中学生课堂注意力集中的情况中学生课堂注意力不能集中的原因40%30%70%60%能够集中注意力不能集中注意力课堂干扰睡眠不足与疲劳改善注意力的建议:教室课堂课间通风、明亮积极参与课堂活动适量活动或适当休息注意: 1.词数:不少于60。
图表作文本节内容一)图表作文写作要求图表作文就是把非文字信息(通常为各种图表表示的数字信息等)转换成文字信息的一种作文。
它要求我们用文字来描述非文字性的图表或对图表显示的关系作解释说明。
图表作文一般在题目中给出作文的标题和一个或几个统计表格、圆图形、曲线图或条形图,有时还用英文或中文提纲的形式给出提示,具体要求:1. 用文字描述图表,客观解释图表中所传递的信息,并找出某种规律或趋势;2. 就图表中所反映的某种趋势或问题分析其原因或后果。
图表作文着重说明事实,常常通过对图表中所反映的具体数据的说明、分析、比较,对某种事物或现象的事实或变化情况等加以说明,并提出结论或看法。
因此,图表作文常常采用议论文的写作方法。
二)写作步骤1.仔细阅读图表,了解图表所达的内容。
首先,用一句话概括图标的内容。
2.描写图表所反映的问题或规律3.结尾部分得出结论,表述自己的观点,结束全文。
(1)如果图表反映的是好的现象,首先要肯定、发表观点最后预测未来;(2)如果图表反映的是不好的现象,首先要否定、提出解决办法或建议三)写作实用表达(一)点明主题引用具体或粗略的数据,然后作出概括性分析,点名主题或引出需要论述的问题。
常用的词有:1.泛指一份数据图表:a data graph/chart/diagram/illustration/table饼图:pie chart 表格图:table 柱形图:bar chart趋势曲线图:line chart / curve diagram2.describe, show, represent, illustrate, reveal等等。
3. figure, statistic, number, percentage, proportion常用的开篇句型(即概述图表内容时常用的表达法)1.The graph/chart/table above shows / describes / illustrates that.....2. From the above graph/chart, it can be seen that…3. As is shown in the graph…4.The chart/table shows the differences between…5. According to the table/pie chart/ graph/bar graph, we can see/conclude that …(二)分析差异描写变化及总趋势特征、分析差异:数据说明常用套语:1.There was a great /slight increase /rise in…2.The number /rate has nearly doubled, compared with that of last year.3.The number is …times as much as that of….原因说明常用套语:1.The reason for…is that…2.The change results from the fact that…3.There are several causes for this significant growth in…. To begin with .... In addition/ Furthermore/ Moreover,...4. There are many factors that may account for...but the following are...(三)得出结论结尾常用套语1. Personally/ as far as I’m concerned/ in short/ in brief/ in conclusion /in summary2. It’s clear/evident from the chart that… / We can draw the conclusion that…3. From what has been discussed above/Taking into account all these factors, we can draw the conclusion that…4. There is no doubt that special attention must be paid to the problem of...5. It is high time that we put an end to the tendency of...图表作文常用单词、词组和句型总结:1)表示数据变化的单词或词组rapid/ rapidly 迅速的,飞快的,dramatic/ dramatically 急剧的sharp /sharply 明显的,急剧的significant/ significantly 重大的sradual/ gradually 渐进的,逐渐的steady / steadily 稳固的stable / stably 稳定的slow /slowly 缓慢的slight / slightly 略微的2)在描述中常用到的词汇significant changes 图中一些较大变化noticeable trend 明显趋势distribute 分配in terms of/ regarding/ with regard to/ as far as sth is concerned 关于,就...而言3) 描述增减变化常用的句型Compared with … is still increased by …The number of … grew/rose from … to …An increase is shown in …; then came a sharp increase of …In … the number remains the same/drops to …There was a very slight (small/slow/gradual) rise/increase in ......There was a very steady (marked/sharp/rapid/sudden/dramatic) drop (decrease/decline/fall/reduction) in ....../ compared with that of last year).4) 图表作文常用句型精选1. The table shows the changes in the number of.....over the period from....to......该表格描述了在...年至...年间...数量的变化。
图表阐释类作文写作技巧一. 什么是图表阐释类作文☐描述图表或图画中的数据或画面☐解释这些数据或画面反映出的变化☐分析其产生的原因、影响或存在的问题Directions: For this part, you are allowed thirty minutes to write a composition on the topic Student Use of Computers. You should write at least 120 words, and base your composition on the chart and the outline given below:1. 上图所示为1990年、1995年、2002年某校大学生使用计算机的情况,请描述其变化;2. 请说明发生这些变化的原因(可从计算机的用途、价格或社会发展等方面加以说明);3. 你认为目前大学生在计算机使用中有什么困难或问题。
二. 结构公式范文From the chart, we clearly learn that in recent ten years the time the students spend on computer has increased rapidly. In 1990, a student only spent 1 hour on average on the computer per week. However, by 2000, the number has reached as many as 20 hours.The following reasons can account for this tremendous change. Among these, the sharply decrease of the computer price plays an important role. More and more families can afford a computer for their children. In addition, more and more net bars provide students convenient access to computers. Besides, Internet provides people an amazing world to explore, which attracts more students to sit in front of the screen.From my point of view, there are still some problems in student use of computers. A typical one is that some students are addicted to computer games. Besides, some students rely on computer too much, which limits their independent thinking. Therefore, necessary instructions should be given to students to guarantee reasonable use of computers.四. 功能句写法:1)描述图表段1.正如图表中显示的,中国人的饮食结构已经发生了明显的变化。
图表作文Graph Writing写作体裁和步骤常见类型*常用模板模板示例*图表描述模拟练习图表分析型图表作文的命题形式是根据图画或者图表,要求考生用简洁、生动的语言把图表中所提供的信息准确、完整地表达出来。
然后进行分析和评论,并得出合乎逻辑的结论。
图表作文是一种信息的转换。
也就是说,写图表作文时,首先要以题目中的要求为指导,审慎读图,准确把握图表传达的信息,将其扩展成文。
图表作文往往是以说明为主,图表中的数据是为了说明某个问题而提供的,只要问题能阐释清楚,就不必面面俱到地把所有数据都在文章中引用出来。
考生要切忌毫无目的地引用图表中的数据。
引用数据过多的同学往往得分很低。
写作体裁---说明文*描述图表的变化为主*分析图表变化的原因为主Writing Steps1)分析图表及说明文字;2)观察数字变化趋势,分析主旨,得出中心论点;3)列提纲;4)写作图表作文的段落设计1. 开头段—--说明该图表反映的概况,选择能充分说明主题的典型数据进行概述;主题句+图表说明1+图表说明2+图表说明32. 中间段—--对数据进行仔细地分析比较,归纳出增减速率,找出产生变化的原因;主题句+原因1+原因2+原因33. 结尾段—--写出看完图表后的想法或评论,得出自己的结论。
主题句+建议+前景预测常见类型根据图表信息写某一现象反映出的问题或发展趋势1)表格(table),它表示多种事物的相互关系2) 柱状(Bar Graph):它用来表示几种事物的变化情况及相互关系3)饼状(Pie Graph):表示各事物在总体中所占的比例及相互关系注意第一,不要“面面俱到”,要“类类俱到”.常用模板及表达以描述变化为主的The 图表名称(table/pie graph/bar graph/line graph)describes (点题). As can be seen from the graph, (简述图表反映出的问题)We can see from the graph that 对图表进行细节描述.All this seems to point to 对未来的展望或自己的结论(noun phrase/the fact that…). 结尾句.以原因为主的The 图表相应的名称describes 点题. As can be seen from the graph, 概括叙述图表. 展开一两句.Several factors contribute to the change. First, 第一个原因. Second, 第二个原因. Last, 第三个原因.From the analysis above, we can safely conclude that 你的结论. 结尾句.现象解释型模板1) We have witnessed 总体现象.2) According to 描述图表, 具体表现一.3) And 具体表现二.4) Many reasons contribute to 过渡句.5)To begin with, 原因一.6)Moreover, 原因二.7) In addition, 原因三.8) As a result, 导致结果.9) As to me, 作者的看法.10) First of all, 理由一.11) Besides, 理由二.12) To conclude, 总结.第一段:说明图表开篇句:As the bar chart shows, ____ during the years of ____ to ____.扩展句:1、As early as _____.2、Then _____ years later, ____.3、And arriving in the year ____, ____.第二段:解释图表变化原因主题句:Several factors contribute to _____扩展句:1、______. (原因1)2、And ______.(原因2)3、Furthermore, ______ (原因3)4、All these result in ____.第三段:提出解决办法结尾句:However, ____ is faced with some problems.扩展句:1、With _____, ____, the effect of which is not only discouraging, but also challenging.2、So my principle is to pay due attention to ___, but not just to ____.Useful Expressions(1) According to figures shown in the table/graph/chart/pie we can see / conclude that…(2) The graph shows /tells/reveals that…(3) As is sh own/can be seen in the chart that…(4) The table is /gives information/about…(5) The table represents the development and changes in …(6) After considering the information in the table we might conclude that…*From the graph ( table, chart ), we can clearly see the increase ( decrease ) of _______. It added up to ( decreased ) ___________ in 19____, while it increased ( decreased ,were ,was ) to _____in 19____. Therefore, it can be predicated that ________ is ( are ) to be on the rise ( on the decrease) in the future.*There are chiefly _______ reasons for the increase ( decline ). In the first place, owing to ______, _______have realized the importance of _______. Secondly, with the development of ( with the growth of, with the increase of , with the improvement of ), ________ have adopted more active and effective methods.*In spite of what¡¯s mentioned above, there are some problems. The graph indicates that _______ was ( were ) fluctuated ( 波动) . Hence, the situation is still serious and how to improve ________ is still a challenging task.模板示例Sample*As the bar chart shows, the number of people below the poverty line decreased dramatically during the years of 1978 to 1997.As early as 1978, about 250 million people were under the poverty line. Then seven years later, the number became three fifths that of 1978.And arriving in the year 1997, the number was reduced to 50 millions.*Several factors contribute to the sharp decrease of the below-poverty population. The reform and opening following 1978 enabled the peasants to become much better off. And with the development of Chinese economy, that policy also improved city dwellers' lives greatly. Furthermore, the high-tech introduced made it possible for the country's economy as a whole to take off. All these result in the great fall of the Chinese population below the poverty line.*However, a further decrease in the number of poverty-stricken people is faced with some problems. With quite few employees being laid off, the effect of which is not only discouraging, but also challenging. So my principle is to pay due attention to the "newcomers", but not just to care for the poor, say , in remote mountain areas.*Recently, the issue of people below poverty line has aroused much interest. As can be seen from the bar graph, the number of people below poverty line decreased from 1978 to 1997. In 1978, there were 250 million throughout the country while in 1997, only 50 million people were under the line.*Several factors contributed to the decrease. First of all, the government pursued the policies of Reform and Opening to the Outside World which proved to be very effective. In addition, people’s living condition improved a lot. Perhaps the main cause is that the highly developed economy. Therefore, such a change took place.*From the analysis, we can safely conclude that this change will bring us much benefit. However, there are still some problems to be solved, such as the education of people in remote regions and provision of job opportunities for the laid off workers. But I believe this trend will continue, and eventually the problem of people below poverty line will be solved.2)Students in an American University in 20021) 根据上表,简要描述美国某大学学生借阅图书的分布情况.2)你对于这些学生阅读偏爱的评论.3)你通常喜欢阅读哪一类书籍?说明理由.Sample1)We have witnessed that college students vary in reading preference.2) According to the table of the percentage of book circulation in an American university library, the circulation of popular fictions and general nonfictions accounts for 65.9% and 18.2% respectively.3) And the table also shows that the circulation of science / technology/education books and art / literature / poetry books is 10.8% and 5.1% respectively.4) Many reasons contribute to this phenomenon.5) To begin with, popular fictions usually possess more appealing plots than other types of books do, so many readers are attracted by popular fiction. 6) Moreover, popular fictions and general nonfictions are easier to be understood. 7) In addition, science and art books demand certain knowledge in special field of study. 8) As a result, more students tend to choose popular fictions and general nonfictions.9) As to me, I’m in favor of books of science and technology. 10) First of all, in order to deepen what I’m learning, I need read more books relevant to my major and observe the new development in science and technological circles. 11) Besides, these books can also broaden my vision.12) To conclude, college students should choose books according to their interests and needs. Sample3*(1)The chart shows that students are now spending much more time on the computer, from one hour to four hours per week from1990 to1995. (2)It is self-evident that it increases sharply to twenty hours in the year of 2000. (3) Three possible reasons contribute to this phenomenon.*(4) One reason is that most college students now can afford a personal computer due to the sharp decline in its price. (5) Another reason is that they find the computer a wonderful thing to have fun with. (6) For instance, they can chat through QQ or playing games online. (7) What’s more, from Internet, they can learn things much more quickly than simply from reading books so that they can secure a good job in the future. (8) As a result, all these lead to much more time spent on using computers.*(9) However, in my opinion, there are some complaints from both teachers and students.(10) For one thing, students complain about the less availability of computers and slow speed of the network. (11) For another, some teachers worry that the much more time spent playing computer games or surfing online will lead students to ignore their studies and even do cheating instead of doing research by their own. (12) To sum up,in spite of problems concerning the use of computer, computer is still of more merits than defects.图表描述Translate the following into English.*这幅曲线图表明,1985至1994年之间,去澳大利亚旅游观光的日本游客百分比增长迅猛。
高考英语图画型作文写作技巧及范文导语:图画型作文更能考察学生的分析问题的才能,因此深受命题者的青睐。
考生应注意认真审题,一旦审题有所偏颇,不容易得到高分。
此类作文首先要描绘图画,然后对图画进展适当的阐释(解释、说明和分析),介绍图画背后所反映的问题,最后联络实际发表自己的观点,给出自己的建议、原因等等,一般写三段。
以下是为大家精心的英语图画型作文写作技巧及范文,欢迎大家参考!1、As can be seen from the chart, …;From thechart/picture /table we can see(The chart shows) that ..;As is vividly shown in the picture( 假设两个的话用pictures,也可以用drawing,同样的假设两个的话用drawings,假设是图表那么用table ,两个图表那么用 table s) above, 图画的内容。
The picture( 假设两个的话用pictures,也可以用drawing,同样的假设两个的话用drawings,假设是图表那么用table ,两个图表那么用 table s) tells ( 注意,假设是前面的图画是复数,那么用tell) us that 这个图片的大致反映的意思。
2、 Recent years people in 地名(比方中国、北京、美国等等) have witnessed the fact that 描绘图片里的现象,And it is very mon/usual to see that in recent years.1、The implied meaning of the picture(注意,同上进展单复数的处理) should be taken into aount seriously. First/To begin with, 提醒涵义/原因/结果1,Second/What’s more, 提醒涵义/原因/结果2。
图表分析类高考作文写作技巧点拨(2008-05-08 22:05:06)图表分析类作文要求学生通过观察图表,将数据、文字内容及图表所包含的信息进行分析,将它们系统准确地转化为表意的说明文字,从而得出令人信服的结论。
由于图形、图表能更加直观、实用,同时能更好地考查学生的观察能力、分析问题及语言驾驭能力而倍受高考青睐。
【图表分类】图表示作文有以下几种形式:①以坐标轴的形式出现的表示数据大小或数量差异或变化的柱状图(bar graph)或出现时间参照的曲线图(line graph);②以圆内扇形大小表示总体与内部结构变化的圆型或饼形图(pie graph);③以表格形式将统计的数据体现出来的统计表(statistical graph);④两图或多图组合的综合图形(compound / complex graph)。
【信息的提取】图表分析类作文不像文字提示或表格作文那样信息点明显,它的特点是提示语言少,信息点分散,数据多,因此审题时一定要针对不同的图形进行适当的分析。
如柱状图或曲线图,则一定要运用坐标刻度及数轴所提供的信息点来分析几组数据间的变化,抓住主要特点及规律进行说明。
对饼形图则一定要根据百分比搞清部分与整体、部分与部分的关系。
对综合图要说明几个大的问题,而且往往是第一图表达现状,第二图表达原因或解决办法,要把它们揉合在一起写成一篇语义连贯的文章。
【体裁特点】①说明文:单纯描述解释图表信息,按照图表所展示内容如实表述,不加评论。
②议论文:通过叙述图表中的信息及数据间的变化,找规律,分析原因,发表评论或解决办法。
【写作三部曲】第一步:开门见山点明本图所反映的主题。
常用的句型有:As can be seen from the graph / table / chart ...; As is shown in the graph ...; The graph / table / chart tells / shows the changes in ... between ... and ... / from ... to ...; This is a line graph which describes the general trend of ...; The pie graph represents ...第二步:分析数据间的主要变化、差异及趋势,然后叙述并阐明必要的理由或原因。