Mrbayes中文使用说明
- 格式:doc
- 大小:468.50 KB
- 文档页数:6


叶贝斯公式的原理及应用1. 叶贝斯公式的原理叶贝斯公式是一种统计学中常用的公式,用于计算在已知条件下发生某个事件的概率。
它基于贝叶斯定理,将先验概率与后验概率结合起来,从而得到一个更准确的概率估计。
叶贝斯公式的数学表达为:P(A|B) = P(B|A) * P(A) / P(B)其中,P(A|B)表示在事件B发生的条件下事件A发生的概率,P(B|A)表示在事件A发生的条件下事件B发生的概率,P(A)和P(B)分别表示事件A和事件B的概率。
叶贝斯公式的原理是基于条件概率的推导,通过已知信息来计算未知信息的概率。
它常用于分类问题、信息检索等领域。
2. 叶贝斯公式的应用叶贝斯公式在实际应用中有着广泛的应用,下面列举了一些常见的应用场景。
2.1 文本分类叶贝斯公式在文本分类中有着重要的应用。
通过统计文本中不同单词的出现频率,可以计算出不同类别的文本在某个单词出现的条件概率。
然后使用叶贝斯公式来计算给定一段待分类的文本属于某个类别的概率,从而实现文本分类的任务。
2.2 垃圾邮件过滤叶贝斯公式在垃圾邮件过滤中也被广泛应用。
通过统计已知分类的邮件中不同单词的出现频率,可以计算出某个单词在垃圾邮件中出现的条件概率和在非垃圾邮件中出现的条件概率。
然后使用叶贝斯公式来计算一封未知分类的邮件是垃圾邮件的概率,从而进行垃圾邮件过滤。
2.3 医学诊断叶贝斯公式在医学诊断中也有着重要的应用。
通过统计不同疾病患者的症状出现频率,可以计算出某个症状在某个疾病中出现的条件概率。
然后使用叶贝斯公式来计算一个患者患有某个疾病的概率,从而辅助医生进行准确定断。
2.4 信息检索叶贝斯公式在信息检索中也有着重要的应用。
通过统计文档中不同单词的出现频率,可以计算出某个单词在某个类别的文档中出现的条件概率。
然后使用叶贝斯公式来计算一个查询词为某个类别的文档的概率,从而进行信息检索。
3. 总结叶贝斯公式是一种重要的统计学公式,它基于贝叶斯定理,将先验概率与后验概率结合起来计算事件发生的概率。

How to download and compile the most recent version of MrBayes 3.2 (Mac and Unix) from the MrBayes svn repository on SourceForge1. If a Mac, open Terminal (located in Applications/Utilities). Then check that you have gcc installed by typing$ which gccThis should result in the directory location of your current copy of gcc, if you have one installed. If not, install one from the Developer Tools CD that came with your computer. Most Unix systems will already have gcc installed.2. Type (on one line):svn co https:///svnroot/mrbayes/trunk/src mrbayesYou should now get a number of files downloaded to your directory, in a folder named ”mrbayes”.3. Change to the mrbayes directory by typing:$ cd mrbayes4. Create the Makefile, which contains the instructions for the compiler (the ”make” command), by typing:$ ./configure5. Now compile the program by typing:$ makeIt will take a few minutes for the compiler to assemble the binary version of the program.6. Run the program by typing:$ ./mbYou may want to put the executable in your path. Consult a Unix savvy person on how to do this.Compiling and running the MPI version of MrBayes1. Download the source code and shift to the ”mrbayes” directory as described above.2. In step 4, use the following command to create the Makefile instead:$ ./configure --enable-mpi=yes3. Now compile the program by typing$ makeIt will take a few minutes for the compiler to assemble the binary version of the program. If the first entry on each line printed during the compilation step is ”mpicc”, you are compiling the parallel version. If it is ”gcc”, something went wrong during the configure step and you are compiling the serial version instead.If you have already compiled the serial version of the program in the same directory, you first need to remove the compiled objects by running$ make cleanThen you run the ”make” command as above. Note that the compiled program is going to be called ”mb” both for the serial and the parallel version, so the compilation of the parallel version will overwrite the serial version unless you rename or move the latter executable first.4. Run the parallel version of the program using the command$ mpirun -np 2 ./mbwhere 2 is the number of available processors or processor cores. The MrBayes header should say that you are running the parallel version and it should also give the number of processors (cores) available.5. In practical use, it is often convenient to run the MPI version of MrBayes in batch mode. For instance, you can prepare a Nexus batch file ”batch.nex”, which contains a MrBayes block. To use such a file and have the screen output written to the log file”log.txt”, use the command:$ mpirun -np 2 ./mb batch.nex > log.txt &You can now look into the end of the log file every now and then to see what the run is doing currently using$ tail log.txtIf you wish to continuously follow what is being printed to the log file, you can use$ tail -f log.txtThere are many other ways of running the MPI version of MrBayes. Clusters often come with special instructions on how to run mpi programs; they typically involve launching the MrBayes MPI runs through an appropriate script. Consult your supercomputer support for instructions.。


输入Help,窗口列出命令列表。
Help <command>,单命令介绍,包括该命令当前状态。
如:help lset。
Manual,在mrbayes文件夹会产生一个命令详细介绍的文件。
(依次输入命令,完成简单也最常用的分析):Execute filename.nex,打开待分析文件,文件必须和mrbayes程序在同一目录下。
Lset nst=6 rates=invgamma,该命令设置进化模型为with gamma-distributed rate variation across sites和a proportion of invariable sites的GTR模型。
模型可根据需要更改,不过一般无须更改。
mcmc ngen=10000 samplefreq=10,保证在后面的可能性分布中probability distribution至少取到1000个样品。
默认取样频率:every 100th generation。
如果分裂频率分支频率split frequencies的标准偏差standard deviation在100,000代generations以后低于0.01,当程序询问:“Continue the analysis?(yes/no)”,回答no;如果高于0.01,yes继续直到该值低于0.01。
sump burnin=250(在此为1000个样品,即任何相当于你取样的25%的值),参数总结summarize the parameter,程序会输出一个关于样品(sample)的替代模型参数的总结表,包括mean,mode和95 % credibility interval ofeach parameter,要保证所有参数PSRF(the potential scale reduction factor)的值接近1.0,如果不接近,分析时间要延长。
sumt burnin=250,总结树summarize tree。

派利斯中文使用手册第一章:介绍派利斯是一种强大的翻译工具,可以帮助用户实时翻译各种语言。
本手册将向您介绍派利斯的基本功能和使用方法。
第二章:安装和登录3.注册成功后,使用您的账户信息登录派利斯。
第三章:主要功能1.实时翻译:打开派利斯应用程序后,在输入框中输入您要翻译的文字或语句。
选择源语言和目标语言,然后点击“翻译”按钮即可实时翻译。
3.语音翻译:选择“语音翻译”功能。
按住录音按钮,说出要翻译的语句,松开按钮。
派利斯将尝试将语音转化为文字,并进行翻译。
第四章:高级功能3.字典功能:在派利斯应用程序中,选择“字典”功能。
输入要查询的单词或词组,派利斯将提供释义和示例用法。
第五章:常见问题1.为什么翻译结果不准确?派利斯尽力提供准确的翻译,但由于语言的复杂性和多义性,翻译结果可能存在误差。
2.如何提升翻译准确度?可以参考翻译结果的上下文,或尝试将长句拆分为更简洁的表达方式进行翻译。
第六章:使用技巧1.精确翻译:尽量提供清晰、准确的输入文本,以获取更准确的翻译结果。
2.听写模式:选择“语音翻译”功能后,点击“听写”按钮。
派利斯将在最终翻译前提供一段时间供您确认听写结果是否准确。
3.手写输入:在选择源语言后,可以通过点击键盘按钮来切换到手写输入模式,然后使用手指书写字母和汉字。
第七章:常用短语1.问候和礼节用语2.旅行用语3.饮食用语第八章:常用表达1.感谢与道歉2.询问与告知3.请求与回答第九章:技术支持本手册为派利斯中文使用手册,介绍了派利斯的基本功能、高级功能、常见问题、使用技巧以及常用短语和表达等内容。
希望通过本手册,用户能够更好地使用派利斯进行准确、便捷的翻译。


Package‘BayesSampling’October12,2022Type PackageTitle Bayes Linear Estimators for Finite PopulationVersion1.1.0Date2021-04-24Maintainer Pedro Soares Figueiredo<*********************>Description Allows the user to apply the Bayes Linear approach tofinite population with the Sim-ple Random Sampling-BLE_SRS()-andthe Stratified Simple Random Sampling design-BLE_SSRS()-(both without replacement),to the Ratio estimator(using auxiliaryinformation)-BLE_Ratio()-and to categorical data-BLE_Categorical().The Bayes linear estimation approach is applied to a general linear regression model forfi-nite population prediction in BLE_Reg()and it is also possible to achieve the design based estimators using vague prior distributions.Based on Gonçalves,K.C.M,Moura,F.A.S and Migon,H.S.(2014)<https://www150.statcan.gc.ca/n1/en/catalogue/12-001-X201400111886>.URL https://www150.statcan.gc.ca/n1/en/catalogue/12-001-X201400111886, https:///pedrosfig/BayesSamplingLicense GPL-3Encoding UTF-8LazyData trueRoxygenNote7.1.1Depends R(>=3.5)Imports MASS,Matrix,stats,matrixcalcSuggests knitr,rmarkdown,TeachingSamplingVignetteBuilder knitrLanguage en-USNeedsCompilation noAuthor Pedro Soares Figueiredo[aut,cre](<https:///0000-0003-2279-2881>),Kelly C.M.Gonçalves[aut,ths](<https:///0000-0002-4524-547X>)12BigCityRepository CRANDate/Publication2021-05-0119:00:02UTCR topics documented:BigCity (2)BLE_Categorical (3)BLE_Ratio (4)BLE_Reg (6)BLE_SRS (7)BLE_SSRS (9)C (10)create1 (11)E_beta (11)E_theta_Reg (12)T_Reg (12)VT_Reg (13)V_beta (13)V_theta_Reg (14)Index15 BigCity Full Person-level Population DatabaseDescriptionThis data set corresponds to some socioeconomic variables from150266people of a city in a par-ticular year.Usagedata(BigCity)FormatA data.frame with150266rows and12variables:HHID The identifier of the household.It corresponds to an alphanumeric sequence(four letters andfive digits).PersonID The identifier of the person within the household.NOTE it is not a unique identifier of a person for the whole population.It corresponds to an alphanumeric sequence(five letters and two digits).Stratum Households are located in geographic strata.There are119strata across the city.PSU Households are clustered in cartographic segments defined as primary sampling units(PSU).There are1664PSU and they are nested within strata.BLE_Categorical3Zone Segments clustered within strata can be located within urban or rural areas along the city.Sex Sex of the person.Income Per capita monthly income.Expenditure Per capita monthly expenditure.Employment A person’s employment status.Poverty This variable indicates whether the person is poor or not.It depends on income. Sourcehttps:///package=TeachingSamplingReferencesPackage‘TeachingSampling’;see BigCityBLE_Categorical Bayes Linear Method for Categorical DataDescriptionCreates the Bayes Linear Estimator for Categorical DataUsageBLE_Categorical(ys,n,N,m=NULL,rho=NULL)Argumentsys k-vector of sample proportion for each category.n sample size.N total size of the population.m k-vector with the prior proportion of each strata.If NULL,sample proportion for each strata will be used(non-informative prior).rho matrix with the prior correlation coefficients between two different units within categories.It must be a symmetric square matrix of dimension k(or k-1).IfNULL,non-informative prior will be used.ValueA list containing the following components:•est.prop-BLE for the sample proportion of each category•Vest.prop-Variance associated with the above•Vs.Matrix-Vs matrix,as defined by the BLE method(should be a positive-definite matrix)•R.Matrix-R matrix,as defined by the BLE method(should be a positive-definite matrix)Sourcehttps://www150.statcan.gc.ca/n1/en/catalogue/12-001-X201400111886ReferencesGonçalves,K.C.M,Moura,F.A.S and Migon,H.S.(2014).Bayes Linear Estimation for Finite Pop-ulation with emphasis on categorical data.Survey Methodology,40,15-28.Examples#2categoriesys<-c(0.2614,0.7386)n<-153N<-15288m<-c(0.7,0.3)rho<-matrix(0.1,1)Estimator<-BLE_Categorical(ys,n,N,m,rho)Estimatorys<-c(0.2614,0.7386)n<-153N<-15288m<-c(0.7,0.3)rho<-matrix(0.5,1)Estimator<-BLE_Categorical(ys,n,N,m,rho)Estimator#3categoriesys<-c(0.2,0.5,0.3)n<-100N<-10000m<-c(0.4,0.1,0.5)mat<-c(0.4,0.1,0.1,0.1,0.2,0.1,0.1,0.1,0.6)rho<-matrix(mat,3,3)BLE_Ratio Ratio BLEDescriptionCreates the Bayes Linear Estimator for the Ratio"estimator"UsageBLE_Ratio(ys,xs,x_nots,m=NULL,v=NULL,sigma=NULL,n=NULL)Argumentsys vector of sample observations or sample mean(sigma and n parameters will be required in this case).xs vector with values for the auxiliary variable of the elements in the sample or sample mean.x_nots vector with values for the auxiliary variable of the elements not in the sample.m prior mean for the ratio between Y and X.If NULL,mean(ys)/mean(xs)will be used(non-informative prior).v prior variance of the ratio between Y and X(bigger than sigma^2).If NULL,it will tend to infinity(non-informative prior).sigma prior estimate of variability(standard deviation)of the ratio within the popula-tion.If NULL,sample variance of the ratio will be used.n sample size.Necessary only if ys and xs represent sample means(will not be used otherwise).ValueA list containing the following components:•est.beta-BLE of Beta•Vest.beta-Variance associated with the above•est.mean-BLE for each individual not in the sample•Vest.mean-Covariance matrix associated with the above•est.tot-BLE for the total•Vest.tot-Variance associated with the aboveSourcehttps://www150.statcan.gc.ca/n1/en/catalogue/12-001-X201400111886ReferencesGonçalves,K.C.M,Moura,F.A.S and Migon,H.S.(2014).Bayes Linear Estimation for Finite Pop-ulation with emphasis on categorical data.Survey Methodology,40,15-28.Examplesys<-c(10,8,6)xs<-c(5,4,3.1)x_nots<-c(1,20,13,15,-5)m<-2.5v<-10sigma<-2Estimator<-BLE_Ratio(ys,xs,x_nots,m,v,sigma)Estimator6BLE_Reg #Same example but informing sample means and sample size instead of sample observations ys<-mean(c(10,8,6))xs<-mean(c(5,4,3.1))n<-3x_nots<-c(1,20,13,15,-5)m<-2.5v<-10sigma<-2Estimator<-BLE_Ratio(ys,xs,x_nots,m,v,sigma,n)EstimatorBLE_Reg General BLE caseDescriptionCalculates the Bayes Linear Estimator for Regression models(general case)UsageBLE_Reg(ys,xs,a,R,Vs,x_nots,V_nots)Argumentsys response variable of the samplexs explicative variable of the samplea vector of means from BetaR covariance matrix of BetaVs covariance of sample errorsx_nots values of X for the individuals not in the sampleV_nots covariance matrix of the individuals not in the sampleValueA list containing the following components:•est.beta-BLE of Beta•Vest.beta-Variance associated with the above•est.mean-BLE of each individual not in the sample•Vest.mean-Covariance matrix associated with the above•est.tot-BLE for the total•Vest.tot-Variance associated with the aboveSourcehttps://www150.statcan.gc.ca/n1/en/catalogue/12-001-X201400111886ReferencesGonçalves,K.C.M,Moura,F.A.S and Migon,H.S.(2014).Bayes Linear Estimation for Finite Pop-ulation with emphasis on categorical data.Survey Methodology,40,15-28.Examplesxs<-matrix(c(1,1,1,1,2,3,5,0),nrow=4,ncol=2)ys<-c(12,17,28,2)x_nots<-matrix(c(1,1,1,0,1,4),nrow=3,ncol=2)a<-c(1.5,6)R<-matrix(c(10,2,2,10),nrow=2,ncol=2)Vs<-diag(c(1,1,1,1))V_nots<-diag(c(1,1,1))Estimator<-BLE_Reg(ys,xs,a,R,Vs,x_nots,V_nots)EstimatorBLE_SRS Simple Random Sample BLEDescriptionCreates the Bayes Linear Estimator for the Simple Random Sampling design(without replacement)UsageBLE_SRS(ys,N,m=NULL,v=NULL,sigma=NULL,n=NULL)Argumentsys vector of sample observations or sample mean(sigma and n parameters will be required in this case).N total size of the population.m prior mean.If NULL,sample mean will be used(non-informative prior).v prior variance of an element from the population(bigger than sigma^2).If NULL, it will tend to infinity(non-informative prior).sigma prior estimate of variability(standard deviation)within the population.If NULL, sample variance will be used.n sample size.Necessary only if ys represent sample mean(will not be used otherwise).ValueA list containing the following components:•est.beta-BLE of Beta(BLE for every individual)•Vest.beta-Variance associated with the above•est.mean-BLE for each individual not in the sample•Vest.mean-Covariance matrix associated with the above•est.tot-BLE for the total•Vest.tot-Variance associated with the aboveSourcehttps://www150.statcan.gc.ca/n1/en/catalogue/12-001-X201400111886ReferencesGonçalves,K.C.M,Moura,F.A.S and Migon,H.S.(2014).Bayes Linear Estimation for Finite Pop-ulation with emphasis on categorical data.Survey Methodology,40,15-28.Examplesys<-c(5,6,8)N<-5m<-6v<-5sigma<-1Estimator<-BLE_SRS(ys,N,m,v,sigma)Estimator#Same example but informing sample mean and sample size instead of sample observations ys<-mean(c(5,6,8))N<-5n<-3m<-6v<-5sigma<-1Estimator<-BLE_SRS(ys,N,m,v,sigma,n)EstimatorBLE_SSRS Stratified Simple Random Sample BLEDescriptionCreates the Bayes Linear Estimator for the Stratified Simple Random Sampling design(without replacement)UsageBLE_SSRS(ys,h,N,m=NULL,v=NULL,sigma=NULL)Argumentsys vector of sample observations or sample mean for each strata(sigma parameter will be required in this case).h vector with number of observations in each strata.N vector with the total size of each strata.m vector with the prior mean of each strata.If NULL,sample mean for each strata will be used(non-informative prior).v vector with the prior variance of an element from each strata(bigger than sigma^2 for each strata).If NULL,it will tend to infinity(non-informative prior).sigma vector with the prior estimate of variability(standard deviation)within each strata of the population.If NULL,sample variance of each strata will be used. ValueA list containing the following components:•est.beta-BLE of Beta(BLE for the individuals in each strata)•Vest.beta-Variance associated with the above•est.mean-BLE for each individual not in the sample•Vest.mean-Covariance matrix associated with the above•est.tot-BLE for the total•Vest.tot-Variance associated with the aboveSourcehttps://www150.statcan.gc.ca/n1/en/catalogue/12-001-X201400111886ReferencesGonçalves,K.C.M,Moura,F.A.S and Migon,H.S.(2014).Bayes Linear Estimation for Finite Pop-ulation with emphasis on categorical data.Survey Methodology,40,15-28.10C Examplesys<-c(2,-1,1.5,6,10,8,8)h<-c(3,2,2)N<-c(5,5,3)m<-c(0,9,8)v<-c(3,8,1)sigma<-c(1,2,0.5)Estimator<-BLE_SSRS(ys,h,N,m,v,sigma)Estimator#Same example but informing sample means instead of sample observationsy1<-mean(c(2,-1,1.5))y2<-mean(c(6,10))y3<-mean(c(8,8))ys<-c(y1,y2,y3)h<-c(3,2,2)N<-c(5,5,3)m<-c(0,9,8)v<-c(3,8,1)sigma<-c(1,2,0.5)Estimator<-BLE_SSRS(ys,h,N,m,v,sigma)EstimatorC calculates the C factorDescriptioncalculates the C factorUsageC(ys,xs,R,Vs)Argumentsys response variable of the samplexs explicative variable of the sampleR covariance matrix of BetaVs covariance of sample errorscreate111 create1creates vector of1’s to be used in the estimatorsDescriptioncreates vector of1’s to be used in the estimatorsUsagecreate1(y)Argumentsy sample matrixValuevector of1’s with size equal to the number of observations in the sampleE_beta calculates the BLE for BetaDescriptioncalculates the BLE for BetaUsageE_beta(ys,xs,a,R,Vs)Argumentsys response variable of the samplexs explicative variable of the samplea vector of means from BetaR covariance matrix of BetaVs covariance of sample errors12T_Reg E_theta_Reg calculates the BLE for the individuals not in the sampleDescriptioncalculates the BLE for the individuals not in the sampleUsageE_theta_Reg(ys,xs,a,R,Vs,x_nots)Argumentsys response variable of the samplexs explicative variable of the samplea vector of means from BetaR covariance matrix of BetaVs covariance of sample errorsx_nots values of X for the individuals not in the sampleT_Reg calculates BLE for the total TDescriptioncalculates BLE for the total TUsageT_Reg(ys,xs,a,R,Vs,x_nots)Argumentsys response variable of the samplexs explicative variable of the samplea vector of means from BetaR covariance matrix of BetaVs covariance of sample errorsx_nots values of X for the individuals not in the sampleVT_Reg13 VT_Reg calculates risk matrix associated with the BLE for for the total TDescriptioncalculates risk matrix associated with the BLE for for the total TUsageVT_Reg(ys,xs,a,R,Vs,x_nots,V_nots)Argumentsys response variable of the samplexs explicative variable of the samplea vector of means from BetaR covariance matrix of BetaVs covariance of sample errorsx_nots values of X for the individuals not in the sampleV_nots covariance matrix of the individuals not in the sampleV_beta calculates the risk matrix associated with the BLE for BetaDescriptioncalculates the risk matrix associated with the BLE for BetaUsageV_beta(ys,xs,R,Vs)Argumentsys response variable of the samplexs explicative variable of the sampleR covariance matrix of BetaVs covariance of sample errors14V_theta_Reg V_theta_Reg calculates the risk matrix associated with the BLE for the individualsnot in the sampleDescriptioncalculates the risk matrix associated with the BLE for the individuals not in the sampleUsageV_theta_Reg(ys,xs,R,Vs,x_nots,V_nots)Argumentsys response variable of the samplexs explicative variable of the sampleR covariance matrix of BetaVs covariance of sample errorsx_nots values of X for the individuals not in the sampleV_nots covariance matrix of the individuals not in the sampleIndex∗datasetsBigCity,2BigCity,2,3BLE_Categorical,3BLE_Ratio,4BLE_Reg,6BLE_SRS,7BLE_SSRS,9C,10create1,11E_beta,11E_theta_Reg,12T_Reg,12V_beta,13V_theta_Reg,14VT_Reg,1315。

Mrbayes使用说明Mrbayes(运行过)文件格式为.nex,转化方法:将比对后利用DnaSp输出的NEXUS数据按如图1(tcs模板)格式进行调整,需要重新比对分析,然后将序列拷贝到模板中。
其中ntax为个体数,nchar为碱基数,即包括“-”的最大碱基数。
“-”为缺失碱基位点,注意在每条碱基名称中不能出现“-”,否则无法识别。
图11.在DOS下依次输入如下命令:exe *.nex其中*为要输入的文件名,文件需转化为.nex格式。
打开后会显示“Successfully read matrix”“Exiting data block”和“Reached end of file”。
2.如完成上步,输入下面命令,其中lset nst=?,数字为建模后得到的,如果建模后所得到的partition = 012012,两两相同则为2,如果partition = 000000,全一样则为1,如果partition = 012345,全不同则为6。
括号内的不用输入。
lset nst=2(hky)rates=invgamma3.成功后输入下一步:其中代表文件中外群样本的编号。
outgroup /4、成功后输入下一步,回车后如果文件夹中存在相同文件名则需要将相同文件替换掉,输入Y后回车。
mcmc ngen=1000000 samplefre=105、当要求的代数已经运行完毕,窗口会提示询问是否继续运行,如果回答yes,会要求输入继续运行的代数。
在回答之前,我们一般要先检查the average standard deviation of split frequencies的值,该值代表两个独立分析当前的相似性程度,越接近0越好,如果数值小于0.01则终止运行(一般在0.01-0.05之间即可),但决不能大于0.1,否则继续加10万运行。
sump burnin=25000(注:这里的burnin为buRnin,而不是buMin)6.这时会出现mybayes,输入下一步。

贝叶斯法构建系统发育树1.打开PAUP软件,打开目标文件和primates文件,将目标文件修改成primates文件格式。
2. 用modeltest3.7软件分析模型参数。
3. 打开mrbayes软件,文件输入。
命令:>execute 文件名.nex4. 设置参数,模型(上面modeltest3.7软件分析模型参数)。
命令:>lset nst=6/2 rates =gamma/invgamma/propinv,若要检查模型的参数,输入命令showmodel。
若设定lset nst=2,需输入命令report tratio=dirichlet。
3.1 >mcmc ngen=100000(1000000) (samplefreq=10(100)),注意:代数可以先设为10000,以便估计时间的长短。
>help mcmc来确认设置。
3.2 运行结束前,标准误差要小于0.01,否则增加代数,继续运行4.1 >sump burnin=250(2500);抽样的25%划为老化样本,舍去。
PSRF值需约等于1.0,否则要运行更长时间。
4.2 >sumt burnin=250(2500),输出所得的进化树,可用treeview打开.Modeltest 3.7基本操作步骤(中文)Moedltest是进行似然法计算必须的软件之一,它可以帮助大家为所获数据选择最佳的模型进行计算,得到最优的结果。
目前该软件的这里介绍一下Modeltest3.7的基本操作步骤:1. 下载Modeltest3.7软件和模型文件modelblockPAUPb10.txt;2. 将序列同源排序后保存为XXX.nex文件;全部拷贝到C盘。
3. 打开模型文件,将文件内容拷贝到XXX.nex文件的末尾,可以将该文件另存为XXX.test.model.nex,保留原来的*.nex文件;;4. 打开PAUP4.0应用程序,将XXX.test.model.nex文件拖入PAUP窗口,然后在命令行输入:execute XXX.test.model.nex,回车后PAUP就开始对数据进行模型估计,结果将保存为model.scores文件和modelfit两个文件,文件位于PAUP4.0软件的文件夹中;5. 将model.scores文件拷贝到Modeltest3.7.win.exe所在的文件夹中。
使用贝叶斯方法构建系统发育树—MrBayesmrBayes需要的比对文件格式为:nex,可以在比对是选择输出此种文件格式mtBayes可以在命令提示符里面运行在CMD里面输入mrBayes,出现如下界面在界面内输入 exe file(或者execute file,其中file为序列文件名),得到如下界面如果没有错误,则说明数据文件格式是正确的。
设置替换模型参数可以使用help lset查看lset设置的参数Nucmodel: 指的是核酸的类型。
4by4指的是不区分序列上的位点。
而codon指的是使用密码子模型。
这时序列上每个位点的替换速率会根据密码子模型来推断。
Doublet通常用于具有协同进化效应的序列。
一般情况下可以使用4by4,如果是编码序列的话,最好使用codonNst:核酸替换模型。
1 是JC69模型,即单参数模型。
2为F81模型。
6为GTR模型。
在mrBayes中,可以尝试分别使用三个模型运行,以选择最优的结果。
Code: 指的是密码子编码的规律。
Universal指的是通用密码子使用规律。
如果是推测线粒体内的基因,需要使用Metmt,叶绿体则需要使用MycoplasmaPloidy: 物种是单倍体还是二倍体。
Rates:指定序列上每个位点的替换速率。
Equal表示替换速率都是一致的。
Gamma表示用gamma来确定序列上的替换速率。
Ngammacat:配合上面的参数,如果替换速率设置为Gamma、Invgamma、Adgamma,则需要设置此选项。
Nbetacat:同上。
使用lset Nst=6 Rate=gamma类似命令设置参数。
设置模型的相关先验信息使用help prset查看相关参数及其说明一般情况下,需要关注的参数有:Tratiopr:指定转换和颠换的比例。
可以使用fixed指定,也可以使用beta分布来模拟产生。
Revmatpr:指定GTR模型里面替换速率的先验分布。
Aamodelpr:指定氨基酸替换模型中参数的先验分布。
实验3 用贝叶斯方法重建基因进化历史传统的系统进化学研究一般采用的要么是表型的数据,要么是化石的证据。
化石的证据依赖于考古学的发现,而表型数据往往极难量化,所以往往会得到许多极具争议的结论。
如今,现代分子生物学尤其是测序技术的发展为重建进化史提供了大量的数据,如多态性数据(如SNPs或微卫星)、基因序列、蛋白序列等等。
常规的做法一般都是利用某一个或者几个基因来构建物种树(species tree),但是一个基因的进化史能不能完全代表所有被研究物种的进化史呢?这是非常值得讨论的问题,但这不是我们本次实验的重点,在这里就不多赘述了。
所以,我们这里所指的进化树如非特别说明,指的都是基因树(gene tree)。
经典的研究系统进化的方法主要有距离法、最大简约法(maximum parsimony,MP)、最大似然法(maximum likelihood,ML)等等。
这些方法各有各的优点,也分别有其局限性,例如距离法胜在简单快速、容易理解,但是其模糊化了状态变量,将其简化为距离,也就不可避免的丧失了许多序列本身所提供的信息。
而最大简约法虽然用的是原始数据,但也只是原始数据的一小部分。
特别是在信息位点比较小的情况下,其计算能力还不如距离法。
相对来说,最大似然法虽然考虑问题更加全面,但带来的另一个结果是其计算量大大增加,因此常常需要采用启发式(heuristic)方法推断模型参数,重建进化模型。
本实验利用的是贝叶斯方法来重建基因进化史。
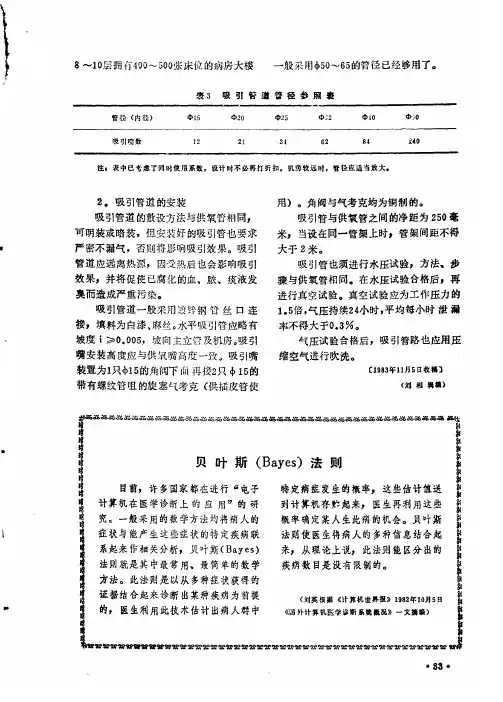
1.贝叶斯方法概述不可免俗的,我们还是要来看看贝叶斯模型,并分别对模型内部的一系列内容一一进行简单的介绍。
Bayes模型将模型参数视作随机变量(r.v.),并在不考虑序列的同时为参数假设先验分布(prior distribution)。
所谓先验分布,是对参数分布的初始化估计。
根据Bayes定理,可以不断对参数进行改进:f(θ|D)=f(D|θ)f(θ)f(D)(1) 其中f(θ|D)为后验概率分布(posterior probability distribution),而f(θ)是先验概率分布(prior probability distribution),而f(D|θ)为似然值。
MrBayes教程传统的系统进化学研究一般采用的要么是表型的数据,要么是化石的证据。
化石的证据依赖于考古学的发现,而表型数据往往极难量化,所以往往会得到许多极具争议的结论。
如今,现代分子生物学尤其是测序技术的发展为重建进化史提供了大量的数据,如多态性数据(如SNPs或微卫星)、基因序列、蛋白序列等等。
常规的做法一般都是利用某一个或者几个基因来构建物种树(species tree),但是一个基因的进化史能不能完全代表所有被研究物种的进化史呢?这是非常值得讨论的问题,但这不是我们本次实验的重点,在这里就不多赘述了。
所以,我们这里所指的进化树如非特别说明,指的都是基因树(gene tree)。
经典的研究系统进化的方法主要有距离法、最大简约法(maximum parsimony,MP)、最大似然法(maximum likelihood,ML)等等。
这些方法各有各的优点,也分别有其局限性,例如距离法胜在简单快速、容易理解,但是其模糊化了状态变量,将其简化为距离,也就不可避免的丧失了许多序列本身所提供的信息。
而最大简约法虽然用的是原始数据,但也只是原始数据的一小部分。
特别是在信息位点比较小的情况下,其计算能力还不如距离法。
相对来说,最大似然法虽然考虑问题更加全面,但带来的另一个结果是其计算量大大增加,因此常常需要采用启发式(heuristic)方法推断模型参数,重建进化模型。
本实验利用的是贝叶斯方法来重建基因进化史。
1.贝叶斯方法概述不可免俗的,我们还是要来看看贝叶斯模型,并分别对模型内部的一系列内容一一进行简单的介绍。
Bayes模型将模型参数视作随机变量(r.v.),并在不考虑序列的同时为参数假设先验分布(prior distribution)。
所谓先验分布,是对参数分布的初始化估计。
根据Bayes定理,可以不断对参数进行改进:f(θ|D)=f(D|θ)f(θ)f(D)(1) 其中f(θ|D)为后验概率分布(posterior probability distribution),而f(θ)是先验概率分布(prior probability distribution),而f(D|θ)为似然值。
系统发生分析程序MrBayes 3.1使用方法介绍
王勇;陈克平;姚勤
【期刊名称】《安徽农业科学》
【年(卷),期】2009(037)033
【摘要】在介绍MrBayes 3.1程序基本特点以及Nexus文件准备的基础上,选取普通DNA序列、普通蛋白质序列、含编码区域的DNA序列、mRNA序列以及混合型数据文件为例分别介绍了MrBayes 3.1程序的基本使用方法,为初学者正确使用该程序提供了操作指南,同时为深入学习与掌握该程序的特殊用途打好基础.【总页数】5页(P16665-16669)
【作者】王勇;陈克平;姚勤
【作者单位】江苏大学食品与生物工程学院,江苏镇江212013;江苏大学生命科学研究院,江苏镇江212013;江苏大学生命科学研究院,江苏镇江212013
【正文语种】中文
【中图分类】TP311
【相关文献】
1.系统发生分析软件PAUP和TreePuzzle使用方法介绍 [J], 王勇;陈克平;姚勤
2.管道应力分析程序使用的深入探讨 [J], 文渊;
3.使用电力系统分析程序对励磁参数的整定 [J], 王琳;翟晓佳
4.管道应力分析程序使用的深入探讨 [J], 文渊
5.MrBayes分子钟定年之程序 [J], 张驰
因版权原因,仅展示原文概要,查看原文内容请购买。
< >内为需要输入的内容,但不包括括号。
所有命令都需要在MrBayes >的提示下才能输入。
文件格式:文件输入,输入格式为Nexus file(ASCII,a simple text file,如图):或者还有其他信息:interleave=yes 代表数据矩阵为交叉序列interleaved sequencesnexus文件可由MacClade或者Mesquite生成。
但Mrbayes并不支持the full Nexus standard。
同时,Mrbayes象其它许多系统软件一样允许模糊特点,如:如果一个特点有两个状态2、3,可以表示为:(23),(2,3),{23}或者{2,3}。
但除了DNA{A, C, G, T, R, Y, M, K,S, W, H, B, V, D, N}、RNA{A, C, G, U, R, Y, M, K, S, W, H, B, V, D, N}、Protein {A, R, N, D, C, Q, E, G, H, I, L, K, M, F, P, S, T, W, Y, V, X}、二进制数据{0, 1}、标准数据(形态学数据){0, 1, 2, 3, 4, 5, 6, 5, 7, 8, 9}外,并不支持其他数据或者符号形式。
执行文件:execute <filename>或缩写exe <filename>,注意:文件必须在程序所在的文件夹(或者指明文件具体路径),文件名中不能含有空格,如果执行成功,执行窗口会自动输出文件的简单信息。
选定模型:通常至少需要两个命令,lset和prset,lset用于定义模型的结构,prset用于定义模型参数的先验概率分布。
在进行分析之前可以执行showmodel命令检查当前矩阵模型的设置。
或者执行help lset检查默认设置(如图):略Nucmodel用于指定DNA模型的一般类型。
我们通常选取标准的核苷酸替代模型nucleotide substitution model,即默认选项4by4。
另外,Doublet选项用于paired stem regions of ribosomal DNA的分析,Codon选项用于DNA sequence in terms of its codons的分析。
替代模型的一般结构一般由Nst设置决定。
默认状态下,所有的置换比率相同,对应于F81模型(JC model)。
一般我们选用GTR模型,即nst=6。
Code设置只有在DNA模型设置为codon的情况下才使用。
Ploidy设置也与我们无关。
Rates通常设置为invgamma (gamma-shaped rate variation with a proportion of invariable sites),Ngammacat(the number of discrete categories used to approximate the gamma distribution)一般采用默认选项4。
通常这个设置已经足够,增加该选项设置的数量可能会增加似然计算的精确性,但所花时间也成比例增加,大多数情况下,由增加该数值对结果的影响可以忽略不计。
余下的选项中,只有Covarion和Parsmodel与单核苷酸模型相关,而我们既不会采用parsimony model,也不会采用the covariotide model,故保留默认状态。
在对矩阵作了以上修改后,重新输入help lset命令,可以查看变化后的设置。
设置先验参数prior:现在可以为模型设置先验参数了。
模型有6种类型的参数:the topology, the branch lengths, the four stationary frequencies of the nucleotides, the six different nucleotide substitution rates, the proportion of invariable sites, andthe shape parameter of the gamma distribution of rate variation.默认参数在大多数分析中都已足够,通常不许修改,如需立即使用,这部分可以跳过。
通过输入help prset可以获得模型的各参数默认设置列表:略,我们只对Revmatpr (for the six substitution rates of the GTR rate matrix), Statefreqpr (for the stationary nucleotide frequencies of the GTR rate matrix), Shapepr (for the shape parameter of the gamma distribution of rate variation), Pinvarpr (for the proportion of invariable sites), Topologypr (for the topology), Brlenspr (for the branch lengths) 这几项设置作简单介绍。
Revmatpr and Statefreqpr的默认的先验概率密度prior probability density都是a flat Dirichlet (所有值都为1.0) 。
有时可能需要把Statefreqpr设置为equal,比如在JC and SYM模型下,命令prset statefreqpr=fixed(equal)。
如果我们要对默认的statefreqpr的flat Dirichlet prior状态加以强调,即equal nucleotide frequencies。
可以输入命令prset statefreqpr= Dirichlet(10,10,10,10),或者更甚的强调prset statefreqpr=Dirichlet(100,100,100,100)。
如果修改了该选项后想改回来,输入prset statefreqpr=Dirichlet(1,1,1,1)或者prsst= Dir(1,1,1,1)。
Shapepr参数定义the prior for the α (shape) parameter of the gamma distribution of rate variation.Pinvarpr参数定义the prior for the proportion of invariable sites。
Topologypr参数默认设置uniform puts equal probability on all distinct, fully resolved topologies.The alternative is to constrain some nodes in the tree to always be present but we will not attempt that in this analysis.Brlenspr参数可以设置为unconstrained或者clock-constrained。
默认为unconstrained,对于没有分子钟的树,the branch length prior可以设置为指数的exponential或者均一的uniform,默认为指数的,参数为10.0,对大多分析都合适。
可以在分析前输入showmodel命令检查模型的设置。
分析及设置:由mcmc命令设置参数并开始分析。
在设置前可以输入help mcmc命令查看默认设置。
Seed是随机数产生器随机输出的一个种子数值。
Swapseed是单独的用于产生随机交换序列the chain swapping sequence的随机数产生器。
除非特别指定,这两个值由系统时钟生成。
Ngen(number of generations)设置分析要跑的代数。
通常可以先设置较少的代数以确认分析的各项设置正常,并可以估计一个较长的分析所要花的时间和代数。
如果要设置ngen值但不想立即开始分析,可以使用mcmcp命令,如mcmcp ngen=10000。
默认状态下,bayes会同时运行两个(Nruns = 2)完全独立的但由不同的随机树开始的分析。
一般采取默认设置。
检查Mcmcdiagn 参数是否设置为yes,Diagnfreq 是否设置为一个合适的值,如默认的每第1000代(可以更改)。
这样bayes会在每第1000代计算各种运行(分析)的诊断,并把它们保存在一个<filename>.mcmc 的文件中。
最重要的诊断,不同分析中树取样the tree samples的相似性的衡量,也会在每1000代输出到屏幕上。
每一次诊断完成,一个固定数量(burnin)或者比例(burninfrac)的样品会被丢弃。
Relburnin参数定义是使用固定数量(relburnin=no)还是百分比(relburnin=yes)。
默认状态为(relburnin=yes and burninfrac=0.25),即每个诊断完成,25%的样品被丢弃。
默认状态下,bayes会使用Metropolis coupling提高the MCMC sampling of the target distribution。
Swapfreq, Nswaps, Nchains和Temp四个参数一起控制Metropolis coupling行为。
Nchains设置为1,不使用heating。
设置为n,n-1个热链heated chains被使用。
默认n=4,表示bayes会使用3个热链和1个"cold" chain。
根据经验,heating对于大于50个类群(序列)的分析是很重要的。
增加热链数量对于分析大的困难的数据集可能有帮助。
但分析时间也会随着链的增加成比例增加。
MPI版本的程序要好些,时间影响较小。
Bayes使用一种增值的热方案an incremental heating scheme,该方案下,通过增加其后验概率,链i被heated 到the power 1/ (1 + iλ),其中λ是由Temp参数控制。
Heating的作用是保持后验概率平稳flatten out the posterior probability,以便热链可以轻松找到后验概率中的峰isolated peaks,帮助冷链cold chain快速通过这些峰。
每第Swapfreq代,会从两条链中随机抽取并交换它们的状态an attempt is made to swap their states。