动态信号分析仪原理
- 格式:docx
- 大小:124.18 KB
- 文档页数:1
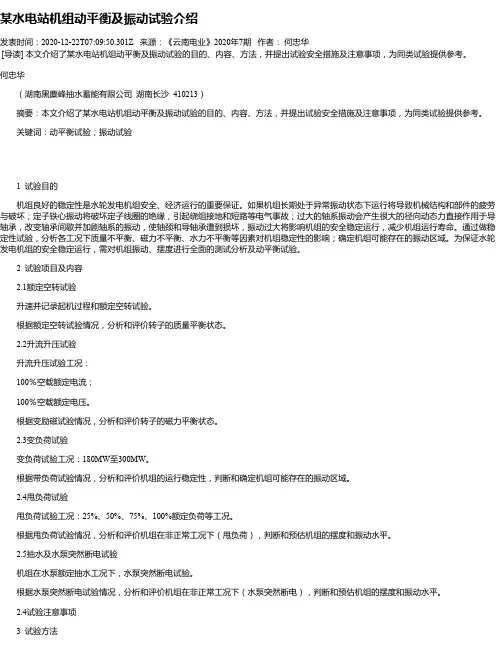
某水电站机组动平衡及振动试验介绍发表时间:2020-12-22T07:09:50.301Z 来源:《云南电业》2020年7期作者:何忠华[导读] 本文介绍了某水电站机组动平衡及振动试验的目的、内容、方法,并提出试验安全措施及注意事项,为同类试验提供参考。
何忠华(湖南黑麋峰抽水蓄能有限公司湖南长沙 410213)摘要:本文介绍了某水电站机组动平衡及振动试验的目的、内容、方法,并提出试验安全措施及注意事项,为同类试验提供参考。
关键词:动平衡试验;振动试验1 试验目的机组良好的稳定性是水轮发电机组安全、经济运行的重要保证。
如果机组长期处于异常振动状态下运行将导致机械结构和部件的疲劳与破坏;定子铁心振动将破坏定子线圈的绝缘,引起绕组接地和短路等电气事故;过大的轴系振动会产生很大的径向动态力直接作用于导轴承,改变轴承间歇并加剧轴系的振动,使轴颈和导轴承遭到损坏,振动过大将影响机组的安全稳定运行,减少机组运行寿命。
通过做稳定性试验,分析各工况下质量不平衡、磁力不平衡、水力不平衡等因素对机组稳定性的影响;确定机组可能存在的振动区域。
为保证水轮发电机组的安全稳定运行,需对机组振动、摆度进行全面的测试分析及动平衡试验。
2 试验项目及内容 2.1额定空转试验升速并记录起机过程和额定空转试验。
根据额定空转试验情况,分析和评价转子的质量平衡状态。
2.2升流升压试验升流升压试验工况: 100%空载额定电流; 100%空载额定电压。
根据变励磁试验情况,分析和评价转子的磁力平衡状态。
2.3变负荷试验变负荷试验工况:180MW至300MW。
根据带负荷试验情况,分析和评价机组的运行稳定性,判断和确定机组可能存在的振动区域。
2.4甩负荷试验甩负荷试验工况:25%、50%、75%、100%额定负荷等工况。
根据甩负荷试验情况,分析和评价机组在非正常工况下(甩负荷),判断和预估机组的摆度和振动水平。
2.5抽水及水泵突然断电试验机组在水泵额定抽水工况下,水泵突然断电试验。
动态信号分析仪安全操作及保养规程动态信号分析仪是一种被广泛应用于各类工业生产领域的高科技仪器设备,它能够通过采集物体振动的动态信号并将其进行分析,从而帮助用户检测出物体内部的缺陷和故障,辅助用户制定有效的维修和保养方案。
为了更好地保证动态信号分析仪的正常使用和延长其使用寿命,以下将为您介绍它的安全操作和保养规程。
安全操作1. 操作员应具备一定的技术知识在进行动态信号分析仪的操作时,操作员应具备一定的技术知识,了解其原理和工作方式。
如果是初次操作,操作员应事先进行相关的培训和指导,跟随有经验的人员参与实操,熟悉仪器的使用方法和操作流程,确保技能水平和安全意识符合要求。
2. 正确连接电源和信号线在接入电源前,应检查电源和电压是否符合动态信号分析仪的电气参数要求,避免供电不足或过大,导致设备损坏。
接线时应注意线路接法是否正确,电源线和信号线要分别接在相应的接口上,以免设备受到电击或触电事故发生。
3. 使用过程中应注意安全防护措施操作过程中应佩戴防静电手套,并注意保护设备不受损伤,设备外壳应经常擦拭,避免受到外界污染。
保持操作现场清洁、整洁、安全,避免绊倒、滑倒等意外事故的发生。
在设备运转时,应保持身体稳定,防止摇摆和跌倒。
4. 关闭设备前,应注意操作步骤在关闭设备之前,应先关闭设备的软件,在断开电源之前,给设备一定的停机时间,保证设备内的部件安全、准确、稳定地停止运转,然后再关掉电源,避免短路和电流浪涌对设备的损害。
保养规程1. 定期清理设备动态信号分析仪的频率转换器、计算机等部件上会积累灰尘、油污和异物,影响设备正常工作,因此需要定期进行清洗。
清洁时应避免使用含有酸性、碱性、易挥发的化学药品,轻微的灰尘可以用柔软的毛刷或清洁布擦拭。
2. 注意电源接口的保养动态信号分析仪的电源口很容易受到污染,长时间不进行干净的保养和维护,会使电源接口损坏,该接口损坏后会影响设备使用,因此要定期进行检查和清洁。
3. 驱动器的保养动态信号分析仪中的驱动器是重要部件,如果不注意保养就会出现摩擦、磨损等情况。
动态信号分析仪的特点都有哪些呢动态信号分析仪是用于测量和分析机械和电子设备中的振动、震动和噪音等动态信号的精密仪器。
它具有高精度、高速度、高灵敏度和高可靠性等特点。
本文将对动态信号分析仪的特点进行详细介绍。
1. 高精度动态信号分析仪采用了高精度、高速度的模数转换技术,可以对微弱的信号进行高精度的测量和分析。
它能够在高噪声环境下进行信号采集和分析,提高数据的可靠性和准确性。
同时,其具有高辨析度和高灵敏度,能够准确地检测和诊断机械设备中的故障和缺陷。
2. 高速度动态信号分析仪具备高速度的数据采集和处理能力,可以在短时间内采集和处理大量数据。
其采用了实时监测技术,能够对设备运行状态进行持续监测和分析,及时捕捉故障信号,快速反应和解决设备故障,有效提高设备的可靠性和安全性。
3. 多功能性动态信号分析仪具有多种功能,可以进行振动分析、频谱分析、时间频率分析、谐波分析、共振测试、幅值分析、相位分析等多项功能。
它能够满足不同范围的检测要求,适用于各种机械和电子设备中的振动、震动和噪音分析。
4. 易于操作动态信号分析仪采用了人性化的操作界面和简便的操作方式,可以快速上手操作。
同时,其具有自动化测试和诊断功能,能够自动识别和分析故障信号,提高工作效率和准确性。
此外,动态信号分析仪还支持远程监控和控制,使得远程工程师可以通过互联网等远程通信手段对设备进行监控和诊断。
5. 高可靠性动态信号分析仪采用了高品质的元器件和制造工艺,具有高可靠性和长寿命。
其外壳采用高强度、防水、防尘、防腐蚀的材料,能够在恶劣环境下工作。
同时,其具有自诊断和自校准功能,能够保证设备的稳定性和准确性。
6. 可拓展性动态信号分析仪具有良好的可拓展性,可以与其他测试设备、数字信号处理器等设备相连接,实现更为精细的检测和分析。
其支持多种接口和通讯协议,具有较高的兼容性和可扩展性。
综上所述,动态信号分析仪具有高精度、高速度、高灵敏度、高可靠性、多功能性、易于操作和可拓展性等多项特点,是工业领域中进行振动、震动和噪音分析的理想设备之一。
动态信号分析仪的特点都有哪些呢分析仪操作规程动态信号分析仪是一款便携式多通道并行同步采样的动态信号测试分析系统;包含动态信号测试分析系统所需的直流电压放大器、抗混滤波器、A/D转换器、DSP实动态信号分析仪是一款便携式多通道并行同步采样的动态信号测试分析系统;包含动态信号测试分析系统所需的直流电压放大器、抗混滤波器、A/D转换器、DSP实时信号处理系统、锂电池组及采样控制和计算机通讯的全部硬件;以及操作简便的管理和分析软件,用于多通道电压、电荷、ICP 传感器及4~20mA变送器的输出信号的采集和分析。
特点:高度便携:利用计算机的1394接口实时进行数据传送, 实现了热拔插和即插即用;并且较大程度上满足了对便携式仪器和采样速度的要求,测试系统不仅可在实验室使用,也可方便地应用于生产现场;高度集成:模块化设计的硬件,每个测量机箱可插入两个4通道数采和1通道转速测量模块;每台计算机可控制8通道数采和2通道转速同步并行采样,满足了多通道、高精度、高速动态信号的测量需求;每通道包含独立的DSP实时信号处理系统:可选择的模拟滤波 + DSP实时数字滤波,构成高性能抗混滤波器,还可根据转速周期,实时完成连续的整周期采样;每通道独立的16位A/D转换器:实现了多通道并行同步采样,通道间无串扰影响及采样速率不受通道数的限制,大大提高了系统的抗干扰能力;准确的采样速率:先进的DDS数字频率合成技术产生高精度、高稳定度的采样脉冲,保证了多通道采样速率的同步性、准确性和稳定性;数字磁带机信号记录功能:利用计算机海量的存储硬盘,长时间实时、无间断记录多通道信号;DMA方式传送数据:测试数据通过嵌入式实时操作环境下,DMA方式实时传送,保证了数据传送的高速、稳定、不漏码;先进的工艺:多层线路板,全贴片工艺,大大提高了硬件的可靠性和抗干扰能力;供电:智能化管理的可充电锂电池组供电;完全便携:防潮、防振设计,工作温度范围可拓宽至-10℃~60℃;信号适调器:配套各种可程控的信号适调器(包括电压适调模块、应变适调模块、电荷适调模块、双恒流源应变适调模块);不仅具有极强的抗干扰能力,而且由于参数由数采统一控制,系统的单位量纲实现了“傻瓜”设置。
网络分析仪培训资料在当今的电子通信领域,网络分析仪作为一种重要的测试测量仪器,发挥着不可或缺的作用。
无论是研发新型电子设备,还是对现有网络进行维护和优化,都离不开网络分析仪的精准测量和分析。
为了帮助大家更好地掌握网络分析仪的使用方法和技术,本文将对其进行详细的介绍和培训。
一、网络分析仪的基本原理网络分析仪是一种用于测量网络参数的仪器,它可以测量诸如反射系数、传输系数、阻抗、增益、相位等参数。
其基本原理是通过向被测网络施加激励信号,并测量响应信号,然后通过计算和分析得到网络的各种参数。
网络分析仪通常由信号源、接收机、测试装置和数据分析处理单元组成。
信号源产生特定频率和功率的测试信号,接收机用于测量被测网络的响应信号。
测试装置则将测试信号和响应信号进行适当的处理和转换,以便于数据分析处理单元进行计算和分析。
二、网络分析仪的类型根据不同的应用需求和测量精度,网络分析仪可以分为多种类型。
常见的有标量网络分析仪和矢量网络分析仪。
标量网络分析仪主要测量信号的幅度特性,如衰减和增益等。
它相对简单,价格较低,但无法提供相位信息。
矢量网络分析仪则不仅可以测量信号的幅度,还可以测量相位信息,能够更全面地描述被测网络的特性。
但矢量网络分析仪通常价格较高,操作也相对复杂。
此外,还有手持式网络分析仪和台式网络分析仪之分。
手持式网络分析仪便于携带,适用于现场测试;台式网络分析仪则精度更高,功能更强大,适用于实验室和研发环境。
三、网络分析仪的主要技术指标在选择和使用网络分析仪时,需要了解一些重要的技术指标,以确保其能够满足测量需求。
1、频率范围:网络分析仪能够测量的频率范围,这是根据具体的应用需求来选择的。
2、测量精度:包括幅度精度和相位精度,精度越高,测量结果越准确。
3、动态范围:表示网络分析仪能够测量的最大信号和最小信号之间的比值。
4、分辨率:指能够分辨的最小频率间隔和幅度变化。
四、网络分析仪的操作步骤1、连接设备首先,将网络分析仪与被测网络正确连接。
振动测量仪器知识一、概述(一)用途振动测量仪器是一种测量物体机械振动的测量仪器.测量的基本量是振动的加速度、速度和位移等,可以测量机械振动和冲击振动的有效值、峰值等,频率范围从零点几赫兹~几千赫兹。
外部联接或内部设置带通滤波器,可以进行噪声的频谱分析.随着电子技术尤其是大规模集成电路和计算机技术的发展,振动测量仪器的许多功能都通过数字信号处理技术代替模拟电路来实现。
这不仅使得电路更加简化,动态范围更宽,而且功能和稳定性也大大提高,尤其是可以实现实时频谱分析,使振动测量仪器的用途更加广泛。
(二)分类与特点振动测量仪器按功能来分:分为工作测振仪、振动烈度计、振动分析仪、激振器(或振动台)、振动激励控制器、振动校准器测量机械振动,具有频谱分析功能的称为频谱分析仪,具有实时频谱分析功能的称为实时频谱分析仪或实时信号分析仪,具有多路测量功能的多通道声学分析仪。
振动测量仪器按采用技术来分:分为模拟振动计、数字化振动计和多通道实时信号分析仪。
振动测量仪器按测量对象来分:分为测量机械振动的通用振动计,测量振动对人体影响的人体(响应)振动计、测量环境振动的环境振动仪和振动激励控制器。
●工作测振仪特点通常是手持式,操作简单、价格便宜,只测量并显示振动的加速度、速度和位移等。
以前用电表显示测量值,现在都是用数字显示。
通常不带数据储存和打印功能,用于一般振动测量。
振动烈度计是指专用于测量振动烈度(10 Hz~1000 Hz频率范围的速度有效值)的振动测量仪器。
●实时信号分析仪特点实时信号分析仪是一种数字频率分析仪,它采用数字信号处理技术代替模拟电路来进行振动的测量和频谱分析。
当模拟信号通过采样及A/D转换成数字信号后,进入数字计算机进行运算,实现各种测量和分析功能。
实时信号分析仪可同时测量加速度、速度和位移,均方根、峰值(Peak)、峰—峰值(Peak—Peak)检波可并行工作。
不仅分析速度快,而且也能分析瞬态信号,在显示器上实时显示出频谱变化,还可将分析得到的数据输出并记录下来.●动态信号测试和分析系统特点包含多路高性能数据采集、多功能信号发生、基本信号分析,还可以选择高级信号分析;以及模态分析、故障分析等应用。
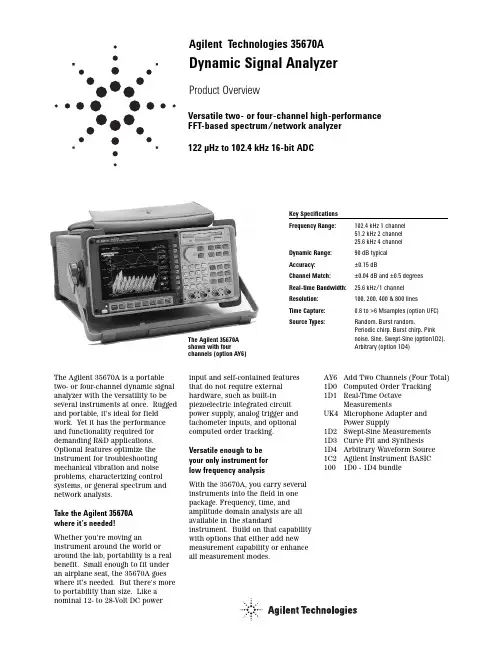
Agilent Technologies 35670A Dynamic Signal AnalyzerProduct OverviewThe Agilent 35670A is a portable two- or four-channel dynamic signal analyzer with the versatility to be several instruments at once. Rugged and portable, it’s ideal for field work. Yet it has the performance and functionality required for demanding R&D applications. Optional features optimize the instrument for troubleshooting mechanical vibration and noise problems, characterizing control systems, or general spectrum and network analysis.Take the Agilent 35670Awhere it’s needed!Whether you’re moving an instrument around the world or around the lab, portability is a real benefit. Small enough to fit under an airplane seat, the 35670A goes where it’s needed. But there’s more to portability than size. Like a nominal 12- to 28-Volt DC power input and self-contained featuresthat do not require externalhardware, such as built-inpiezoelectric integrated circuitpower supply, analog trigger andtachometer inputs, and optionalcomputed order tracking.Versatile enough to beyour only instrument forlow frequency analysisWith the 35670A, you carry severalinstruments into the field in onepackage. Frequency, time, andamplitude domain analysis are allavailable in the standardinstrument. Build on that capabilitywith options that either add newmeasurement capability or enhanceall measurement modes.Versatile two- or four-channel high-performanceFFT-based spectrum/network analyzer122 µHz to 102.4 kHz 16-bit ADCKey SpecificationsFrequency Range:102.4 kHz 1 channel51.2 kHz 2 channel25.6 kHz 4 channelDynamic Range:90 dB typicalAccuracy:±0.15 dBChannel Match:±0.04 dB and ±0.5 degreesReal-time Bandwidth: 25.6 kHz/1 channelResolution:100, 200, 400 & 800 linesTime Capture:0.8 to >6 Msamples (option UFC)Source Types:Random, Burst random,Periodic chirp, Burst chirp, Pinknoise, Sine, Swept-Sine (option1D2),Arbitrary (option 1D4)The Agilent 35670Ashown with fourchannels (option AY6)AY6Add Two Channels (Four Total)1D0Computed Order Tracking1D1Real-Time OctaveMeasurementsUK4Microphone Adapter andPower Supply1D2Swept-Sine Measurements1D3Curve Fit and Synthesis1D4Arbitrary Waveform Source1C2Agilent Instrument BASIC1001D0 - 1D4 bundle2Agilent 35670ADynamic Signal AnalyzerShown with option AY6 - Add Two ChannelsInput Channels•Analog A-weighted fil-ters (switchable)•Transducer sensitivity input•Engineering units: g, m/s 2, m/s, m, in/s 2, in/s, in, mil, kg, dyn, lb,N, and pascals •Built-in 4 mAconstant current power supply(17 cm) display Display area is not compromised by portabilityPrecisionMeasurements •16-bit ADC•±0.15 dB spectrum amplitude accuracy •±0.04 dB, ±0.5degrees channel match (full scale)•90 dB dynamic range (typical)•130 dB dynamic range with swept-sine (option 1D2)•Up/Down autorange •Up only autorangeMath FunctionsPowerful math and data editing functions to quickly modify meas-urement results. (Curve fit and frequency responsesynthesis available with option 1D3.)Built-In 3.5 inch Flexible Disk Drive Store instrument states,programs, time captured data, waterfall data,trace data, limits, math functions, data tables,and curve fit/synthesis tables.Supported disk formats are HP-LIF andMS-DOS. Internal RAM may also beformatted as storage disk.Powerful Markers Extract information from measurement data with trace and special markers:•Individual Trace •Coupled Trace•Absolute or Relative •Peak Search •Harmonic •Band•Sideband Power •Waterfall•Time Parameter •Frequency and DampingVersatileMeasurement Modes Standard and optionalmeasurement modes include:•FFT Analysis•Real-Time Octave Analysis (option 1D1)•Order Analysis (option 1D0)•Swept-Sine (option 1D2)•Correlation Analysis •Histogram Analysis •Time CaptureAll measurement options may be retrofitted.RPM Display Read RPM in any measurement modeAgilent Instrument BASIC (Option 1C2)Develop a customuser-interface, integrate several instruments and peripherals into a system using the 35670A as the system controller, or simply automate measurements.Online Help Applications oriented help is just a few keystrokes away.Source Types •Random Noise •Burst Random Noise •Periodic Chirp •Burst Chirp •Pink Noise •Fixed Sine •Arbitrary Waveform Source (Option 1D4)•Swept-Sine Source (Option 1D2) Note: The source is located on the front panel of a standard two-channel 35670A.GPIB ConnectorIntegrate the35670A with otherinstruments andperipherals forsystem operationor printing/plotting.System controllerfor GPIB (IEEE-488.1and 488.2) compati-ble instrumentationvia AgilentInstrument BASIC(option 1C2).Provides direct con-trol of GPIB printers,plotters,and HP SS80 diskdrives.Serial PortPlot to HP-GLplotters or print toHP-GL and rasterprinters.Parallel PortPlot to HP-GL plottersor print to HP-GL andraster printers.DC PowerAccepts 12 to 28 voltsdc (nominal). Use the35250A power cable forDC power source con-nection, or the 35251Apower cable with ciga-rette-lighter adapter.Low Noise FanFan may be turnedoff for acousticapplications.Running speed dependsonambienttemperature.External MonitorDrive a VGA monitorfor remote viewing bylarge groups.Tachometer(42 Volt Peak Max)No external signalconditioning hardwarerequired. Readsfrequency (RPM) onselected levelsbetween ±20 Volts.External Trigger(42 Volt Peak Max)No external signalconditioning hardwarerequired. Triggers onselected levelbetween ±10 Volts.KeyboardUse a standard PCkeyboard to title data,edit Agilent InstrumentBASIC programs,or to operate theinstrument.Power SelectSwitch betweenAC and DC powersources withoutinterrupting instru-ment operation.AC PowerUniversal powersupply will operatewith anycombination ofvoltage between100 and 240 VACand line frequencybetween 47 and440 Hz. Themaximum powerrequirement is350 VA.34Laboratory-qualitymeasurements in the fieldObtain all of the performance of your bench-top analyzer in a portable instrument.Ease-of-usePortability, versatility, and perfor-mance are valued attributes, but to be really valuable an instrument must also be easy to use. The 35670A has a friendly front panel,plus online help that’s alwaysavailable to answer your questions.An interactive measurement state lets you configure the instrumentsetup from a single display.Two spectrums of road induced vibration measured at different speeds are comparedusing the front/back modeof the Agilent 35670A.FFT-based spectrum analyzers, such as the 35670A, are ideal for measuring the spectra of low-frequency signals like speech or mechanical vibration. Transient components,usually missed with swept-frequency analyzers, are easily measured and displayed at speeds fast enough to follow trends. The 35670A has both the performance and features required to take full advantage of this technology.16-Bits for High PerformanceWith a 16-bit ADC (90 dB typical dynamic range) and a real-time bandwidth of 25.6 kHz, you can be sure nothing will be missed. Resolve signals using 100 to 1600 lines resolution, or for really close-in analysis, use frequency zoom to resolve signals with up to 61 µHz resolution. Use time or RPM arming to develop waterfalls of sequential vibration spectra for trend analysis or for an overview of device vibration.Power and Linear SpectrumsMatch your spectrum measurement mode to the signal being tested. Use linear spectrum analysis to measure both the amplitude and phase of periodic signals such as the spectra of rotating machinery.Power spectrum analysis is provided for averaging nonrepetitive signals.AveragingVarious averaging modes let you further refine spectrum analysis measurements. Time averaging extracts repetitive signals out of the noise while rms averagingreduces the noise to its mean value.Exponential averaging, available for both time and rms averaging, is useful for reducing the noise while following changing signals—tracking the resonance shifts in a fatiguing structure for example.Spectrum Analysis5Time DomainUse your spectrum analyzer as alow-frequency oscilloscope or view signals in the time and frequency domains simultaneously. (Note: anti-alias filters can be switched off.) Special markers for time-domain data facilitate extraction of key control system performance parameters: overshoot, rise time,setting time, and delay time.Data TableUse a tabular format to keep track of key frequencies in the spectra of rotating machinery. The amplitude and frequency of the signal and a 16-character entry label field are listed for each selected point.Automatic Units ConversionDisplay vibration data in the units of your choice. Select g, m/sec 2, in/sec 2, m/s, in/s, m, mil, inch, Kg, lb, N, dyn,or pascals as appropriate for your application.The instrument automatically converts frequency-domain data from specified input transducer units to the units you select for display. For example, accelerometer data is automatically converted and displayed as mils when mils are selected. Of course, dB, dBV, dBm and volts are available for electrical applications.MarkersMarkers streamline analysis by helping you select and display specific data. Marker functions include marker to peak, next right peak, and coupled markers for selecting points in multiple data displays. Markers readouts are absolute or relative to your selected reference.Special MarkersThree special marker functions facilitate analysis of your spectral data. Sideband markers aid analysis of modulation signals. Use thisfunction to quickly locate sidebands in the complicated spectra of rotating machines. A band-power marker reads the total power in a selected band of frequencies and a total harmonic distortion marker lets you calculate total harmonic distortion without including the effects of noise.Measurement results at key frequencies can be labeled and listed using data table.Harmonic markers are used to calculate the THD of a signal without including the effects of noise.Simultaneousdisplay of frequency and time domain data facilitates analysis of gear mesh vibration.6The 35670A has the flexibility to make measurements of both electrical networks and mechanical devices. FFT-based network analysis is fast enough to allow real-time adjustments of circuit parameters while the swept-sine option provides exacting measurements over more than six frequency decades, and a 130 dB dynamic range.SourceSelect the optimum stimulus for each application—random noise,periodic chirp, pink noise, fixed sine, burst random, and burst chirp.For zoomed network analysismeasurements, the source is band-translated to match the zoom span at frequencies up to 51.2 kHz. An optional arbitrary source lets you test your product using real-world signals. A ±10 Volt DC source offset facilitates tests of control systems.Impact TestingForce and exponential windows allow impact testing for modal and structural analysis. Quality measurements are ensured using preview and accept/reject during averaging. A 4 mA constant current transducer power supply is built-in for true portability.Frequency ResponseMeasurementsLimits are used for go/no go testing in production. The response of an accelerometer is being checked inthis example.Characteristics of a selected resonance are automatically calculated from an impact measurement using the frequency and damping marker.LimitsTest network measurements against preset limits. Up to 800 separate line segments are available for setting upper and lower limits.Limits are also used for testing spectrum measurements.Four Channels (option AY6)Test up to three devicessimultaneously with a four-channel 35670A. Channel one is the common reference channel and two, three,and four are the response channels.Alternatively, select channels one and three as reference channels for two totally independent network measurements. See option AY6 description for more information.7MarkersA frequency and damping marker provides the resonant frequency and the damping ratio of single-degree-of-freedom frequency response measurements.Gain and phase margin markers extract key frequency-domain stability data from frequency response measurements of control systems.Signal Injection for Control LoopsUse one of three Agilent signal injection devices for testing control loops. The 35280A summing junction provides convenient DC to 1 MHz signal injection for most control loops. Use the 35281A clip-on transformer when it is not possible to temporarily open the loop, or use the 35282A signal injection transformer when secondary voltages are up to 600 Vpk.Capture transient events or time histories for complete analysis in any measurement mode (except swept-sine). Use either the entire time-capture record or a selected region of interest for repetitive analysis in the FFT, octave, order track, correlation or histogram instrument modes.Standard 16 Mbytes of memory for deep time-capture capability.Time CaptureAn interval of time-capture data has been selected for analysis in the octave mode.8Taking the measurement is only half the job. Raw measurement data must be stored, recalled, printed,plotted, integrated with other data for analysis, and reported. The 35670A has a variety of tools to help you finish the job.Enhanced Data Transfer Utilities for PCsStandard Data Format (SDF)Utilities, provided with the 35670A,allow you to easily move data from the instrument to wherever it’s needed:Using Measurement ResultsSelf-contained—no ratio synthesizer or tracking filter required Order Maps Order Tracking RPM or Time Trigger Display RPM ProfileTrack Up to Five Orders/Channel Up to 200 Orders Composite Power RPM MeasurementsOrder tracking facilitates evaluation of spectra from rotating machines by displaying vibration data as a function of orders (or harmonics)rather than frequency.All measurement spectra is normalized to the shaft RPM.Now you can have order tracking without compromising portability.Traditional analog order tracking techniques require external tracking filters and ratio synthesizers. With Agilent’s computed order tracking algorithm, external hardware is gone.Because order tracking isimplemented in the software, data is more precise and your job is easier. Compared to traditional analogorder tracking techniques, computed order tracking offers:Computed Order Tracking(Option 1D0)The slice marker feature is used to select and display an order or suborder from an order map.•For general digital signal processingand filtering , translate data files to formats compatible with MATLAB and MATRIX X , Data Set 58, or ASCII for use in popular spreadsheets.•For specific applications, useapplication software that reads SDF files directly, such as STARModal and STARAcoustics from SMS and CADA-PC from LMS.•Transfer data to and from the 35665A, 3566A, 3567A, 3562A,3563A.•Use the viewdata feature to display data on your PC or to convert to the HP-GL format for transfer to Microsoft’s Word for Windows or Lotus’ AMI PRO word processing software.•Convert between HP-LIF and MS-DOS ®formats.•Read data files into a program.Documented ResultsThe 35670A supports a variety of GPIB, serial and parallel printers and plotters for direct hardcopy output.The internal 3.5 inch flexible disk drive stores data, instrument states,HP-GL plots and Agilent Instrument BASIC programs in HP-LIF or MS-DOS formats for future recall or use on HP workstations or a personal computer.Entire display screens can be import-ed directly into your word processing program by plotting HP-GL files to your named DOS file. HP-GL files are interpreted and displayed directly by Microsoft’s Word for Windows and AMI PRO from Lotus Development Corp.•Improved dynamic range athigh orders•More accurate tracking of rapidly changing shaft speeds•Accurate RPM labeled spectra with exact RPM trigger arm •Wide 64:1 ratio of start to stop RPMsOrder MapUse order maps for an overview of vibration data versus RPM or time.Display the amplitude profile of individual orders and suborders using the slice marker function. Alternatively, use trace markers to select individual traces for display.MS-DOS and Microsoft are U.S. registered trademarks of Microsoft Corp.9Order TrackingMeasure only the data you need.Order tracking lets you measure the amplitude profile of up to five orders plus composite power simultaneously on each channel. Up to four orders or three orders and composite power can be dis-played simultaneously.RPM ProfileUse RPM profile to monitor the variation of RPM with time during order tracking measurements.Composite PowerComposite power provides the total signal power in a selected channel as a function of RPM.Run-Up and Run-Down MeasurementsRun-up and run-down measurements of any order are made using external trigger as the phase reference.Display the results as bode or polar plots; both are available.Markers allow convenient notation of important shaft speeds.OrbitsObtain oscilloscope-quality orbit measurements with your 35670A.Unlike traditional FFT analyzers, the 35670A equipped with computed order tracking displays a selected number of loops (usually one) as theshaft RPM is varied.Order tracking is used to simultaneously display up to four orders or a combination of orders,composite power and RPM profile.Markers are used to annotate shaft speeds at selected points in a run-up measurement.Oscilloscope-quality orbit diagrams mean you carry only one instrument onto the shop floor.10Real-Time Third Octave to 40 kHz ANSI S1.11-1986 Filter Shapes Microphone Inputs and Power A-Weighted Overall SPLRPM or Time-Triggered Waterfalls Eliminate the expense and inconvenience of multiple instruments in the field. With optional real-time octave analysis,and the optional microphoneadapter and power supply, you have a complete real-time octave analyzer added to your 35670A at a fraction of the cost of a second instrument.Now you can carry both your FFT and real-time octave analyzers to the job site in the same hand.Real-Time 1/3-Octave to 40 kHz on One ChannelWith two input channels of1/3-octave real-time measurements at frequencies up to 20 kHz, you get all of the information you’ll ever need to understand the noise performance of your product. No misinterpreted measurementsbecause transient components were missed. When the frequency range requirement is 10 kHz or less, use four channels to characterize spatial variations. For those exceptional circumstances, use 1/3-octave resolution at frequencies up to 40 kHz on a single channel.Resolutions of 1/1- and 1/12-octave are also available.Real-Time Octave Measurements (Option 1D1)Microphone Adapter and Power Supply (Option UK4)Overall sound pressure level and A-weighted sound pressure level can be displayed with the octave bands individually, together, or not at all.A fan-off mode lets you use the instrument in the sound field being measured.ANSI S1.11-1986All octave filters comply with filter shape standards ANSI S1.11-1986(Order 3, type 1-D), DIN 45651, and IEC 225-1966. An 80 dB dynamic range for the audio spectrumprovides the performance required by acousticians. Switchable analog A-weighting filters in the input channels comply fully with bothANSI S1.4-1983 and IEC 651-1979 Type 0.Advanced AnalysisUse waterfall displays of octave data for an overview of device noise versus time or RPM. Display individual frequency bands as a function of RPM or time using the slice marker function. Alternatively,use trace markers to select individual traces for display.A pink noise source is available for testing electro-acoustic devices.Sound LevelMeter MeasurementsPeak hold, impulse, fast, slow, and L eq are all provided with optional Real-time Octave Measurements. All measurements conform toIEC 651-1979 Type 0 - Impulse.Real-time 1/3-octave measurements at frequenciesup to 40 kHz.T his waterfall display of a flyover test can be analyzed trace-by-trace or by selecting time slices along thez-axis.Agilent 35670A with option UK4 microphone adapter and power supply.11130 dB Dynamic Range Logarithmic or Linear Sweeps “Auto” Frequency Resolution While FFT-based network analysis is fast and accurate, swept-sine measurements are a better choice when the device under test has a wide dynamic range or coversseveral decades of frequency e swept-sine measurements to extend the network measurement capabilities of the 35670A.Network Analysis Over a 130 dB RangeWith traditional swept-sine, the 35670A is optimally configured to measure each individual point in the frequency response. The result is a 130 dB dynamic range. With FFT-based network analysis, all frequency points are stimulated simultaneously and the instrument configures itself to measure thehighest amplitude response—thereby limiting the dynamic range.Characterize Nonlinear NetworksUse the auto-level feature to hold the input or output amplitude constant during a sweep. This provides the device response for a specific signal amplitude. With FFT-based network analysis using random noise, the randomamplitudes of the stimulus tend to “average out” the non-linearities and therefore does not capture thedependency of the response on the stimulus amplitude.Logarithmic SweepTest devices over more than six decades of frequency range using logarithmic sweep. In this mode,the frequency is automatically adjusted to provide the same resolution over each decade offrequency range. With FFT-network analysis, resolution is constant—not a problem when measuring over narrow frequency ranges.FlexibleMake the measurement your way.Independently select logarithmic or linear sweep, sweep up or down,automatic or manual sweep, and autoresolution.Automatic Frequency ResolutionUse autoresolution to obtain the fastest sweep possible without sacrificing accuracy. With autoresolution, the 35670Aautomatically adjusts the frequency step according to the deviceresponse. High rates of amplitude and phase change are matched with small frequency steps. Low rate-of-change regions are quickly measured with larger frequency steps.Test Multiple Devices SimultaneouslyIncrease throughput in production.Swept-sine measurements up to 25.6 kHz can be made on three devices simultaneously using swept-sine on a four-channel 35670A. Channel one is the common reference channel for these measurements.Alternatively, channels one and three can be designated asindependent reference channels for two totally independent swept-sine measurements.Swept-Sine Measurements(Option 1D2)The stability of a control loop is quickly character-ized using the gain and phase margin marker function.12Agilent Instrument BASIC (Option 1C2)Realize the advantages of using your instrument with a computer without sacrificing portability. Agilent Instrument BASIC provides the power of a computer inside your 35670A.Keystroke RecordingMost program development begins with keystroke recording. Each keystroke is automatically saved as a program instruction as you set up your measurement using the front panel. The recorded sequence can be used as the core of asophisticated program or run as an automatic sequence.Program entry and editing Program debugging Memory allocation Relation operators General math Graphics control Graphics plotting Graphics axes and labeling Program controlBinary functions Trigonometric operations String operations Logical operators GPIB control Mass storage Event initiated branching Clock and calendar General device I/O Array operationsOver 200 Agilent InstrumentBASIC Commands13Add Two Channels (Option AY6)Curve Fit and Synthesis (Option 1D3)51.2 kHz Frequency Range On One and Two Channels 25.6 kHz Frequency Range On Four ChannelsOne or Two Reference Channels Enhance your productivity by adding two additional inputchannels to your portable analyzer.Having four channels often means the difference between solving a problem in the field and having to schedule time in a test bay.Monitor four signals simultaneously or use channel one as thereference channel for up to three simultaneous cross-channel measurements. Two totally independent cross-channel measurements are made by selecting channels one and three as independent reference channels.All channels are sampled e triaxial measurements to simul-taneously characterize the motion of mechanical devices in three axes. For control systems, simultaneously measure several points in a single loop.20 Poles/20 Zeros Curve Fitter Frequency Response Synthesis Pole/Zero, Pole/Residue and Polynomial FormatUse curve fit and synthesis in the 35670A to take the guesswork out of your design process. The 20-pole and 20-zero multiple-degree-of-freedom curve fitter calculates a mathematical model of your system or circuit from measured frequency response data.The model can be expressed in pole/zero, pole/residue, orpolynomial format.Curve fit provides an exact mathematical model of your circuit or device.Transfer the circuit model to the synthesis function to experiment with design modifications. Add and delete poles and zeros, change gain factors, time delays, or frequency scaling, then synthesize the frequen-cy response from the modified model. Design modifications are tested without ever touching a sol-dering iron.14Standard 16 Mbytes RAMArbitrary Waveform Source (Option 1D4)Expand the data storage and time-capture capacity of your 35670A.Frequency or Time Domain Entry Data EditStore Up to Eight Arbitrary WaveformsTest your products using real-world signals. Measure a signal in either the time or frequency domain, then output it via the arbitrary waveform source. Use math functions and data edit to obtain precisely the output waveform you need. An arbitrary waveform may be output once or repeatedly.Standard source types can beoptimized for specific applications.For example, random noise can be shaped to improve the effectivedynamic range of your measurement.Alternatively, you can use data edit and math functions to create an arbitrary waveform.Use time capture as a digital tape recorder, then playback captured signals through the arbitrarywaveform source.Math functions are used to optimize a burst chirp signal for a frequency response measurement.Expand the data storage and time-capture capacity of your 35670A.Number of Spectra Stored Per ChannelStandard 16 MbyteFFT - 1 Channel 11400FFT- 2 Channels 2600FFT - 4 Channels 33001/3-Octave Spectra 448000Time Capture 1>6 MSamplesStandard 2 Mbyte Nonvolatile RAMUse the 2 Mbyte nonvolatile RAM in environments too harsh for the 3.5inch flexible disk drive. The memory functions as a high-speed disk for storage of the following information.•Instrument Setup States •Trace Data•User Math Definitions •Limit Data•Time Capture Buffers•Agilent Instrument BASIC Programs •Waterfall Display Data •Curve Fit/Synthesis Tables •Data TablesInformation stored in nonvolatile RAM is retained when the power is off.1Conditions: Preset with instrument mode switched to 1 channel.2Conditions: Preset3Conditions: Preset with instrument mode switched to 4 channels.4Conditions: Preset with instrument mode switched to octave.。
基于动态信号分析仪的便携式振动校准器的测量方法董平【摘要】It can also provide rapid calibration and inspection for those measuring, monitoring and recording system which be connected with. Based on the working principle of the portable vibration calibration and window function theory, taking dynamic signal analyzer (B&K PULSE 3560C) and standard accelerometer set (8305 / 2626) for detecting tool, using the experimental data as the evidence, this paper studies and sums up the effect degree of detection data’s accuracy influenced by the selection of window function during the process of the portable vibration calibrator detection.% 以便携式振动校准器工作原理和窗函数理论为基础,以B&K公司的PULSE 3560C动态信号分析仪和标准加速度计套组8305/2626为检测工具,以实验数据为佐证,研究并归纳出便携式振动校准器检测过程中窗函数的选择对检测数据准确性的影响程度【期刊名称】《上海计量测试》【年(卷),期】2012(000)004【总页数】3页(P10-12)【关键词】便携式振动校准器;动态信号分析仪;窗函数【作者】董平【作者单位】江苏省计量科学研究院【正文语种】中文0 引言振动校准器是一种便于携带并能用于测振仪和振动传感器(压电加速度探头)的校准激励器。

流动分析仪原理
流动分析仪是一种用来分析流动样品中的物质含量的仪器。
它采用了一种叫做流动分析法的分析原理,该原理通过控制和监测流体的流动过程,来实现对样品中目标物质含量的测定。
流动分析法的原理基于化学反应和物质浓度的相关性。
在流动分析仪中,样品通过一个连续的流体系统进行处理。
首先,样品被引入到一个注射器中,然后注射器上方设有一个控制阀门,用于控制样品的进入速度。
样品进入后,会与试剂相遇,并在反应器中发生化学反应。
在反应器中,目标物质与试剂发生反应,生成一个可测量的物理或化学信号。
这个信号可以是电流、光强度、吸光度等。
这个信号随着目标物质浓度的增加而不断变化。
通过监测信号的变化,我们可以得出样品中目标物质的浓度。
流动分析仪中的传感器被用来检测和测量上述信号的变化。
传感器通常会将信号转化为电信号,并通过电子系统进行放大、处理和记录。
通过与标准样品进行对比,我们可以得出最终的测量结果。
流动分析仪的优点是操作简单、灵敏度高、分析速度快,并且可以实现自动化。
它在环境分析、食品安全检测、生物医学研究等领域广泛应用。
需要注意的是,为了确保测量的准确性,流动分析仪的各个部分需要严格控制和校准,以消除误差和提高重复性。
此外,样
品的处理和试剂的选择也会对测量结果产生影响,因此需要进行仔细的优化和验证。
DH5922N动态信号测试分析系统使用说明书V1.0江苏东华测试技术股份有限公司目录第一章入门指南 (1)1.1认识产品、附件及选件 (1)1.2仪器介绍 (3)1.2.1 前面板 (3)1.2.2 后面板 (4)1.3DH5611A-8同步时钟盒的介绍 (5)1.3.1前面板 (5)1.3.2后面板 (5)第二章系统要求 (7)2.1电源要求 (7)2.2环境要求 (7)2.3计算机系统要求 (8)2.3.1 硬件配置要求 (8)2.3.2 系统要求 (8)第三章安装与调试 (9)3.1连接信号线 (9)3.2DH5611A-8同步时钟盒的连接 (11)3.2.1单个同步时钟盒的连接 (11)3.2.2多个同步时钟盒的连接 (12)3.3DH5922N的连接 (12)3.3.1 单台仪器连接 (12)3.3.2 多台仪器连接 (13)3.3.3 电源线的连接 (13)3.4开机顺序 (14)3.5安装USB3.0驱动 (14)3.6软件安装与卸载 (15)3.6.1 安装 (15)3.6.2 卸载 (17)3.7W INDOWS7防火墙设置 (18)第四章传感器连接及测量内容设定 (26)4.1传感器连接方法 (26)4.2常见灵敏度的表示方法 (29)第五章过程测量 (26)5.1接口设置和参数管理 (26)5.2设置存储规则 (27)5.3设置测量通道 (28)5.3.1测量通道总体描述 (28)5.3.2电压/IEPE测量 (30)5.3.3应变应力/桥式传感器 (30)5.3.4电荷测量 (31)5.3.5铂电阻测温 (32)5.3.6电流测试 (32)5.3.7传感器信息 (33)5.3.8信号源通道 (33)5.3.9转速测量通道 (34)5.4实时测量 (35)5.5数据显示 (35)第六章数据处理和分析 (37)6.1显示统计信息 (37)6.2设置分析通道 (37)6.3数据回放 (38)6.4报告输出 (39)第七章常见故障及解决办法 (42)7.1仪器类故障 (42)7.2适调器类故障 (42)7.3传感器类故障 (42)7.4附件类和外部原因引起的故障 (43)第八章注意事项 (44)附录 (45)附录一DH5922N技术指标 (45)附录二调理器技术指标(选件) (47)附录三桥路的连接 (50)附录四W IN8系统下USB3.0驱动安装前系统设置 (52)附录五DH5922N引脚定义 (55)附录六版本说明 (56)第一章 入门指南1.1 认识产品、附件及选件产品图片名称型号描述DH5922N 动态信号测试分析系统(16通道) 通用型动态信号测试分析系统,应用范围广,可完成应力应变、振动(加速度、速度、位移)、冲击、声学、温度、压力等各种物理量的测试和分析。
动态力学分析仪使用方法说明书一、前言动态力学分析仪是一种用于测试物体在受力作用下的动态响应的仪器。
本使用方法说明书旨在介绍动态力学分析仪的正确使用方法,以帮助用户有效地进行实验和分析。
二、仪器概述动态力学分析仪由以下几个主要部分组成:1. 控制系统:负责对实验参数进行设置、数据采集和信号处理。
2. 传感器系统:用于采集被测物体在受力作用下的位移、速度和加速度数据。
3. 信号处理单元:用于对传感器采集到的数据进行滤波、运算和分析。
4. 显示和输出系统:将分析后的结果以图表或文字的形式进行显示和输出。
三、准备工作在使用动态力学分析仪之前,需要完成以下准备工作:1. 确保动态力学分析仪已经正确连接至电源,并处于工作状态。
2. 确保传感器已经正确连接至被测物体,并调整到合适的位置。
3. 在控制系统中设置实验参数,包括采样频率、采样点数等。
四、实验步骤1. 启动动态力学分析仪控制系统,并进入实验界面。
2. 设置实验参数,如采样频率、采样时长等。
根据需要,可以选择不同的采样参数进行多组实验。
3. 在控制系统中选择相应的实验模式,如冲击响应、连续振动等。
4. 点击“开始实验”按钮,仪器将开始采集数据。
5. 在实验过程中,观察被测物体的动态响应情况,并确保传感器采集到的数据稳定和准确。
6. 实验结束后,停止数据采集,并保存实验数据。
7. 利用信号处理单元对采集到的数据进行滤波、运算和分析,获取相应的动态力学参数。
8. 根据实验结果进行分析和讨论,得出相应的结论。
五、注意事项1. 在使用动态力学分析仪进行实验时,应严格按照操作步骤进行,确保实验的准确性和可靠性。
2. 在连接传感器时,需保证传感器与被测物体之间的连接牢固可靠,并避免产生额外的振动干扰。
3. 在进行实验过程中,应注意实验环境的稳定性,避免外界干扰对实验结果产生影响。
4. 实验结束后,应及时清理和维护动态力学分析仪,确保其正常工作和延长使用寿命。
六、故障排除在使用过程中,可能会遇到一些故障或问题,以下为常见问题及解决方法:1. 无法启动:检查电源连接是否正常,是否有电流输出,确保控制系统处于正常工作状态。
网络分析仪组成框图图1所示为网络分析仪内部组成框图。
为完成被测件传输/反射特性测试,网络分析仪包含;1.激励信号源;提供被测件激励输入信号2.信号分离装置,含功分器和定向耦合器件,分别提取被测试件输入和反射信号。
3.接收机;对被测件的反射,传输,输入信号进行测试。
4.处理显示单元; 对测试结果进行处理和显示。
图1 网络分析仪组成框图传输特性是被测件输出与输入激励的相对比值,网络分析仪要完成该项测试,需分别得到被测件输入激励信号和输出信号信息。
网络分析仪内部信号源负责产生满足测试频率和功率要求的激励信号,信号源输出通过功分器均分为两路信号,一路直接进入R接收机,另一路通过开关输入到被测件相应测试口,所以,R 接收机测试得到被测输入信号信息。
被测件输出信号进入网络分析仪B接收机,所以,B接收机测试得到被测件输出信号信息。
B/R为被测试件正向传输特性。
当完成反向测试测试时,需要网络分析仪内部开关控制信号流程。
图2 网络分析仪传输测试信号流程反射特性是被测件反射与输入激励的相对比值,网络分析仪要完成该项测试,需分别得到被测件输入激励信号和测试端口反射信号。
网络分析仪内部信号源负责产生满足测试频率和功率要求的激励信号,信号源输出通过功分器均分为两路信号,一路直接进入R接收机,另一路通过开关输入到被测件相应测试口,所以,R 接收机测试得到被测输入信号信息。
激励信号输入到被测件后会发射反射,被测件端口反射信号与输入激励信号在相同物理路径上传播,定向耦合器负责把同个物理路径上相反方向传播的信号进行分离,提取反射信号信息,进入A接收机。
A/R 为被测试件端口反射特性。
当需要测试另外端口反射特性时,需网络分析仪内部开关将激励信号转换到相应测试端口。
图3 网络分析仪反射测试信号流程信号源信号源提供被测件激励信号,由于网络分析仪要测试被测件传输/反射特性与工作频率和功率的关系。
所以,网络分析仪内信号源需具备频率扫描和功率扫描功能。
信号分析仪原理
信号分析仪是一种用于分析电信号频谱和特性的仪器。
它通过将输入信号转换为频谱图并显示在屏幕上,帮助工程师或研究人员深入了解信号的频谱分布、频率成分、幅度、相位和其他属性。
信号分析仪的工作原理基于频谱分析技术。
频谱表示信号在各个频率上的能量分布情况。
信号分析仪首先将输入信号进行采样,并将其转换为数字信号。
然后,数字信号经过数学运算,如傅里叶变换,将信号从时域转换到频域。
这些运算能够将信号分解为不同频率的成分。
在转换到频域后,信号分析仪将频谱图显示在屏幕上。
频谱图通常由横轴表示频率,纵轴表示幅度或功率,显示信号在不同频率上的能量分布情况。
工程师或研究人员可以通过观察频谱图来分析信号的频谱特性,如频率成分、频谱形状、幅度变化等。
信号分析仪还具有其他功能,如频谱平坦度测试、频谱演示、时域波形显示等。
频谱平坦度测试用于评估信号在不同频率上的幅度平坦度,对于一些通信系统或音频设备的性能评估十分重要。
频谱演示功能可以将频谱图按照一定节奏或周期进行动态展示,有助于观察信号的周期性变化。
时域波形显示功能可以显示信号的时域波形,对于观察信号的时域特性也十分有用。
总之,信号分析仪通过频谱分析技术将信号从时域转换到频域,并显示在屏幕上,帮助工程师或研究人员深入了解信号的频谱
特性。
它是电子测试和研究领域中常用的仪器之一,广泛应用于通信、无线电、音频、音视频等领域。
DH5922动态信号测试分析系统
1.测试范围广泛:DH5922系统可以对各种动态信号进行测试,包括直流信号、交流信号以及各种复杂的脉冲信号等。
2.高精度测量:该系统具有高精度的测量功能,能够准确地测量信号的幅值、频率、相位等参数。
它使用先进的测量技术和精密的传感器,能够实现非常高的测量精度。
3.多种测试模式:DH5922系统支持多种测试模式,包括静态测试、动态测试和周期测试等。
用户可以根据需要选择适合的测试模式,以获得最准确的测试结果。
4.快速响应:该系统具有快速响应的特点,能够实时采集和处理信号数据。
它采用高速采样技术和强大的信号处理算法,能够在很短的时间内完成信号的采集和分析。
5.数据显示和记录:DH5922系统具有直观的数据显示界面,能够清晰地显示信号的波形、频谱和幅频特性等信息。
同时,它还支持数据记录功能,可以将测试结果保存到存储设备中,以便后续分析和处理。
6.灵活性和可扩展性:该系统具有良好的灵活性和可扩展性,可以根据用户的需求进行定制和扩展。
用户可以根据实际情况选择适合自己的测量配置,满足不同测试要求。
7.便捷的操作和维护:DH5922系统采用友好的操作界面和简单的操作流程,使用户能够快速上手并熟练操作。
同时,该系统还具有良好的可维护性,方便进行系统的维护和升级。
总结起来,DH5922动态信号测试分析系统是一种功能强大、精确可
靠的仪器设备。
它能够帮助用户对各种动态信号进行准确的测试和分析,
为用户解决各种动态信号测试问题提供了有效的解决方案。
无论是在科研、生产还是教学领域,DH5922系统都具有广泛的应用前景。
在现代测试技术中动态信号分析仪是重要的测试设备,既可用于系统动态特性的测量也可用于稳态分析,还可用于强度试验以及频谱分析。
动态信号分析仪的应用有动态数据采集、机械振动分析、振动控制系统分析、声学分析、结构分析等领域。
目前各国生产的动态信号分析仪型号规格很多性能也各异,如美国晶钻仪器公司的CoCo-80X和CoCo-90X动态信号分析仪,它是一款手持式仪器,同时具有数据动态数据记录功能,它有4/8/16输入通道,最高采样率102.4KHz,最高150dB的动态范围,数字滤波器有效防止削波等,自带电池与内存,特别适合野外实时数据采集与分析,在桥架结构监测、大型机械状态监测、高校振动试验、汽车NVH模态分析、航空航天高铁隧道监测、环境噪声监测、声学分析等,功能有频谱分析及相关函数、结构模态分析、动平衡、路径采集点检、旋转机械阶次跟踪、倍频程和声级计、全身振动、阈值检测、冲击响应谱和正弦扫频、包络分析、数据采集等。
★动态信号分析仪原理
动态信号分析仪一般由如下几个部分组成:
1.防混叠低通滤波器。
2.模拟到数字转换器ADC。
3.数字信号处理器:数字变频,数字滤波,数字信号处理(如FFT等频率分析函数)等。
4.控制和显示。
杭州锐达数字技术有限公司是美国晶钻仪器公司中国总代理,负责产品销售、技术支持与产品维护,是机械状态监测、振动噪声测试、动态信号分析、动态数据采集、应力应变测试等领域的供应商,提供手持一体化动态信号分析系统、多通道动态数据采集系统、振动控制系统、多轴振动控制系统、三综合试验系统和远程状态监测系统等。
更多详情请拨打联系电话或登录杭州锐达数字技术有限公司咨询。