MicrosoftDynamicsAX试用版实操
- 格式:doc
- 大小:33.00 KB
- 文档页数:2

Microsoft Dynamics® AXTracing Dynamics AX 2009 Role Center KPI’sSummary: This document explains how to trace the data displayed in a Role Center page KPI to its source in the Microsoft Dynamics AX online transaction processing (OLTP) database.Author:Catherine McDade, Support Escalation EngineerDate Published: January, 2010Table of ContentsIntroduction (3)Terminology (4)KPI walkthrough (9)Description of KPI example (9)Step-by-step (9)Appendix A: Useful links (31)IntroductionThe prominent place of key performance indicators (KPIs) in Microsoft Dynamics AX 2009 Role Center pages has prompted questions about where the KPI data is drawn from. This document explains how to trace the data displayed in a KPI to its source in the Microsoft Dynamics AX online transaction processing (OLTP) database.Microsoft Dynamics AX relies on SQL Server Analysis Services (SSAS) for its business intelligence processing. In the following sections, we define terms of importance for SSAS, and then provide an example of how to trace the data for a KPI on a Role Center page.TerminologyKey Performance Indicator (KPI)A Key Performance Indicator is a measurement for gauging business success, or, in other words, ameasure of business metrics against targets. For example, a Sales Amount KPI could show sales from the last quarter and display a green icon if you are at budget, yellow if you are within 5% of budget, and red if you are under 5% of budget.Online Analytical Processing (OLAP)OLAP systems (such as that supported by SSAS) aggregate and store data at various levels across various categories.FactsFacts are predominantly numeric measurements, such as price or quantity, and represent the key business metrics that you want to aggregate and analyze. Facts form the basis of calculations, and you often aggregate them for members of a dimension.DimensionsDimensions form the contexts for the facts, and define the aspects of a business by which the facts are aggregated. For example, Items could be a dimension, while Price and Quantity could be facts of that dimension.Data sourceA data source stores the connection information for an SSAS project and/or database. WithMicrosoft Dynamics AX, the project or OLAP database that you create has a data source that points to your Microsoft Dynamics AX OLTP database.Data source viewA data source view contains the logical model of the schema used by an SSAS database object.Data source views can filter, apply calculations, and create joins on objects in the data source. In the OLAP database that Microsoft Dynamics AX creates, most of the data source views are simply views of a specific table, though some views may include a SQL statement that contains filters, calculations, or joins.MeasuresA measure represents a column that contains quantifiable data, usually numeric, that can beaggregated. A measure is generally mapped to a column in a fact table. An example of a measure would be Sales Amount or Cost of Goods Sold (COGS).CubeCubes store summarized fact and dimension data in structures that are multidimensional (that is, containing more than the two dimensions found in spreadsheets and normal database tables).Dimensions define the structure of the cube, and measures provide the numeric values of interest to an end user.Microsoft Dynamics AX 2009 ships with the following 10 default cubes:∙Accounts Receivable∙Human Resources Management∙General Ledger∙Production∙Project Accounting∙Purchase∙Sales∙Customer Relationship Management∙Expense Management∙Accounts payableMultidimensional Expressions (MDX)MDX is a query language, analogous to Structured Query Language (SQL), that is used to retrieve multidimensional data from a cube.Business Intelligence Development Studio (BIDS)An integrated development environment (IDE) based on Microsoft Visual Studio 2005 or 2008 and used to create and modify business intelligence solutions. This is the tool that you use to view and/or modify your Dynamics AX OLAP project or database.ProjectIn BIDS, a project is a collection of objects that make up your OLAP database. BIDS stores the objects (cubes, dimensions, etc) as files in the file system. It is recommended that you create a project for your OLAP database so that when you are making changes you are not affecting the database until you deploy.Below is a screen shot of BIDS opened to a project, followed by two screen shots that label the various sections of the BIDS environment.Detail view of BIDS, left side:Detail view of BIDS, right side:KPI walkthroughDescription of KPI exampleThis section walks you through an example of how to determine the origin of KPI values. We will use screen shots as needed to illustrate procedures.Scenario: Your CEO views her Role Center and wants to know where the numbers for the Production Cost KPI are coming from.Step-by-step1.In the Microsoft Dynamics AX client, go to the User profiles form (Administration >Setup > User profiles). On the form find and select CEO in the Profile ID column andthen click the View Role Center button.2. For the Production KPIs click the Manage KPIs link.3. Click the edit button on Production cost (the pencil icon). It will tell you that this ispulling from the Production Cube and the Production Cost KPI.4. To look at the KPI open SQL Server Business Intelligence Development Studio (BIDS). Ifyou are running SQL Server 2005, BIDS can be found at Start > All Programs >Microsoft SQL Server 2005 > SQL Server Business Intelligence DevelopmentStudio. If you are running SQL Server 2008, BIDS can be found at Start > All Programs > Microsoft SQL Server 2008 > SQL Server Business Intelligence Development Studio.5. Open your OLAP database (File > Open > Analysis Services Database).6. On the Connect To Database form, select Connect to existing database. Enter thename of the SQL Server Analysis Services Server in the Server field. In the Database field, enter Dynamics AX.Note: By default your OLAP database is named Dynamics AX. If you have applied adifferent name, use that name for Dynamics AX in the step above.7. Open the Production cube in the Solution Explorer section of BIDS. Find ProductionCube, right-click, and select Open.8. Click the KPIs tab.9. In the KPI Organizer, click the Production Cost KPI to open its setup form.10. The Value Expression section tells you what data the KPI is displaying.For this KPI we see that it displays the following:[Measures].[Actual vs. Planned Consumption]“M easures” could be a calculated measure or a measure on the cube structure. It istypically a calculated measure, so click the Calculations tab for the Production cube. 11. On the Calculations tab, find the Script Organizer and click the Actual vs. PlannedConsumption calculation.12.You will see in the Expression section it is doing the following:IF(ISEMPTY([Measures].[Cost of Planned Consumption]) OR [Measures].[Cost of Planned Consumption] = 0,NULL,([Measures].[Cost of Actual Consumption] / [Measures].[Cost of PlannedConsumption]) * 100)13. If we break the above statement down we see that the first part is:[Measures].[Cost of Planned Consumption] OR [Measures].[Cost of Planned Consumption] = 0, NULLWhat this tells us is that if these values return zero we will report null, otherwise we will do the calculation on the next line. First we need to find out if the above statement would return a zero, as shown in the following steps.14.Begin with the first part of the MDX query, [Measures].[Cost of PlannedConsumption]. On the Calculations tab you should see that Cost of PlannedConsumption breaks down to the following:[Measures].[Planned Cost Amount] + [Measures].[Planned Cost Markup]15. The Planned Cost Amount is another calculated measure that does the following:([Measures].[Cost amount], [Production Level].[Level].&[1])16.Cost amount is not a calculated measure, so we go back to the Cube Structure tab andin the Measures pane find CostCalcuation > Cost amount.17. Right-click Cost amount and select Properties.18. Expand Source, then expand Source again. The TableID is PRODCALCTRANS and theColumnID is COSTAMOUNT.19. To verify where the data is pulled from, go to the Solution Explorer and right-clickDynamics AX under Data Source Views. Select Open.20. On the Dynamics AX data source view tab, find PRODCALCTRANS under Tables.21. Right-click PRODCALCTRANS and select Edit Named Query.22.If you didn’t have an Edit Named Query option, it would mean the data was being pulledthe PRODCALCTRANS table using the following select statement:select costamount from prodcalctransHowever, since this is a named query, we need to find where the COSTAMOUNT column is coming from. To do this, look through the column labeled Column, find COSTAMOUNT, and then look at the Table column to see the source table.23.We see that the COSTAMOUNT column is pulling data from the PRODCALCTRANS table.The SQL statement would be:select costamount from prodcalctrans24.Now we need to trace the second part of the calculated measure, which is [ProductionLevel].[Level].&[1]. Find Production level in the Hierarchies tab underDimensions. Expand Production level and then click Edit Production Level.25.The Production Level hierarchy should appear under Production Level. Right click Leveland select Properties.26.In the Properties window, expand NameColumn and then expand Source. The sourceTableID is PRODCALCTRANS_LEVEL and the ColumnID is COLLECTREFLEVEL.27.We now know the data source that OLAP is using, but we want to find out where data isbeing pulled from in the Microsoft Dynamics AX OLTP database. To do this we can open the Dynamics AX option under Data Source Views in Solution Explorer.28.Scroll to PRODCALCTRANS_LEVEL, right-click, and select Edit Named Query29.The SQL statement for this data source is:SELECT DISTINCT COLLECTREFLEVEL FROM PRODCALCTRANS30.We now have enough information to build a SQL statement that would reflect the OLAPquery we saw in step 24 ([Production Level].[Level].&[1]). Adding the level of “1”from the end of the statement yields the SQL statement:select * from prodcalctrans where collectreflevel=1bining SQL statements yields:select sum (costamount) from prodcalctrans where collectreflevel=132.Now return to the second part of the MDX query [Measures].[Planned Cost Markup]from step 14.On the Calculations tab, find Planned Cost Markup. We see that this calculated measure is defined by([Measures].[Cost Markup], [Production Level].[Level].&[1])33.On the Cube Structure tab, navigate to CostCalcuation and then to Cost Markup.34.Right-click and select Properties for Cost Markup.35.In the Properties window, expand Source and then Source again. The displayedTableID is PRODCALCTRANS and the ColumnID is COSTMARKUP.36.Return to the Data Source View and look at PRODCALCTRANS and the Cost Markupcolumn (as in steps 20 through 23). The SQL statement turns out to be:select costmarkup from prodcalctrans37.We already found the SQL for production level.level &1 in steps 24-30. Combiningthat with COSTMARKUP yields:select sum (costmarkup) from prodcalctrans where collectreflevel=138.Now you can take the sum of COSTAMOUNT and COSTMARKUP (using the results fromsteps 31 and 37) where collectionreflevel=1. If that value is zero, then the KPI is null.39.If the value is not zero, then we continue tracing the KPI using the second part of thestatement from step 12:[Measures].[Cost of Actual Consumption] / [Measures].[Cost of Planned Consumption]) * 10040.The Cost of Actual Consumption is a calculated measure that has the followingexpression:[Measures].[Realized Cost Amount] + [Measures].[Realized Cost Adjustment]41.In the first part of the statement, the Realized Cost Amount measure is:([Measures].[Actual cost amount], [Production Level].[Level].&[1])42.Now look up the Actual cost amount measure. To find this measure, go back to theCube Structure tab and find Actual cost amount under CostCalculation.43.If we look at the properties of Actual cost amount we find that the source TableID isPRODCALCTRANS and the ColumnID is REALCOSTAMOUNT.44.This gives us a SQL statement of:select realcostamount from prodcalctransIf we add the production level of 1 (which we already found in steps 24 to 30) the SQL statement for all of step 41 is:select sum (realcostamount) from prodcalctrans where collectreflevel=145.Go back to step 40 and look at the second part of the statement[Measures].[Realized Cost Adjustment]Realized Cost Adjustment is a calculated measure equivalent to:([Measures].[RealCostAdjustment], [Production Level].[Level].&[1])46.The source of RealCostAdjustment can be found by going back to the Cube Structuretab and finding RealCostAdjustment under CostCalculation.47.If we look at the properties of RealCostAdjustment, we find that the source TableID isPRODCALCTRANS and the ColumnID is REALCOSTADJUSTMENT. Adding the production level of 1, we would see a SQL statement such as:select sum(realcostadjustment) from prodcalctrans where collectreflevel=148.To derive Cost of Actual Consumption, we would add the results of steps 44 and 47.49.Next we trace the second part of the statement from step 39:[Measures].[Cost of Planned Consumption]This results in the expression:[Measures].[Planned Cost Amount] + [Measures].[Planned Cost Markup]50.[Measures].[Planned Cost Amount] is a calculated measure equivalent to:([Measures].[Cost amount], [Production Level].[Level].&[1])51.To find [Measures].[Cost amount], go back to the Cube Structure tab and find Costamount under CostCalculation.52.If we look at the properties of Cost amount, we find that the source TableID isPRODCALCTRANS and the ColumnID is COSTAMOUNT. Adding the production level of 1, we would see the SQL statement:select sum (costamount) from prodcalctrans where collectreflevel=153.Return to step 49 for the next part of the statement:[Measures].[Planned Cost Markup]This is a calculated measure equivalent to the expression:([Measures].[Cost Markup], [Production Level].[Level].&[1])54.To trace this measure, go back to the Cube Structure tab and find Cost Markup underCostCalculation.31 TRACING DYNAMICS AX 2009 ROLE CENTER KPI ’S55. If we look at the properties of Cost Markup , we find that the source TableID isPRODCALCTRANS and the ColumnID is COSTMARKUP. Adding the production level of 1,we see the SQL statement:select sum (costmarkup) from prodcalctrans where collectreflevel=156. The results for [Measures].[Cost of Planned Consumption] would be the sum of steps 52and 55.57. Therefore, the results for [Measures].[Cost of Actual Consumption] / [Measures].[Cost ofPlanned Consumption]) * 100 This means we have to divide the results from step 48 bythe results of step 56. Then we take that number and multiply it by 100 to get our actualvs. planned consumption which is what gives us the Production Cost KPI.After following these steps you should now know where the data that makes up the Production Cost figure on the KPI is coming from. You should also have learned how to trace a KPI so that you can determine where any KPI is pulling data from.Appendix A: Useful links∙ Microsoft Dynamics AX 2009 Business Intelligence Cube Reference Guide: /downloads/details.aspx?FamilyId=6A685DF3-912D-4545-B990-CD2283C159FB&displaylang=en∙ Role Center reference for Microsoft Dynamics AX: https:///dynamics/ax/using/ax_rolecenterreference.mspxReferences:∙The information above was taken from SQL Server books online. For more information on SSAS please go to /en-us/library/ms130214.aspx32 TRACING DYNAMICS AX 2009 ROLE CENTER KPI ’SThis document is provided “a s-is.” Information and views expressed in this document, including URL and other Internet Web site references, may change without notice. You bear the risk of using it.Some examples depicted herein are provided for illustration only and are fictitious. No real association or connection is intended or should be inferred.This document does not provide you with any legal rights to any intellectual property in any Microsoft product. You may copy and use this document for your internal, reference purposes. You may modify this document for your internal, reference purposes. © 2009 Microsoft Corporation. All rights reserved.Microsoft Dynamics is a line of integrated, adaptable business management solutions that enables you and your people to make business decisions with greater confidence. Microsoft Dynamics works like and with familiar Microsoft software, automating and streamlining financial, customer relationship and supply chain processes in a way that helps you drive business success.U.S. and Canada Toll Free 1-888-477-7989Worldwide +1-701-281-6500/dynamics。

MicrosoftDynamicsCRM操作与维护指导书Microsoft Dynamics CRM 4.0操作与保护指南中文 4.0.0 修订版本文档中的信息(包含引用的 URL 与其他 Internet 网站)如有更换,恕不另行通知。
除非另行说明,否则本文示例中描述的公司、组织、产品、域名、电子邮件地址、徽标、人物、地点与事件纯属虚构。
无意与任何真实的公司、组织、产品、域名、电子邮件地址、徽标、人物、地点或者事件发生任何关联,也不应有此方面的推断。
用户有责任遵守一切适用的版权法。
未经Microsoft Corporation 书面明确许可,不得出于任何目的、以任何形式或者通过任何手段(电子、机械、影印、录制或者其他手段)复制本文档的任何内容、将其存入或者引入检索系统或者者进行传播;但此规定并不限制版权所给予的各项权利。
Microsoft 可能拥有涉及本文档主题的专利、专利申请、商标、版权或者其他知识产权。
除非Microsoft 提供的书面许可协议中有明文规定,否则提供本文档并不表示给予您使用这些专利、商标、版权或者其他知识产权的许可。
© 2007 Microsoft Corporation。
保留所有权利。
您复制本文档的权利受版权法/著作权法与软件许可协议条款的限制。
关于软件许可证,您能够制作合理数量的副本或者打印版本供自己使用。
未经授权擅自制作副本、改编、汇编或者进行衍生性工作用于商业发行都是法律禁止的行为,违者将受到惩处。
Microsoft、MS-DOS、Windows、Windows Server、Windows Vista、Microsoft Dynamics、Active Directory、BizTalk 与 Outlook 是 Microsoft 旗下各公司的商标。
所有其他商标均归其各自所有者所有。
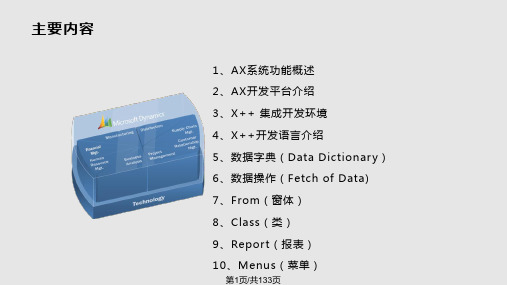
目录1概述欢迎使用《Microsoft Dynamics CRM 4.0 操作与保护指南》,本指南是《Microsoft Dynamics CRM 4.0 实施指南》综合文档集的一部分。
Microsoft Dynamics™ 培训材料本内容的使用将受到当前服务协议的约束。
第223页第 9 章:安装 Microsoft Dynamics AX 4.0目标这一章目标包括:•了解 Microsoft Dynamics™ AX 4.0 安装的核心组件•执行 Microsoft Dynamics AX 4.0 的单机安装•完成安装核对清单•重新启动 Microsoft Dynamics AX 4.0 并验证示例数据简介本节首先概述 Microsoft Dynamics AX 4.0 安装的核心组件。
要安装的核心组件包括:•应用程序对象服务器 (AOS)•程序文件服务器•数据库•客户端然后,完成测试/演示环境的单机安装。
安装 Microsoft Dynamics AX 4.0 之后,将完成安装核对清单中的功能。
其中包括:•编译应用程序•输入许可证信息•配置系统•调整全局类型•同步表/索引•设置公司帐户•导入示例数据此单机安装过程的最后一步是重新启动 Microsoft Dynamics AX 4.0 客户端,并验证演示公司中存在示例数据。
Microsoft Dynamics™ 培训材料本内容的使用将受到当前服务协议的约束。
第 224 页 方案Global Trade and Manufacturing Company 的专职销售代表需要已安装在计算机上的演示版本的 Microsoft Dynamics AX 4.0。
该销售代表得到建议,应使用“单台计算机安装”选项,然后完成安装核对清单。
最后一项任务是重新启动 Microsoft Dynamics AX 4.0 客户端,并验证示例数据导入,以便开始向潜在客户展示 Microsoft Dynamics AX 4.0 功能。
核心系统安装概述核心 Microsoft Dynamics AX 4.0 系统包括:• 应用程序对象服务器 (AOS) 实例• 程序文件服务器• 数据库• 至少一个客户端这些组件可以安装在各种拓扑结构中的计算机上,但上述元素缺一不可,否则系统将无法运行。
《深度挖掘:Dynamics AX 2012操作手册》一、引言Dynamics AX 2012是一款功能强大的企业资源规划(ERP)软件,被广泛应用于各种规模的企业中。
作为企业管理者或IT从业者,熟练掌握Dynamics AX 2012的操作技巧对于提高工作效率、优化企业管理流程具有重要意义。
在本文中,我们将深度挖掘Dynamics AX 2012的操作手册,为您带来全面而深入的学习体验。
二、初识Dynamics AX 20121. 系统概述Dynamics AX 2012是由微软(Microsoft)开发的一套集成管理软件系统,旨在实现企业资源的综合管理和效率优化。
它包括了财务、采购、生产、销售、仓储等多个功能模块,为企业提供了一站式的解决方案。
2. 操作界面Dynamics AX 2012的操作界面简洁直观,主要分为主菜单、导航栏、工作区域和详细信息四大部分。
用户可以通过简单的点击和拖放操作来实现复杂的业务流程。
3. 操作手册Dynamics AX 2012的操作手册是用户学习的重要工具,它详细介绍了系统的功能和操作步骤,对用户的学习和使用起到了重要的辅助作用。
三、深度挖掘Dynamics AX 2012操作手册1. 功能模块Dynamics AX 2012的操作手册详细介绍了各个功能模块的操作方法和使用技巧。
在财务模块中,可以学习到如何设置会计科目、录入凭证、生成报表等操作;在采购模块中,可以学习到如何创建采购订单、进行验收入库、付款等操作。
2. 操作技巧操作手册不仅介绍了系统的基本操作,还深入探讨了一些高级的操作技巧。
在生产模块中,可以学习到如何进行生产订单的排程和跟踪、如何进行生产成本的核算和分析等高级技术。
3. 定制化开发Dynamics AX 2012的操作手册还介绍了系统的定制化开发方法。
通过学习操作手册,用户可以掌握系统表单的设计方法、报表的设计方法、工作流的配置方法等,从而实现系统与企业实际业务的无缝对接。
《MicrosoftDynamicsAX试用版》实操
--ERP实训报告
一、实训时间:
二、实训地点:
三、实习内容
由于公司明白到ERP项目实施的困难,慎重地实施ERP。
如是成立了ERP实施筹备小组,对实施ERP进行演示。
筹备小组由公司资讯部牵头,成员有各个相关部门的精英。
采用了MicrosoftDynamicsAX 试用版作为模拟平台,模拟运行ERP。
ERP实施筹备小组的任务是:梳理公司的业务流程,考察ERP软件的适用性,普及ERP知识,培训实施ERP人才。
刚开始运用MicrosoftDynamicsAX时,觉得非常复杂,众多的菜
单搞得分不清思路,它的操作有一定的流程和规律。
几天实践,摸索了一点思路和积累了一点经验。
这也靠于自已的认真思考和老师耐心指点。
MicrosoftDynamicsAX的操作开始是比较困难,摸索到门路后就不觉得难了。
难的是如何应用于实际。
我试用了一下人力资源模块、应收帐款模块、应付帐款模块。
我在人力资源部、销售部门实习了解到的业务流程这时候就派上了用场。
ERP实施筹备小组成员虽然有工作分工,每人负责试用几个模块,但大家经常一起讨论问题,交换看法。
在实习过程中,看见许多同学非常认真,完全带入角色,同事也带动了我的积极性, 给我一种特别想融入他们其中的感觉。
这将对我以后的人生路上一种很大的推进和很大的影响。
面对激烈的社会就业竞争,只有坚持学习新的知识,才会使自己更加充实自己,完善自己,而ERP中心就有这样的气氛,而且ERP更有人性化在里面。
同时这次实习也为我提供了与众不同的学习方法和学习机会,让我从传统的被动授学转变为主动求学;从死记硬背的模式中脱离出来,转变为在实践中学习,增强了领悟,创新和推断的能力.掌握自学的方法,这些方法的提高是终身受益的,我认为这难得的一个月让我真正懂得了工作和学习的基本规律。
三、ERP应用遇到问题
伴随着我国加入WTO 以及企业信息化的飞速进展,ERP 在中国也进入了广泛普及阶段,越来越多的人知道了什么是ERP,应用更加务实、业务范围更加广泛。
涉及的业务深度逐渐加强的ERP 正为广大的中国企业所期盼。
目前国内的ERP应用并不尽如人意,就整体而言,我国在应用E
RP上呈现出不平衡的发展趋势。
各个企业差距较大,能够真正成功地全面实施ERP管理系统的企业并不是很多。
其原因在于:一、ERP 业界对广大中国企业缺乏深入的理解,同时ERP成熟标准在我国缺乏深入实践,从而导致企业ERP选型错乱,实施风险失控。
二、一些软件厂商夸大吹嘘自己的产品,使得ERP市场非常混乱,更直接导致了客户对ERP产品的怀疑。
(一)企业纵向管理的不成熟将严重影响ERP 的运用
ERP的运用为企业提高管理水平提供了更为广阔的空间。
ERP应用具有范围扩展性,并逐渐形成针对行业的解决方案,来满足不同行业业务的特殊需求。
而这一切成为现实的前提是,管理视角和管理高度的全面集成。
尤其是,ERP 中财务系统应能实时收到来自所有业务过程、分析系统和交叉功能子系统的触发信息,并执行监控功能,敏捷做出快速决策。
只有这样,才能使ERP能更加综合的为企业运行进行支持和诊断。
而我国企业目前在销售、采购、生产、财务等各环节严重脱节,是很常见的现象,尤其是成长较快的企业,脱节更为严重。
如采购和生产之间的不协调经常造成停工待料;有时财务和销售环节的衔接不良,造成应收账款不能收清等现象。
造成这种情况的原因在于,企业缺乏整体考虑,尤其体现在不能集成“三流”(资金流、物流、信息流),进而造成计划与控制不能统一,各部门业务不能协调等。
这是ERP 在我国发展面临的一个考验。
(二)不先进企业管理水平将限制ERP的运用
在我国,企业管理水平长期落后于信息化要求。
很多企业存在基础数据不全,信息失真的问题。
同时,大量企业尚未建立代企业制度,企业内部对利用信息技术进行管理创新的动力不足,采用信息技术处于被动状态,普遍存在着信息管理机构不健全,信息管理制度不完善,执行力度不到位,现场管理不严格、不规范,信息设备利用率低等问题。
这些问题的存在,将严重制约ERP 在我国的运用。
四、实习的体会
四个星期的实习使我体会到大学课堂上学习到的知识只是为今
后的工作打下了一定的基础。
我们还需要在今后的工作中学习如何运用所学习到的知识,分析、解决工作中遇到的问题。
世界是在变化的,管理需要创新。
我们也需要不断地学习新知识,掌握新技能,总结工作中的经验。
只有这样,才能使我们不断提高和进步。
学习是必须的,而且不停的学习是获得成功的一个关键。
我们时刻需要学习,也时刻需要未雨绸缪,在平时要打好基础,才可能在需要的时候,能顺利上手。