LC-MS原理详细讲解PPT
- 格式:ppt
- 大小:587.50 KB
- 文档页数:60

lc-ms-ms定量检测原理
LC-MS-MS(Liquid Chromatography-Mass Spectrometry-Mass Spectrometry)是一种高效液相色谱质谱检测技术。
其定量检
测原理分为前处理、色谱分离和质谱检测三个主要步骤。
1. 前处理:样品通常需要进行前处理步骤,如样品提取、富集和纯化等,以提高目标分析物的检测限和减少干扰物的影响。
2. 色谱分离:前处理后的样品通常会通过液相色谱技术进行分离。
在液相色谱柱中,样品中的不同分析物会根据其化学性质和亲合性以不同速率流动,并在色谱柱中被分离。
3. 质谱检测:分离后的化合物由色谱柱连接至质谱仪进行检测和定量。
在质谱仪中,分子离子会通过电荷分离和加速器分离进入质谱仪中的两个质量分析器之一,如四极杆(quadrupole)或飞行时间质谱仪(time-of-flight)。
通过在质谱仪中引入特
定质荷比的离子或离子对,可以选择性地检测目标分析物。
定量的原理是基于目标分析物的浓度与其在质谱检测器中产生的离子信号强度之间的关系。
通过测量目标分析物的峰面积或峰高,通过校准曲线或内标法可以确定目标分析物的浓度。
内标法通常使用一个已知浓度的化合物作为内标,通过内标的信号对目标分析物的信号进行校正,提高定量的准确性和精度。
LC-MS-MS定量检测原理可应用于多种领域,如药物代谢研究、毒理学研究和环境分析等。
它具有高灵敏度、高选择性和
较宽的线性范围,因此被广泛应用于药物研发、临床检测和环境监测等领域。
lc-ms的原理
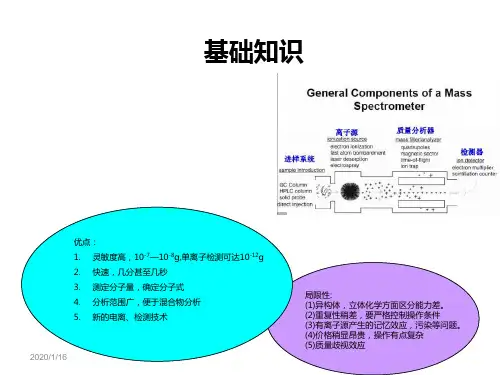
LC-MS(液相色谱-质谱联用)是一种结合了液相色谱和质谱技术的分析方法。
它的原理是将样品溶解在液相中,经过色谱柱分离,并通过质谱仪进行检测和识别。
液相色谱(LC)是一种基于分子在液相中的分配和亲和性质的分离技术。
样品溶解在移动相中,并通过固定相(色谱柱)分离成不同的组分。
这些组分通过不同的相互作用(如极性、分配系数等)在色谱柱中以不同的速率通过。
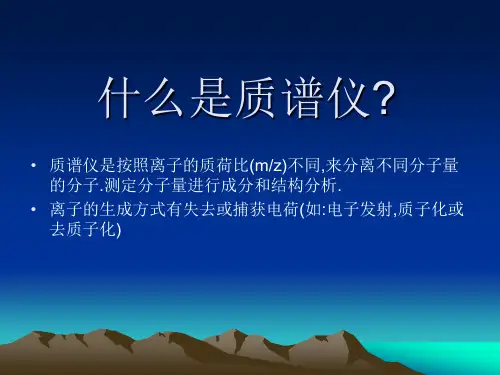
质谱(MS)则是一种基于分析样品中化合物的质荷比(mass-to-charge ratio,m/z)的技术。
在质谱仪中,样品分子通过电离过程转化为离子,然后通过加速电场、磁场和其他分子分离方法,根据其质量分离并检测。
在LC-MS联用中,液相色谱系统将分离的样品进样到质谱系统中。
质谱仪将进样的分离组分一个接一个地离子化,并对其进行分析和检测。
根据质荷比分离出的离子特征谱帮助识别化合物的组成和结构。
LC-MS联用的原理利用了液相色谱和质谱的互补性,可以很好地分析复杂的样品混合物中的化合物,并提供结构和组成信息。
它广泛应用于食品、环境、制药和生物医学等领域的化学分析和生物分析。
lc-ms原理
液相色谱质谱联用(LC-MS)是一种将液相色谱与质谱相结
合的分析技术,其原理基于两个主要的步骤:样品的分离和样品的检测与鉴定。
在LC-MS分析中,首先通过液相色谱将复杂的样品进行分离。
这一步骤基于样品组分的化学性质和物理性质,如极性、分子大小和分子结构等。
通过选择不同的分离柱和流动相组合,可以将样品中的混合物分离成不同的化合物。
分离后的化合物进入质谱仪进行检测与鉴定。
质谱仪能够将化合物的分子离子进行解离,并根据其质荷比(m/z)比值进行
分析。
质谱仪一般由离子化部分和检测部分组成,其中离子化部分可以使用不同的离子化方式,如电喷雾离子源(ESI)和
大气压化学电离源(APCI),来产生分子离子。
分子离子进
入检测器后,可以通过质荷比的比较和质量谱图的生成来鉴定和定量样品中的化合物。
LC-MS技术具有高分辨率、高灵敏度、高选择性和广泛的应
用范围等优点。
它在药物分析、环境监测、食品安全和生物医学研究等领域中发挥着重要作用。
通过优化分离条件和选择合适的质谱参数,LC-MS技术可以实现对复杂混合物的快速、
准确和可靠的分析。
SThis presentation is an introduction to LCMS. It includes optimization andSince this MS is intended for quantitative use as well as identification, it i important to be able to achieve good quantitative results. Here we show reproducibility on both UV and MS to show comparable results for a pharmaceutical type product (reserpine). Notice that the signal to noise fromEverything has mass, but there are different ways to express mass. Since massAPI is atmospheric pressure ionization and can refer to any source in use withThe two most common sources are electrosprayHere we see a comparison of the types and ranges of compounds that can bea i n iElectrospray versus APCIAPCI TIC m/z 200-800Electrospray TIC m/z 200-800N X R OH NXR43N XH RNH 2R211234Both techniques can see a wide variety of compoundsHere is the 4 compound test mix again showing similar results for both probes. Generally APCI is used for difficult to ionize species. It is typical that it will have a higher background noise level because it can ionize compounds that1 pg ReserpineESI can be very sensitive, especially tocompounds that can be ionized with a pH changeHere are two injections of 1 picogram each of reserpine. This illustrates that LCMS is very sensitive for compounds like this. At this level, a UV detector would only show a flat line without any peak discernable. ReserpineThe important thing to emphasize here is keep everything clean.Here we see a simple molecule called lysine. It is one of the ‘basic’ aminoThis shows the titration curves for pKaThe red pointer shows lysine (red peak) in a mixture of amino acids. ThisEven simple peptides can have a number of different ions with different chargepH, ionic strength, temperature and metals can alter distributionZ=2Z=3Z=4Most peptides will produce multiply charged ions. Generally the most basic amino acids such as lysine, arginine and histidine are the easiest to ionize and each will pick up a charge in positive ion mode. In addition, the N-terminus acid will generally also pick up a charge. Here we see a 16 amino acid peptide that has picked up 2, 3 and 4 charges. The distribution of charges is common in peptide analysis and the ratio of the different Z values can changedepending on pH, ionic strength, and analyte concentration. The presence of metals can also affect the charge, especially for sulfur containing peptides.SSulfur containing peptides can be lost due to reactions with metals. Inertnon-metallic systems and higher purity chemicals may be requiredHere we see Casein as a digest analyzed on an inert HPLC/MS system. Here are shown a number of peptides. Casein is an interesting protein because it contains some sulfur that will make certain peptides fairly reactive with metalsSThe arrows indicate missing peptidesHere is the same Casein digest analyzed on a traditional metallic HPLC system. The arrows point out several peptides that have disappeared from view. These are the sulfur containing peptides. The difference between this and the previous slide are dramatic if you cycle back and forth between them.Some comments in addition to what is shown on the slide:Even simple peptides can be difficult to interpret when electrosprayThese spectra illustrate the problems of adduct formation. HereSodium and potassium are ubiquitous –25e30e3These are a series of aflatoxins. They typically form sodium adducts in ESINote reduction of sodium in this example. Ammonium acetate preventsThis slide shows the benefits of a backflow drying gas on solvent adduct ion0.1ml 0.2ml 0.4ml 0.6ml 0.8ml 1.0ml 1.2ml 1.5ml 2.0mlMost people don’t try to run 100% water by ESI at 2 mL/min flow rates. MostThe sharper the peak, the better the sensitivity b ESI. Here are someAdditives may be necessary to promote ionization or for chromatography.NNNNCl C H 3This is a very common situation with the analysis of many compounds from biological sources. It doesn’t matter whether the source was urine, plasma, wood sap or hair. All living systems contain sodium and potassium.Since many compounds can create ions by protonation, many can just as easily replace the proton with sodium or potassium. Hydroxyl containing compounds are nearly always affected.The presence of sodium and potassium ADDUCTS affects quantitationEarlier we showed the recovery of reserpineThese results show that even at picogramNegative ions behave a lot differently from positive ions and you may need toSodium is everywhere. It can come in from samples, from waters,The mechanisms of ionization for APCI are different than for Electrospray.A rule of thumb: if you can smell your compound, it will probably work byHere is an example of a large compound (mass = 825) being analyzed byReserpine on column:<0.5 pg -5000 pg, r2= 0.999957Most LCMS systems are linear to three orders of magnitude. Quads can usually go to 4 or 5 orders of magnitude depending on the columnReserpine on column:<0.5 pg -5000 pg, r2= 0.999945Here is reserpine analyzed by APCI showing 4 orders of linearity. Some users have difficulty with APCI since it tends to be a noisier interface and will saturate more quickly, but here we see that the technique is certainly linear and has a high dynamic range.These rules are fairly general and apply to both quadrupoleThis may seem backwards to traditional chromatographers who pickS5. MS method development usually starts with studying the structure andLooking at a compound like this most novices will expect that itFluconazole in +/-modeHere is an APCI analysis of fluconazole. The upper trace in blue is the protonated species (+), and the red trace is the deprotonated species (-). The spectra show that the (+) species produces a M+acetonitrile adduct, while the (-) ion as little of the adduct, and mostly the m-H species at m/z305. APCI only produces singly charged ions, so there is no worry about a multiply charged species forming here either. One additional comment is that the signal intensity of the 307 (+) ion is about 10 times stronger than the 305 (-) ion, but notice that the chromatograms show similar signal to noise values! It means that both produce good quantitative results and that noise levels in negative ion mode are lower than in positive ion mode.。