2013icm优秀论文
- 格式:docx
- 大小:151.88 KB
- 文档页数:12

Identification of conspirator list based on statistics weight and matrix Summery:We use two processes to develop mathematical models to predict the suspicious people to help the ICM to make better investigation strategies. We use mathematical models to estimate the criminal weight of all people and use statistical methods and text analysis to optimize the result of the mathematical models.Our result shows that the search scope can be significantly reduced to less than 20% of the original scope by using the statistics weight and matrix. Furthermore, if we consider the fact that there are many more factors can restrict models, particularly when the amount of database is large, it’s obvious that the actual search scope is far less than 20%.We also make use of text analysis to improve the model to predict the suspicious people more accurately. When we combine the model with text analysis method, we not only have a more accurate prediction but also can get a conclusion that the larger the database is the more accurate the model is. Because with the database becoming larger, the key words database becoming larger, too. And the text analysis become more meaningful .So the ICM can make more efficient strategies to the investigation.We develop a models based on the different principles and assumptions to study if there are some statistical pattern within the distribution of the suspicious people. Though we find that it`s difficult to predict the suspicious people precisely, the mathematical method can be reliable to predict the likely people and even can reveal some critical information, such as the topic`s weight, key words. So the method can be used only when the scope of a database is abundant.We finally consider that assumptions of the models can change with certain condition. The more detailed the assumptions are ,the predictions of the suspicious people is more accurate , however, reliability still need to be tested. So the ICM need to carry deep investigation.面对隐藏于众多普通人之中的少数犯罪分子,根据已知的情报信息采用一种科学的数学模型对整个团队进行文本数据分析、犯罪嫌疑权重计算将所有人的嫌疑权重进行排序从而为进一步调查案件作参考。

For office use onlyT1________________ T2________________ T3________________ T4________________ Team Control Number52888Problem ChosenAFor office use onlyF1________________F2________________F3________________F4________________Mathematical Contest in Modeling (MCM/ICM) Summary SheetSummaryIt’s pleasant t o go home to take a bath with the evenly maintained temperature of hot water throughout the bathtub. This beautiful idea, however, can not be always realized by the constantly falling water temperature. Therefore, people should continually add hot water to keep the temperature even and as close as possible to the initial temperature without wasting too much water. This paper proposes a partial differential equation of the heat conduction of the bath water temperature, and an object programming model. Based on the Analytic Hierarchy Process (AHP) and Technique for Order Preference by Similarity to Ideal Solution (TOPSIS), this paper illustrates the best strategy the person in the bathtub can adopt to satisfy his desires. First, a spatiotemporal partial differential equation model of the heat conduction of the temperature of the bath water is built. According to the priority, an object programming model is established, which takes the deviation of temperature throughout the bathtub, the deviation of temperature with the initial condition, water consumption, and the times of switching faucet as the four objectives. To ensure the top priority objective—homogenization of temperature, the discretization method of the Partial Differential Equation model (PDE) and the analytical analysis are conducted. The simulation and analytical results all imply that the top priority strategy is: The proper motions of the person making the temperature well-distributed throughout the bathtub. Therefore, the Partial Differential Equation model (PDE) can be simplified to the ordinary differential equation model.Second, the weights for the remaining three objectives are determined based on the tolerance of temperature and the hobby of the person by applying Analytic Hierarchy Process (AHP) and Technique for Order Preference by Similarity to Ideal Solution (TOPSIS). Therefore, the evaluation model of the synthesis score of the strategy is proposed to determine the best one the person in the bathtub can adopt. For example, keeping the temperature as close as the initial condition results in the fewer number of switching faucet while attention to water consumption gives rise to the more number. Third, the paper conducts the analysis of the diverse parameters in the model to determine the best strategy, respectively, by controlling the other parameters constantly, and adjusting the parameters of the volume, shape of the bathtub and the shape, volume, temperature and the motions and other parameters of the person in turns. All results indicate that the differential model and the evaluation model developed in this paper depends upon the parameters therein. When considering the usage of a bubble bath additive, it is equal to be the obstruction between water and air. Our results show that this strategy can reduce the dropping rate of the temperatureeffectively, and require fewer number of switching.The surface area and heat transfer coefficient can be increased because of the motions of the person in the bathtub. Therefore, the deterministic model can be improved as a stochastic one. With the above evaluation model, this paper present the stochastic optimization model to determine the best strategy. Taking the disparity from the initial temperature as the suboptimum objectives, the result of the model reveals that it is very difficult to keep the temperature constant even wasting plentiful hot water in reality.Finally, the paper performs sensitivity analysis of parameters. The result shows that the shape and the volume of the tub, different hobbies of people will influence the strategies significantly. Meanwhile, combine with the conclusion of the paper, we provide a one-page non-technical explanation for users of the bathtub.Fall in love with your bathtubAbstractIt’s pleasant t o go home to take a bath with the evenly maintained temperature of hot water throughout the bathtub. This beautiful idea, however, can not be always realized by the constantly falling water temperature. Therefore, people should continually add hot water to keep the temperature even and as close as possible to the initial temperature without wasting too much water. This paper proposes a partial differential equation of the heat conduction of the bath water temperature, and an object programming model. Based on the Analytic Hierarchy Process (AHP) and Technique for Order Preference by Similarity to Ideal Solution (TOPSIS), this paper illustrates the best strategy the person in the bathtub can adopt to satisfy his desires. First, a spatiotemporal partial differential equation model of the heat conduction of the temperature of the bath water is built. According to the priority, an object programming model is established, which takes the deviation of temperature throughout the bathtub, the deviation of temperature with the initial condition, water consumption, and the times of switching faucet as the four objectives. To ensure the top priority objective—homogenization of temperature, the discretization method of the Partial Differential Equation model (PDE) and the analytical analysis are conducted. The simulation and analytical results all imply that the top priority strategy is: The proper motions of the person making the temperature well-distributed throughout the bathtub. Therefore, the Partial Differential Equation model (PDE) can be simplified to the ordinary differential equation model.Second, the weights for the remaining three objectives are determined based on the tolerance of temperature and the hobby of the person by applying Analytic Hierarchy Process (AHP) and Technique for Order Preference by Similarity to Ideal Solution (TOPSIS). Therefore, the evaluation model of the synthesis score of the strategy is proposed to determine the best one the person in the bathtub can adopt. For example, keeping the temperature as close as the initial condition results in the fewer number of switching faucet while attention to water consumption gives rise to the more number. Third, the paper conducts the analysis of the diverse parameters in the model to determine the best strategy, respectively, by controlling the other parameters constantly, and adjusting the parameters of the volume, shape of the bathtub and the shape, volume, temperature and the motions and other parameters of the person in turns. All results indicate that the differential model and the evaluation model developed in this paper depends upon the parameters therein. When considering the usage of a bubble bath additive, it is equal to be the obstruction between water and air. Our results show that this strategy can reduce the dropping rate of the temperature effectively, and require fewer number of switching.The surface area and heat transfer coefficient can be increased because of the motions of the person in the bathtub. Therefore, the deterministic model can be improved as a stochastic one. With the above evaluation model, this paper present the stochastic optimization model to determine the best strategy. Taking the disparity from the initial temperature as the suboptimum objectives, the result of the model reveals that it is very difficult to keep the temperature constant even wasting plentiful hotwater in reality.Finally, the paper performs sensitivity analysis of parameters. The result shows that the shape and the volume of the tub, different hobbies of people will influence the strategies significantly. Meanwhile, combine with the conclusion of the paper, we provide a one-page non-technical explanation for users of the bathtub.Keywords:Heat conduction equation; Partial Differential Equation model (PDE Model); Objective programming; Strategy; Analytical Hierarchy Process (AHP) Problem StatementA person fills a bathtub with hot water and settles into the bathtub to clean and relax. However, the bathtub is not a spa-style tub with a secondary hearing system, as time goes by, the temperature of water will drop. In that conditions,we need to solve several problems:(1) Develop a spatiotemporal model of the temperature of the bathtub water to determine the best strategy to keep the temperature even throughout the bathtub and as close as possible to the initial temperature without wasting too much water;(2) Determine the extent to which your strategy depends on the shape and volume of the tub, the shape/volume/temperature of the person in the bathtub, and the motions made by the person in the bathtub.(3)The influence of using b ubble to model’s results.(4)Give a one-page non-technical explanation for users that describes your strategyGeneral Assumptions1.Considering the safety factors as far as possible to save water, the upper temperature limit is set to 45 ℃;2.Considering the pleasant of taking a bath, the lower temperature limit is set to 33℃;3.The initial temperature of the bathtub is 40℃.Table 1Model Inputs and SymbolsSymbols Definition UnitT Initial temperature of the Bath water ℃℃T∞Outer circumstance temperatureT Water temperature of the bathtub at the every moment ℃t Time hx X coordinates of an arbitrary point my Y coordinates of an arbitrary point mz Z coordinates of an arbitrary point mαTotal heat transfer coefficient of the system 2()⋅/W m K1SThe surrounding-surface area of the bathtub 2m 2S The above-surface area of water2m 1H Bathtub’s thermal conductivity/W m K ⋅() D The thickness of the bathtub wallm 2H Convection coefficient of water2/W m K ⋅() a Length of the bathtubm b Width of the bathtubm h Height of the bathtubm V The volume of the bathtub water3m c Specific heat capacity of water/()J kg ⋅℃ ρ Density of water3/kg m ()v t Flooding rate of hot water3/m s r TThe temperature of hot water ℃Temperature ModelBasic ModelA spatio-temporal temperature model of the bathtub water is proposed in this paper. It is a four dimensional partial differential equation with the generation and loss of heat. Therefore the model can be described as the Thermal Equation.The three-dimension coordinate system is established on a corner of the bottom of the bathtub as the original point. The length of the tub is set as the positive direction along the x axis, the width is set as the positive direction along the y axis, while the height is set as the positive direction along the z axis, as shown in figure 1.Figure 1. The three-dimension coordinate systemTemperature variation of each point in space includes three aspects: one is the natural heat dissipation of each point in space; the second is the addition of exogenous thermal energy; and the third is the loss of thermal energy . In this way , we build the Partial Differential Equation model as follows:22212222(,,,)(,,,)()f x y z t f x y z t T T T T t x y z c Vαρ-∂∂∂∂=+++∂∂∂∂ (1) Where● t refers to time;● T is the temperature of any point in the space;● 1f is the addition of exogenous thermal energy;● 2f is the loss of thermal energy.According to the requirements of the subject, as well as the preferences of people, the article proposes these following optimization objective functions. A precedence level exists among these objectives, while keeping the temperature even throughout the bathtub must be ensured.Objective 1(.1O ): keep the temperature even throughout the bathtub;22100min (,,,)(,,,)t t V V F t T x y z t dxdydz dt t T x y z t dxdydz dt ⎡⎤⎡⎤⎛⎫=-⎢⎥ ⎪⎢⎥⎢⎥⎣⎦⎝⎭⎣⎦⎰⎰⎰⎰⎰⎰⎰⎰ (2) Objective 2(.2O ): keep the temperature as close as possible to the initial temperature;[]2200min (,,,)tV F T x y z t T dxdydz dt ⎛⎫=- ⎪⎝⎭⎰⎰⎰⎰ (3) Objective 3(.3O ): do not waste too much water;()30min tF v t dt =⋅⎰ (4) Objective 4(.4O ): fewer times of switching.4min F n = (5)Since the .1O is the most crucial, we should give priority to this objective. Therefore, the highest priority strategy is given here, which is homogenization of temperature.Strategy 0 – Homogenization of T emperatureThe following three reasons are provided to prove the importance of this strategy. Reason 1-SimulationIn this case, we use grid algorithm to make discretization of the formula (1), and simulate the distribution of water temperature.(1) Without manual intervention, the distribution of water temperature as shown infigure 2. And the variance of the temperature is 0.4962. 00.20.40.60.8100.51 1.5200.5Length WidthH e i g h t 4242.54343.54444.54545.5Distribution of temperature at the length=1Distribution of temperatureat the width=1Hot water Cool waterFigure 2. Temperature profiles in three-dimension space without manual intervention(2) Adding manual intervention, the distribution of water temperature as shown infigure 3. And the variance of the temperature is 0.005. 00.5100.51 1.5200.5 Length WidthH e i g h t 44.744.7544.844.8544.944.9545Distribution of temperatureat the length=1Distribution of temperature at the width=1Hot water Cool waterFigure 3. Temperature profiles in three-dimension space with manual interventionComparing figure 2 with figure 3, it is significant that the temperature of water will be homogeneous if we add some manual intervention. Therefore, we can assumed that222222()0T T T x y zα∂∂∂++≠∂∂∂ in formula (1). Reason 2-EstimationIf the temperature of any point in the space is different, then222222()0T T T x y zα∂∂∂++≠∂∂∂ Thus, we find two points 1111(,,,)x y z t and 2222(,,,)x y z t with:11112222(,,,)(,,,)T x y z t T x y z t ≠Therefore, the objective function 1F could be estimated as follows:[]2200200001111(,,,)(,,,)(,,,)(,,,)0t t V V t T x y z t dxdydz dt t T x y z t dxdydz dt T x y z t T x y z t ⎡⎤⎡⎤⎛⎫-⎢⎥ ⎪⎢⎥⎢⎥⎣⎦⎝⎭⎣⎦≥->⎰⎰⎰⎰⎰⎰⎰⎰ (6) The formula (6) implies that some motion should be taken to make sure that the temperature can be homogeneous quickly in general and 10F =. So we can assumed that: 222222()0T T T x y zα∂∂∂++≠∂∂∂. Reason 3-Analytical analysisIt is supposed that the temperature varies only on x axis but not on the y-z plane. Then a simplified model is proposed as follows:()()()()()()()2sin 000,0,,00,000t xx x T a T A x l t l T t T l t t T x x l π⎧=+≤≤≤⎪⎪⎪==≤⎨⎪⎪=≤≤⎪⎩ (7)Then we use two ways, Fourier transformation and Laplace transformation, in solving one-dimensional heat equation [Qiming Jin 2012]. Accordingly, we get the solution:()()2222/22,1sin a t l Al x T x t e a l πππ-=- (8) Where ()0,2x ∈, 0t >, ()01|x T f t ==(assumed as a constant), 00|t T T ==.Without general assumptions, we choose three specific value of t , and gain a picture containing distribution change of temperature in one-dimension space at different time.00.20.40.60.811.2 1.4 1.6 1.8200.511.522.533.54Length T e m p e r a t u r e time=3time=5time=8Figure 4. Distribution change of temperature in one-dimension space at different timeT able 2.V ariance of temperature at different timet3 5 8 variance0.4640 0.8821 1.3541It is noticeable in Figure 4 that temperature varies sharply in one-dimensional space. Furthermore, it seems that temperature will vary more sharply in three-dimension space. Thus it is so difficult to keep temperature throughout the bathtub that we have to take some strategies.Based on the above discussion, we simplify the four dimensional partial differential equation to an ordinary differential equation. Thus, we take the first strategy that make some motion to meet the requirement of homogenization of temperature, that is 10F =.ResultsTherefore, in order to meet the objective function, water temperature at any point in the bathtub needs to be same as far as possible. We can resort to some strategies to make the temperature of bathtub water homogenized, which is (,,)x y z ∀∈∀. That is,()(),,,T x y z t T t =Given these conditions, we improve the basic model as temperature does not change with space.112213312()()()()/()p r H S dT H S T T H S T T c v T T c V V dt D μρρ∞⎡⎤=++-+-+--⎢⎥⎣⎦(9) Where● 1μis the intensity of people’s movement ;● 3H is convection between water and people;● 3S is contact area between water and people;● p T is body surface temperature;● 1V is the volume of the bathtub;● 2V is the volume of people.Where the μ refers to the intensity of people ’s movement. It is a constant. However , it is a random variable in reality, which will be taken into consideration in the following.Model T estingWe use the oval-shaped bathtub to test our model. According to the actual situation, we give initial values as follows:0.19λ=,0.03D =,20.54H =,25T ∞=,040T =00.20.40.60.8125303540Time T e m p e r a t u r eFigure 5. Basic modelThe Figure 5 shows that the temperature decreases monotonously with time. And some signs of a slowing down in the rate of decrease are evident in the picture. Reaching about two hours, the water temperature does not change basically and be closely to the room temperature. Obviously , it is in line with the actual situation, indicating the rationality of this model.ConclusionOur model is robust under reasonable conditions, as can be seen from the testing above. In order to keep the temperature even throughout the bathtub, we should take some strategies like stirring constantly while adding hot water to the tub. Most important of all, this is the necessary premise of the following question.Strategy 1 – Fully adapted to the hot water in the tubInfluence of body surface temperatureWe select a set of parameters to simulate two kinds of situation separately.The first situation is that do not involve the factor of human1122()()/H S dT H S T T cV dt D ρ∞⎡⎤=+-⎢⎥⎣⎦(10) The second situation is that involves the factor of human112213312()()()/()p H S dT H S T T H S T T c V V dt D μρ∞⎡⎤=++-+--⎢⎥⎣⎦(11) According to the actual situation, we give specific values as follows, and draw agraph of temperature of two functions.33p T =,040T =204060801001201401601803838.53939.540TimeT e m p e r a t u r eWith body Without bodyFigure 6a. Influence of body surface temperature50010001500200025003000350025303540TimeT e m p e r a t u r eWith body Without bodyCoincident pointFigure 6b. Influence of body surface temperatureThe figure 6 shows the difference between two kinds of situation in the early time (before the coincident point ), while the figure 7 implies that the influence of body surface temperature reduces as time goes by . Combing with the degree of comfort ofbath and the factor of health, we propose the second optimization strategy: Fully adapted to the hot water after getting into the bathtub.Strategy 2 –Adding water intermittentlyInfluence of adding methods of waterThere are two kinds of adding methods of water. One is the continuous; the other is the intermittent. We can use both different methods to add hot water.1122112()()()/()r H S dT H S T T c v T T c V V dt D μρρ∞⎡⎤=++-+--⎢⎥⎣⎦(12) Where r T is the temperature of the hot water.To meet .3O , we calculated the minimum water consumption by changing the flow rate of hot water. And we compared the minimum water consumptions of the continuous with the intermittent to determine which method is better.A . Adding water continuouslyAccording to the actual situation, we give specific values as follows and draw a picture of the change of temperature.040T =, 37d T =, 45r T =5001000150020002500300035003737.53838.53939.54040.5TimeT e m p e r a t u r eadd hot waterFigure 7. Adding water continuouslyIn most cases, people are used to have a bath in an hour. Thus we consumed that deadline of the bath: 3600final t =. Then we can find the best strategy in Figure 5 which is listed in Table 2.T able 3Strategy of adding water continuouslystart t final tt ∆ vr T varianceWater flow 4 min 1 hour56 min537.410m s -⨯45℃31.8410⨯0.2455 3mB . Adding water intermittentlyMaintain the values of 0T ,d T ,r T ,v , we change the form of adding water, and get another graph.5001000150020002500300035003737.53838.53939.540TimeT e m p e r a t u r et1=283(turn on)t3=2107(turn on)t2=1828(turn off)Figure 8. Adding water intermittentlyT able 4.Strategy of adding water intermittently()1t on ()2t off 3()t on vr T varianceWater flow 5 min 30 min35min537.410m s -⨯45℃33.610⨯0.2248 3mConclusionDifferent methods of adding water can influence the variance, water flow and the times of switching. Therefore, we give heights to evaluate comprehensively the methods of adding hot water on the basis of different hobbies of people. Then we build the following model:()()()2213600210213i i n t t i F T t T dtF v t dtF n -=⎧=-⎪⎪⎪=⎨⎪⎪=⎪⎩⎰∑⎰ (13) ()112233min F w F w F w F =++ (14)12123min ..510mini i t s t t t +>⎧⎨≤-≤⎩Evaluation on StrategiesFor example: Given a set of parameters, we choose different values of v and d T , and gain the results as follows.Method 1- AHPStep 1:Establish hierarchy modelFigure 9. Establish hierarchy modelStep 2: Structure judgment matrix153113511133A ⎡⎤⎢⎥⎢⎥=⎢⎥⎢⎥⎢⎥⎣⎦Step 3: Assign weight1w 2w3w 0.650.220.13Method 2-TopsisStep1 :Create an evaluation matrix consisting of m alternatives and n criteria, with the intersection of each alternative and criteria given as ij x we therefore have a matrixStep2:The matrix ij m n x ⨯()is then normalised to form the matrix ij m n R r ⨯=(), using thenormalisation method21r ,1,2,,;1,2,ijij mij i x i n j m x====∑…………,Step3:Calculate the weighted normalised decision matrix()(),1,2,,ij j ij m n m nT t w r i m ⨯⨯===⋅⋅⋅where 1,1,2,,nj j jj w W Wj n ===⋅⋅⋅∑so that11njj w==∑, and j w is the original weight given to the indicator,1,2,,j v j n =⋅⋅⋅.Step 4: Determine the worst alternative ()w A and the best alternative ()b A()(){}{}()(){}{}max 1,2,,,min 1,2,,1,2,,n ,min 1,2,,,max 1,2,,1,2,,n ,w ij ij wjbijij bjA t i m j J t i m j J t j A t i m j J t i m j J tj -+-+==∈=∈====∈=∈==where, {}1,2,,J j n j +==⋅⋅⋅ associated with the criteria having a positive impact, and {}1,2,,J j n j -==⋅⋅⋅associated with the criteria having a negative impact. Step 5: Calculate the L2-distance between the target alternative i and the worst condition w A()21,1,2,,m niw ij wj j d tt i ==-=⋅⋅⋅∑and the distance between the alternative i and the best condition b A()21,1,2,,m nib ij bj j d t t i ==-=⋅⋅⋅∑where iw d and ib d are L2-norm distances from the target alternative i to the worst and best conditions, respectively .Step 6 :Calculate the similarity to the worst condition Step 7 : Rank the alternatives according to ()1,2,,iw s i m =⋅⋅⋅ Step 8 : Assign weight1w2w 3w 0.55 0.170.23ConclusionAHP gives height subjectively while TOPSIS gives height objectively. And the heights are decided by the hobbies of people. However, different people has different hobbies, we choose AHP to solve the following situations.Impact of parametersDifferent customers have their own hobbies. Some customers prefer enjoying in the bath, so the .2O is more important . While other customers prefer saving water, the .3O is more important. Therefore, we can solve the problem on basis of APH . 1. Customers who prefer enjoying: 20.83w =,30.17w =According to the actual situation, we give initial values as follows:13S =,11V =,2 1.4631S =,20.05V =,33p T =,110μ=Ensure other parameters unchanged, then change the values of these parameters including 1S ,1V ,2S ,2V ,d T ,1μ. So we can obtain the optimal strategies under different conditions in Table 4.T able 5.Optimal strategies under different conditions2.Customers who prefer saving: 20.17w =,30.83w =Just as the former, we give the initial values of these parameters including1S ,1V ,2S ,2V ,d T ,1μ, then change these values in turn with other parameters unchanged. So we can obtain the optimal strategies as well in these conditions.T able 6.Optimal strategies under different conditionsInfluence of bubbleUsing the bubble bath additives is equivalent to forming a barrier between the bath water and air, thereby slowing the falling velocity of water temperature. According to the reality, we give the values of some parameters and gain the results as follows:5001000150020002500300035003334353637383940TimeT e m p e r a t u r eWithour bubbleWith bubbleFigure 10. Influence of bubbleT able 7.Strategies (influence of bubble)Situation Dropping rate of temperature (the larger the number, the slower)Disparity to theinitial temperatureWater flow Times of switchingWithout bubble 802 1.4419 0.1477 4 With bubble 34499.85530.01122The Figure 10 and the Table 7 indicates that adding bubble can slow down the dropping rate of temperature effectively . It can decrease the disparity to the initial temperature and times of switching, as well as the water flow.Improved ModelIn reality , human ’s motivation in the bathtub is flexible, which means that the parameter 1μis a changeable measure. Therefore, the parameter can be regarded as a random variable, written as ()[]110,50t random μ=. Meanwhile, the surface of water will come into being ripples when people moves in the tub, which will influence the parameters like 1S and 2S . So, combining with reality , we give the range of values as follows:()[]()[]111222,1.1,1.1S t random S S S t random S S ⎧=⎪⎨=⎪⎩Combined with the above model, the improved model is given here:()[]()[]()[]11221121111222()()()/()10,50,1.1,1.1a H S dT H S T T c v T T c V V dt D t random S t random S S S t random S S μρρμ∞⎧⎡⎤=++-+--⎪⎢⎥⎣⎦⎨⎪===⎩(15)Given the values, we can get simulation diagram:050010001500200025003000350039.954040.0540.140.15TimeT e m p e r a t u r eFigure 11. Improved modelThe figure shows that the variance is small while the water flow is large, especially the variance do not equals to zero. This indicates that keeping the temperature of water is difficult though we regard .2O as the secondary objective.Sensitivity AnalysisSome parameters have a fixed value throughout our work. By varying their values, we can see their impacts.Impact of the shape of the tub0.70.80.91 1.1 1.2 1.3 1.433.23.43.63.84Superficial areaT h e t i m e sFigure 12a. Times of switching0.70.80.91 1.11.21.31.43890390039103920393039403950Superficial areaV a r i a n c eFigure 12b. V ariance of temperature0.70.80.91 1.1 1.2 1.3 1.40.190.1950.20.2050.21Superficial areaW a t e r f l o wFigure 12c. Water flowBy varying the value of some parameters, we can get the relationships between the shape of tub and the times of switching, variance of temperature, and water flow et. It is significant that the three indexes will change as the shape of the tub changes. Therefore the shape of the tub makes an obvious effect on the strategies. It is a sensitive parameter.Impact of the volume of the tub0.70.80.91 1.1 1.2 1.3 1.4 1.533.544.55VolumeT h e t i m e sFigure 13a. Times of switching。


集成电路专业公开发过的论文摘要参考集成电路专业是电子工程的一个重要分支,在现代电子技术发展中发挥着至关重要的作用。
以下是一些公开发过的集成电路专业论文的摘要,希望能够给读者提供一些参考和启示。
论文一:基于图像处理技术的集成电路缺陷检测该论文旨在通过图像处理技术,实现对集成电路制造过程中可能存在的缺陷进行高效、精准的检测。
其中,研究人员首先对待检测的集成电路样品进行图像采集和预处理,之后通过图像分割、形态学处理等方法,得到集成电路的纹理特征和周边信息;接着,研究人员结合机器学习算法,对图像特征进行训练,并建立了一套自适应的缺陷检测模型,该模型可以根据不同物理特性的缺陷进行分类检测。
最终,实验结果表明,该方法可以高效地检测出所有缺陷,并具有较高的准确率和鲁棒性。
论文二:集成电路中时钟树设计优化该论文针对时钟树在集成电路设计中的重要性,研究了一种基于最短路径算法的时钟树设计方法,并将其在FPGA芯片的设计中进行了验证。
研究人员首先通过全局路径搜索,得到了传输时钟所需的最短路径,然后利用具有流动性的O(1)时钟基准树来构建大型时钟树,并利用所提出的动态调度算法实现了布图。
最后,以Xilinx Virtex-6系列FPGA芯片为例验证了该方法的有效性和性能。
结果表明,该时钟树设计方法能够提高系统时钟频率,减少功耗,并且实现的时钟延迟在一个可接受的范围内。
论文三:基于ICM方法的真实时间温度补偿电路设计该论文通过Intelligent Compensation Method (ICM)算法,提出了一种适应环境温度变化的实时温度补偿电路设计方法,该方法较好地解决了温度变化对集成电路的影响。
该方法的设计流程具有非常高的仿真准确率和强鲁棒性,通过对多组不同情况下的温度测试数据进行仿真分析,可以得出该方法的设计误差率和热滞后现象均比传统方法更低。
最终,实验结果表明,该设计方法可以有效地提高真实时间系统的可靠性和鲁棒性。

高教社杯全国大学生数学建模竞赛承诺书我们仔细阅读了中国大学生数学建模竞赛的竞赛规则。
我们完全明白,在竞赛开始后参赛队员不能以任何方式(包括电话、电子邮件、网上咨询等)与队外的任何人(包括指导教师)研究、讨论与赛题有关的问题。
我们知道,抄袭别人的成果是违反竞赛规则的,如果引用别人的成果或其他公开的资料(包括网上查到的资料),必须按照规定的参考文献的表述方式在正文引用处和参考文献中明确列出。
我们郑重承诺,严格遵守竞赛规则,以保证竞赛的公正、公平性。
如有违反竞赛规则的行为,我们将受到严肃处理。
我们参赛选择的题号是(从A/B/C/D中选择一项填写):A我们的参赛报名号为(如果赛区设置报名号的话):99999所属学校(请填写完整的全名):西安交通大学参赛队员(打印并签名):1.一作者2.二作者3.三作者指导教师或指导教师组负责人(打印并签名):导师日期:2011年8月1日赛区评阅编号(由赛区组委会评阅前进行编号):2011高教社杯全国大学生数学建模竞赛编号专用页赛区评阅编号(由赛区组委会评阅前进行编号):赛区评阅记录(可供赛区评阅时使用):评阅人评分备注全国统一编号(由赛区组委会送交全国前编号):全国评阅编号(由全国组委会评阅前进行编号):全国大学生数学建模竞赛L A T E X2ε模板摘要这是数学建模论文模板mcmthesis的示例文件。
特别地,这篇文档是“全国大学生数学建模竞赛(CUMCM)”模板的示例文件。
这个模板使用于参加高教社杯全国大学生数学竞赛的同学准备他们的建模论文,帮助他们更多的关注于论文内容而非论文的排版。
这个模板的设计是根据2010年修订的《全国大学生数学建模竞赛论文格式规范》[1]制作,完全符合该论文格式规范,但是该模板未得到官方认可,请使用者自己斟酌使用。
这个示例文档逐条展示其对[1]的实现效果,并对所有自定义命令进行说明。
这个示例文件还包含了一些对公示、插图、表格、交叉引用、参考文献、代码等的测试部分,以展示其效果,并作简要的使用说明。

2013年百篇最具影响力国际学术论文和国内学术论文
2014年9月26日,中国科学技术信息研究所发布,2013年百篇最具影响力国际学术论文,我校共两篇:
论文题目:Ultralight and Highly Compressible Graphene Aerogels
论文作者:Hu,H;Zhao, Z B;Wan, W B;Gogotsi,Y;Qiu, J S
所属机构:大连理工大学
来源期刊:ADVANCED MATERIALS,2013,25(15):2219-2223
被引次数:38
论文题目:Recent Research and Applications of GPS-based Monitoring Technology for High-rise Structures
论文作者:Yi, T H;LI, H N; Gu, M
所属机构:大连理工大学
来源期刊:STRUCTURAL CONTROL & HEALTH MONITORING,2013,20(5):649-670
被引次数:18
2013年百篇最具影响力国内学术论文,我校共两篇:
论文题目:基于可变模糊集的辩证法三大规律数学定理及其应用
论文作者:陈守煜
所属机构:大连理工大学
来源期刊:大连理工大学学报,2010,50(5):838-844
被引次数:18
论文题目:水资源系统可变集评价原理与方法
论文作者:陈守煜
所属机构:大连理工大学
来源期刊:水力学报,2013,(02):134-142
被引次数:4。


For office use onlyT1________________ T2________________ T3________________ T4________________ Team Control Number11111Problem ChosenABCDFor office use onlyF1________________F2________________F3________________F4________________ 2015Mathematical Contest in Modeling (MCM/ICM) Summary Sheet In order to evaluate the performance of a coach, we describe metrics in five aspects: historical record, game gold content, playoff performance, honors and contribution to the sports. Moreover, each aspect is subdivided into several secondary metrics. Take playoff performance as example, we collect postseason result (Sweet Sixteen, Final Four, etc.) per year from NCAA official website, Wikimedia and so on.First, ****grade.To eval*** , in turn, are John Wooden, Mike Krzyzewski, Adolph Rupp, Dean Smith and Bob Knight.Time line horizon does make a difference. According to turning points in NCAA history, we divide the previous century into six periods with different time weights which lead to the change of ranking.We conduct sensitivity analysis on FSE to find best membership function and calculation rule. Sensitivity analysis on aggregation weight is also performed. It proves AM performs better than single model. As a creative use, top 3 presidents (U.S.) are picked out: Abraham Lincoln, George Washington, Franklin D. Roosevelt.At last, the strength and weakness of our mode are discussed, non-technical explanation is presented and the future work is pointed as well.Key words: Ebola virus disease; Epidemiology; West Africa; ******ContentsI. Introduction (2)1.1 (2)1.2 (2)1.3 (2)1.4 (2)1.5 (2)1.6 (2)II. The Description of the Problem (2)2.1 How do we approximate the whole course of paying toll? (2)2.2 How do we define the optimal configuration? (3)2.3 The local optimization and the overall optimization (3)2.4 The differences in weights and sizes of vehicles (3)2.5 What if there is no data available? (3)III. Models (3)3.1 Basic Model (3)3.1.1 Terms, Definitions and Symbols (3)3.1.2 Assumptions (3)3.1.3 The Foundation of Model (4)3.1.4 Solution and Result (4)3.1.5 Analysis of the Result (4)3.1.6 Strength and Weakness (4)3.2 Improved Model (4)3.2.1 Extra Symbols (5)3.2.2 Additional Assumptions (5)3.2.3 The Foundation of Model (5)3.2.4 Solution and Result (5)3.2.5 Analysis of the Result (6)3.2.6 Strength and Weakness (6)IV. Conclusions (6)4.1 Conclusions of the problem (6)4.2 Methods used in our models (6)4.3 Applications of our models (6)V. Future Work (6)5.1 Another model (6)5.1.1 The limitations of queuing theory (6)5.1.2 (6)5.1.3 (7)5.1.4 (7)5.2 Another layout of toll plaza (7)5.3 The newly- adopted charging methods (7)VI. References (8)VII. Appendix (8)I. IntroductionIn order to indicate the origin of the toll way problems, the following background is worth mentioning.1.11.21.31.41.51.6II. The Description of the Problem2.1 How d o we approximate the whole course of paying toll?●●●●2.2 How d o we define the optimal configuration?1) From the perspective of motorist:2) From the perspective of the toll plaza:3) Compromise:2.3 The l ocal optimization and the overall optimization●●●Virtually:2.4 The differences in weights and sizes of vehicl es2.5 What if there is no data availabl e?III. Models3.1 Basic Model3.1.1 Terms, Definitions and SymbolsThe signs and definitions are mostly generated from queuing theory.●●●●●3.1.2 Assumptions●●●●●3.1.3 The Foundation of Model1) The utility function●The cost of toll plaza:●The loss of motorist:●The weight of each aspect:●Compromise:2) The integer programmingAccording to queuing theory, we can calculate the statistical properties as follows.3)The overall optimization and the local optimization●The overall optimization:●The local optimization:●The optimal number of tollbooths:3.1.4 Solution and Result1) The solution of the integer programming:2) Results:3.1.5 Analysis of the Result●Local optimization and overall optimization:●Sensitivity: The result is quite sensitive to the change of the three parameters●Trend:●Comparison:3.1.6 Strength and Weakness●Strength: In despite of this, the model has proved that . Moreover, we have drawnsome useful conclusions about . T he model is fit for, such as●Weakness: This model just applies to . As we have stated, .That’s just whatwe should do in the improved model.3.2 Improved Model3.2.1 Extra SymbolsSigns and definitions indicated above are still valid. Here are some extra signs and definitions.●●●●3.2.2 Additional Assumptions●●●Assumptions concerning the anterior process are the same as the Basic Model.3.2.3 The Foundation of Model1) How do we determine the optimal number?As we have concluded from the Basic Model,3.2.4 Solution and Result1) Simulation algorithmBased on the analysis above, we design our simulation arithmetic as follows.●Step1:●Step2:●Step3:●Step4:●Step5:●Step6:●Step7:●Step8:●Step9:2) Flow chartThe figure below is the flow chart of the simulation.3) Solution3.2.5 Analysis of the Result3.2.6 Strength and Weakness●Strength: The Improved Model aims to make up for the neglect of . The resultseems to declare that this model is more reasonable than the Basic Model and much more effective than the existing design.●Weakness: . Thus the model is still an approximate on a large scale. This hasdoomed to limit the applications of it.IV. Conclusions4.1 Conclusions of the probl em●●●4.2 Methods used in our mod els●●●4.3 Applications of our mod els●●●V. Future Work5.1 Another model5.1.1 The limitations of queuing theory5.1.25.1.35.1.41)●●●●2)●●●3)●●●4)5.2 Another layout of toll plaza5.3 The newly- ad opted charging methodsVI. References[1][2][3][4]VII. Appendix。

隐喻嵌入中的转喻模式研究【摘要】转喻构成机制是在同一理想化认知模式内运行的,人们以事物邻近性为基础,而隐喻构成机制是发生在两个不同认知域,人们以事物的相似性为基础,这种“邻近性”和“相似性”的联想可能存在复杂的相互作用。
本论文根据goossens提出的隐转喻模式,采用实例分析法,探讨语料中隐喻和转喻的关系,旨在研究转喻和隐喻间的相互作用模式,这些相互作用模式对语言在人类大脑的生成的研究具有启发性,并能很好地应用到语言的分析中。
【关键词】隐转喻相互作用模式;转喻构成机制;隐喻构成机制1.转喻的邻近性概念转喻是发生在同一理想化认知模型(icm)内的认知操作过程,其中一个概念实体(vehicle)为另一个概念实体(target)提供心理可及。
[1]转喻映射以邻近性(contiguity)为基础。
转喻的生成关系是同一理想化认知模式中的整体与其成分或者同一理想化认知模式中事物的各部分之间的显著关系为前提,而这一显著的关系是以邻近性为基础的。
2.隐喻的相似性概念隐喻涉及两个概念域,其中一个概念域说明另一概念域,隐喻映射以相似性(similarity)为基础,说明的概念域称作源域( source domain),被说明的概念域称作目标域( target domain)。
[2]隐喻意义的理解实际上就是人们将有关源域的知识映射到目标域,从而重新认识目标域部分特征的过程。
3.goossens的隐转喻模式goossens(1990)指出,虽然在原则上隐喻和转喻是两个不同的认知过程,但两者并不互相排斥,而是在语言中结合在一起。
有鉴于此,goossens创造了“metaphtonymy”(隐转喻)一词来指称二者的相互作用现象。
他区分了四类隐喻和转喻的互动关系,:(1)metaphor from metonymy;(2)metonymy within metaphor;(3)metaphor within metonymy;(4)metonymy from metaphor。

有限元分析论文范文3篇立柱整机有限元分析论文论文摘要:基于连续体ICM拓扑优化方法,提出了以体积为约束条件,机床的固有频率为目标函数的结构动态设计方法。
为提高拓扑优化的精度,在结构优化过程中,同时也考虑了非设计区域的动态特性。
将该方法应用到XH6650高速加工中心的立柱结构优化中,从而提高了机床的整机动态特性。
论文关键词:拓扑优化;动态设计;动态特性本文针对XH6650高速卧式加工中心进行了整机的CAD/CAE建模和模态分析,根据分析结果确定该加工中心的立柱对整机的动态特性影响最大。
因此,选择加工中心的立柱为对象,基于ICM(independent—continuousmapping)拓扑优化方法,对其结构进行拓扑优化,以通过提高立柱的动态性能来达到提高整机动态性能的目的。
针对立柱结构,文中以结构的固有频率为目标函数,体积为约束的优化模型,在模型的建立过程中,也考虑到了安装在立柱上的主轴箱对其动态特性的影响,把主轴箱用相同的质量块来模拟代替,这样得到的立柱的优化结果,将使整个机床的动态性能得到更好的改善。
1XH6650高速卧式加工中心的CAD/CAE模型与模态分析该加工中心主要结构件由机床床身、立柱、主轴箱、工作台等组成,如图1所示。
整机主要采用8节点单元Solid185对各零、部件进行网格划分,导轨结合面采用测试获得的动刚度和阻尼进行界面连接,螺栓结合面采用梁单元相连接,根据实际边界条件,对该模型中的床身底部进行约束处理。
最终得到整机有限元模型共有21.2万Solid185单元,如图2所示。
为确定加工中心主要结构件对机床动态特性的影响,对整机进行了模态分析,图3~图6是整机前4阶振型和对应的固有频率。
由模态分析结果可以看出,第1阶模态主要是立柱的左右向摆动,整机的振动模态频率为86.45Hz。
立柱和主轴箱等部件作为一个刚体在底座与工作台组成的基础件上部作横向摆动,主振系统是立柱和主轴箱。
因此,该振动频率取决于立柱和主轴箱的y向刚度与质量。

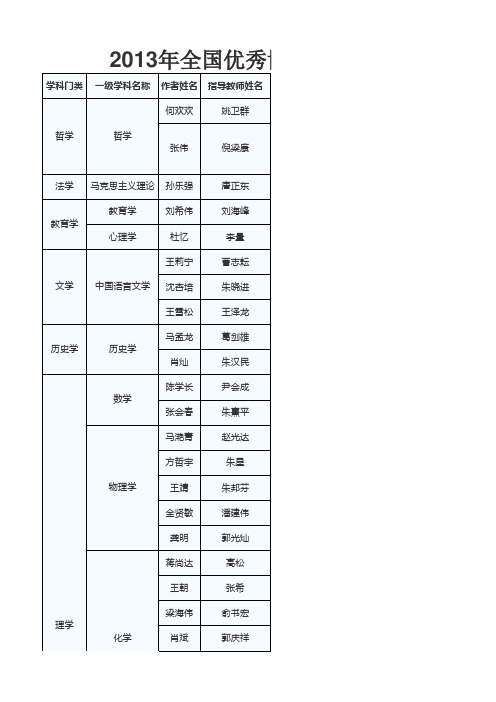
2013年全国优秀博士学位论文评选结果公布2013-12-252013年全国优秀博士学位论文评选专家复审工作日前结束。
本次全国优秀博士学位论文评选是继1999年首次评选后的第十五次评选,参评对象主要为2010年9月至2011年8月在国内学位授予单位获得博士学位者的学位论文,少量在2006年9月至2010年8月获得博士学位者的学位论文也参加了评选。
经过学位授予单位推荐、省级学位委员会初选、同行专家通讯评议、专家复审四个阶段,共评选出全国优秀博士学位论文100篇。
根据《全国优秀博士学位论文评选办法》,现予以公示。
自公示之日起60日内,有发现入选论文存在学术不端行为,或论文的主要研究成果不能成立等严重问题者,可以书面方式向教育部学位管理与研究生教育司提出异议。
提出异议的书面材料应包括异议论文的题目、作者姓名、学位授予单位名称、异议内容,支持异议的具体证据或科学依据,以及提起异议者的真实姓名、工作单位、联系地址、联系电话等。
对提出异议的单位或个人,教育部学位管理与研究生教育司将予以保密。
有关材料请直接寄送教育部学位管理与研究生教育司(地址:北京市西单大木仓胡同35号,邮政编码:)。
异议期结束后,全国优秀博士学位论文由教育部和国务院学位委员会批准。
入选论文情况如下,点击论文题目可以阅读相应论文:基础研究类学科门类一级学科名称作者姓名指导教师姓名论文题目学位授予单位名称哲学哲学何欢欢姚卫群《中观心论》及其古注《思择炎》对外道思想批判的研究北京大学张伟倪梁康质料先天与人格生成——对舍勒现象学的质料价值伦理学的系统研究中山大学法学马克思主义理论孙乐强唐正东马克思再生产理论研究南京大学教育学教育学刘希伟刘海峰中国历史上的"高考移民":清代科举冒籍研究厦门大学心理学杜忆李量对听感觉运动门控自上而下调节的动物模型和神经机制北京大学文学中国语言文学王莉宁曹志耘汉语方言声调分化研究北京语言大学沈杏培朱晓进小说中的“文革”:当代小说对“文革”的叙事流变史(1977-2009)南京师范大学王雪松王泽龙中国现代诗歌节奏原理与形态研究华中师范大学历史学历史学马孟龙葛剑雄西汉侯国地理复旦大学肖灿朱汉民嶽麓書院藏秦簡《數》研究湖南大学。


2013高教社杯全国大学生数学建模竞赛题目(请先阅读“全国大学生数学建模竞赛论文格式规范”)A题车道被占用对城市道路通行能力的影响车道被占用是指因交通事故、路边停车、占道施工等因素,导致车道或道路横断面通行能力在单位时间内降低的现象。
由于城市道路具有交通流密度大、连续性强等特点,一条车道被占用,也可能降低路段所有车道的通行能力,即使时间短,也可能引起车辆排队,出现交通阻塞。
如处理不当,甚至出现区域性拥堵。
车道被占用的情况种类繁多、复杂,正确估算车道被占用对城市道路通行能力的影响程度,将为交通管理部门正确引导车辆行驶、审批占道施工、设计道路渠化方案、设置路边停车位和设置非港湾式公交车站等提供理论依据。
视频1(附件1)和视频2(附件2)中的两个交通事故处于同一路段的同一横断面,且完全占用两条车道。
请研究以下问题:1.根据视频1(附件1),描述视频中交通事故发生至撤离期间,事故所处横断面实际通行能力的变化过程。
2.根据问题1所得结论,结合视频2(附件2),分析说明同一横断面交通事故所占车道不同对该横断面实际通行能力影响的差异。
3.构建数学模型,分析视频1(附件1)中交通事故所影响的路段车辆排队长度与事故横断面实际通行能力、事故持续时间、路段上游车流量间的关系。
4.假如视频1(附件1)中的交通事故所处横断面距离上游路口变为140米,路段下游方向需求不变,路段上游车流量为1500pcu/h,事故发生时车辆初始排队长度为零,且事故持续不撤离。
请估算,从事故发生开始,经过多长时间,车辆排队长度将到达上游路口。
附件1:视频1附件2:视频2附件3:视频1中交通事故位置示意图附件4:上游路口交通组织方案图附件5:上游路口信号配时方案图注:只考虑四轮及以上机动车、电瓶车的交通流量,且换算成标准车当量数。
视频1中交通事故位置示意图附件4上游路口信号配时方案。
How long any more years of the earth ?AbstractWith the development of human society, the Earth's requirement for the survival of mankind have become more sophisticated, livable living environment, people aspire to live. Evaluation of health indicators is to use the Earth's Millennium Ecosystem is its evaluation, but the evaluation process ignored a number of factors, we have established a global network health model to predict the health of the planet. Firstly, we can use a simple model for the environment, resources and population were analyzed, through the establishment of the Malthusian growth model, to predict the peak of the future population, we analyzed can predict, to the early 22 century, the population may reach 10 billion, this when reaching the earth's balance.Then we have the resources and the environment on Earth for analysis. Through the analysis of resource data, find the amount of resources per capita, according to the population model to predict the number of years the use of future resources. Analysis can know, 1.74 tons of total resources / person, use of resources can be reached in 2632. We use the number of environmental pollution in recent years, major pollution analysis right weight, and explain which changes in the relationship between the weight of pollution, it found that the proportion of soil contamination increases, while the proportion of other pollution reduction, analysis, improve human quality of life requirements It is the main factor leading to change.Finally, we establish a healthy model, the health of our planet is divided into five grades. According to the environment, resources, population three analysis, the relationship between identify and make their relationship diagram, find it feasible region, and analysis shows that before the feasible region, health indicators planet for good, suitable for human survival and development. In the health indicators feasible region, the Earth is in need government regulation to keep it stable. Greater than the feasible region, health indicators planet is poor, it should put pressure on the government to improve people's way of life and resource utilization, so that the earth to achieve good health indicators.Key words:Evaluation of health ; Malthusian growth;government regulationIntroductionEarth's environmental and biological systemsare becoming more and more serious,however, it is very important for human to study the environmental and biological systems. More and more scientific studies the earth's environmental and biological systems, but now those model can’t s truly to forecast .Many models ignore complex global. In order tomaking the earth's environmental and biological systems betterforecast. We need developing model to forecast the biological and environmental health conditions. Including some aspects:1.we can build a simple global models using local or regional components of the Earth's health that predict potential state changes and help decision makers design effective policies based on their potential impact on Earth's health.2.Build a dynamic global network model of some aspect of Earth's health (you develop the measure) by identifying local elements of this condition (network nodes) and appropriately connecting them (network links) to track relationship and attribute effects.3.Run model to see how it predicts future Earth health. and One of the powerful elements of using network modeling is the ability to analyze the network structure.At first of all, we study effects of the global ecosystem in a particular area of a single element of the global ecosystem.Run Logistic mode ,by analysis, changes in population in the future, the conclusion that the maximum capacity of the population is about 10 billion, times to the early 22 century.Resource analysis, is also an important factor. We analyzed the amount of use of resources per capita in the world, and according to the growth exponential population model to predict the future to 2632, the earth's resources will be depleted.Use air pollution index, analyzes the three major pollution share of the weight, and its effect on the Earth's health indicatorsFinally, we use the earth to its comprehensive analysis of the health index. Three resources derived feasible region, feasible region, the earth's resources, the environment, the Earth's population will be the critical value of the health index. Assumptions and Symbol DescriptionAssumptions:Hypothesis 1: destruction of natural disaster don't happen in the futureHypothesis 2:world war will not occurHypothesis 3: there is no new content found enormous energyHypothesis 4: only mentioned main factors, ignoring other factorsHypothesis 5:does not take into account other factors on the population, such asearthquakes, tsunamis, etc.Hypothesis 6.without considering the impact on the environment of other factors,such as diseaseHypothesis 7.not take into account other factors that affect the resource, such as awaste of resources, etc.Symbol Description : dxdtAny year of any population r The rate of population increase0x The population of the year1n s +; A year after the year of the resourcesn s :One of the resourcesn p : One of the populationN :Some yearModeling and Solution1.1 developmentLogistic modeWith the assumption that the population is continuously differentiable function of time.Suppose population growth rate is proportional to the existing population, the proportion coefficient r.At first, assume that a single variable impact on ecosystems, namely the establishment of the relationship between the population and the carrying capacity of the Earth. On the basis of assumptions, we can get a differential equation. such as formula (1)(1)Solving for (1) we obtain :()0rt x t x e =()00dxrx dt x x ⎧=⎪⎨⎪=⎩When we consider the external factors, such as air, water and resources, can be improved on the model, set its maximum carrying capacity of K, then the model is modified.Example formula (2):(2)Solving for (2) we obtain :()()000rtKx x t x K x e -=+-The use of 1980 the number of people in the world and we assume a steady growthrate, we can predict the future of the world's population to the number .in the following table 1.1.Table1. 1 Predicting the population number1.2 Solution modeIn order to predict the relationship between the population and the carryingcapacity of the Earth, we searchfor the world's population the number on the international website in the following table1. 2.Table1.2.The relationship between the population and the timeWe can use the table to make a data pattern to describe the relationship between the time and the maximum capacity of the Figure 1.1:()00dx K x rx dtk x x-⎧⎛⎫=⎪ ⎪⎝⎭⎨⎪=⎩Figure1.1. The relationship between the population and the time From the above chart analysis we can now that when we take into account other factors,the With the increase in population after population growth rate to increase or decrease, approximately in the 1980s, the population growth rate to achieve maximum reach K / 2, if the time T tends to infinity, then the population will reach a stable value K.According to our search for global population data, import Equation 2 can be found in the According to our search for global population data, import Equation 2 can be found in the population with our forecast basically coincide, verify the correctness of our model. When the earth reaches its maximum capacity of the population is about 10 billion,times to the early 22 century.1.3The impact of policiesSome regional governments will introduce some policies, such as China's family planning policy, subsidy policy of the US population, have an overall impact on population growth in each country, if the natural population growth rate is changed, then we are only applicable to this model in predicting a country's population, but can not predict the changes in the global population growth rate on the basis of change, but on the whole, regardless of how changes in policy, how growth rates change, global population to accommodate the amount of each country's population Sum.2.1 theResourcesResources is very important tohuman. it is the lifeblood of the planet, if lose it , people will not survive, it can be divided into renewable resources and non-renewable resources, renewable resources through consumption, recycling, into the original storage resources up, and non-renewable resources through consumption will become little and little less, if unrestricted exploitation of human beings, most resources will be exhausted, the world will also be coming to an end. The amount of resources and the use of a country's population has a relationship, the greater the population the greater the consumption of resources, population and resource consumption werepositively correlated. We have an example of a Chinese analysis, the relationship between population and resource consumption. We can search for the total amount of resources in China Statistics Bureau official website. such as table2.1 .Figure 2.1 Changes Line charts renewable resources From the above chart analysis, as the population increases the number of renewable resources. Mainly because of population increase demand for resources increases, all kinds of resources into renewable resources such as solar energy into electrical energy, so that the increase of renewable raw resources.Figure 2.2 Changes Line charts Nonrenewable resourcesFrom the above chart analysis shows that:Non-renewable resources as population increases and decreases in population increases the demand for non-renewable resources of large, resulting in its stock declineAccording to changes in reserves, we can calculate the annual consumption of certainnon-renewable resources,which is:n 11nn nS ++Φ=-S P -PThe results in the following table 2.2Table 2.2 the annual consumption of certain non-renewable resources,Analysis of the chart shows that resource consumption increases with the increase in population, the per capita consumption of 1.74 tons of total resources / person, we change the model based on a natural population growth rate, according to the number of population projections to predict the future of non-renewable resources depletion time in 2632, to protect the rational use of the earth's resources before resource depletion, the government should introduce policies to restrict the exploitation of resources, limit population growth to some extent.3.1the environment Comprehensive pollution index modelFor Earth's ecological systems, pollution is an important factor. The major pollutants of air pollution, water pollution, soil pollution, along with humans in the production and development, with the population surge in our human way of life is different, you can see the pollution index is not the same every year. we establish integrated pollution index model, the establishment of a comprehensive analysis of air pollution, water pollution, soil pollution, pollution index obtained.The environmental pollution indexrepresents the environmental quality of water, air and soil pollution levels of single factor evaluation index; and then weighted evaluation method to make a comprehensive assessment of environmental pollution quantitatively, these indices reflect the macro environment quality.3.1 mode developmentWe use comprehensive pollution index to assess environmental health indicators, we first build the model.Comprehensive pollution index:1nj iji P P==∑,ij ij i C P C =,Pollutionsharing rateexpression100%ij i jP K P =⋅3.2 Solving ModelAccording to our search data, as shown in Table 3.1, for three times the pollution of the environment pollution to a comprehensive evaluation, determine its pollution rate, the comprehensive requirements of its weight. As shown in Table 3.2annual proportion, shown in Figure 3.1Figure 3.1 The main pollution share of the weight distribution According to the chart analysis, we can know that the soil pollution over time, gradually increased, while water and air pollution, decreased, mainly due to the extensive use of pesticides and fertilizers in recent years as a result of soil pollution, and improve people's quality of life, the environment and water resources quality requirements are also increasing, so the decline in the proportion of pollution. But industrial development is also an important cause of pollution. Industrial wastewater emissions, making land alkaline, desertification is serious. So an increase in land pollution, and other pollution declined.4.1 the earth health modelBy the three models, we can establish a comprehensive health indicators of the Earth, the total amount of resources, population, environmental pollution index were analyzed. First we define health indicators planet is five. Classification criteria are as follows.One for the poor, the total amount of resources, population, pollution index, reached the limits of the Earth's carrying amount exceeds its2 total pass resources, population, pollution index, will soon reach the limit, the Earth will arrive carrying over3 in total resources, population, environmental pollution index Comprehensive moderate, the overall maintained at a feasible region, then it needs to be introduced to the existing government policies with reasonable regulationThe total amount of good resources 4, population, pollution index, well, have a greater capacity of the EarthTotal five excellent resources, population, pollution index, excellent for human survival and development.We use the above data, the three fitting shown in FIG consent coordinates.According to the above to the total resources, population, environmental pollution index comprehensive analysis available, such as Figure 4.1Figure 4.1Relationship between environment, resources, population between When the number of population, total comprehensive environmental index and resources in a feasible region, indicating that at this time the Earth's health indicators, the government should introduce policies to regulate them. When the time is less than when the feasible region, indicating that at this time the Earth's health indicators as excellent or good, suitable for the production of human life. When the time is longer than when the feasible region, indicating that at this time the Earth is passing health indicators or poor. At this point it should alert the carrying capacity of the Earth to regulate natural resources and environment of the population, so that it can allow people to live in harmony.The advantages and disadvantages of population modelFor first model:Advantages: this model has simple structure, good feasibility, can better predict the growth of population growth change over time, the calculation results can be seen from the figure can be in conformity with the relationship between the number and time, can use a better description of the rule of variation of population, provide the basis for controlling the population quantity.Disadvantages: without considering the foreign staff and external environment factors on the influence of population change, such as disease, accident, such as changes in the environment and national policy, will bring fluctuation on populationgrowth.For second modelAdvantage: this model is simple to understand, and very good describes the relationship between storage of resource utilization, in the role of human Disadvantages: we in the establishment of the model and solving process, less considering the nature of production capacity, make part of resource transformation, on the other hand, we also assume that, in accordance with the current policy unchanged, it will have a little deviation between the estimated and the real value.The advantages and disadvantages of the third model:Advantages, it is the objective description of the relationship between environmental pollution to human, the model is simple and easy to understand,Disadvantages: is the integration of human and nature, and in the process of our solution, we don't have to consider the influence of the nature itself, can make the result bias.The advantages and disadvantages of the fourth model:Advantages: the model good description of population and resources, and the relationship between the environment, according to the population and the environment, the optimal balance between population and resources, it is concluded that the population range between the two, the trinity and the elastic range, and better expressed by the mutual influence between the three relations, according to the data of a few years ago and computation, can very good match, to predict the earth load balance.Disadvantages: less the model to consider other factors, such as government policies and regulations, the development of science and technology progress, and so on, can cause some deviation to predict the results.Reference[1] Jiang Qiyuan mathematical model (second edition), Higher Education Press, 1993[2] Xiang Luo. The establishment and application .Journal China Population Growth Prediction Model of Henan Institute of Science and Technology.Sep.2008[3] Zhang Xiao. Trend of and the Governance System for Water Pollution in China. Center for Enviromental and Development, Chinese Academy of Social Sciences,2007[4] LI Xiao fei,ZHANG Ming- jun. Variation Characteristics and Influencing Factors of Air Pollution Index in China. ENVIRONMENTAL SCIENCE.Jun.2012[5] Zhang Liu. Factors Influencing the‘‘KValue”of Human Carrying Capacity. China Population Resourcesand E nvironment.2007。