收藏级资源肿瘤数据库汇总
- 格式:doc
- 大小:6.41 MB
- 文档页数:29

DOI: 10.3322/caac.200062009;59;225-249; originally published online May 27, 2009;CA Cancer J Clin Michael J. ThunAhmedin Jemal, Rebecca Siegel, Elizabeth Ward, Yongping Hao, Jiaquan Xu andCancer Statistics, 2009This information is current as of September 15, 2010/cgi/content/full/59/4/225located on the World Wide Web at:The online version of this article, along with updated information and services, is/subscriptions/individuals only): , go to (US CA: A Cancer Journal for Clinicians To subscribe to the print issue of Print ISSN: 0007-9235. Online ISSN: 1542-4863.Williams Street NW, Atlanta GA 30303. (©American Cancer Society, Inc.) All rights reserved. is owned, published, and trademarked by the American Cancer Society, 250CA November 1950. Society by Wiley-Blackwell. A bimonthly publication, it has been published continuously since is published six times per year for the American CancerCA: A Cancer Journal for Clinicians by on September 15, 2010 (©American Cancer Society, Inc.) Downloaded fromCancer Statistics,2009Ahmedin Jemal,DVM,PhD 1,Rebecca Siegel,MPH 2,Elizabeth Ward,PhD 3,Yongping Hao,PhD 4,Jiaquan Xu,MD 5,Michael J.Thun,MD,MS 6AbstractEach year,the American Cancer Society estimates the number of new cancer cases and deaths expected in the United States in the current year and compiles the most recent data on cancer incidence,mortality,and survival based on incidence data from the National Cancer Institute,Centers for Disease Control and Prevention,and the North American Association of Central Cancer Registries and mortality data from the National Center for Health Statistics.Incidence and death rates are standardized by age to the 2000United States standard million population.A total of 1,479,350new cancer cases and 562,340deaths from cancer are projected to occur in the United States in 2009.Overall cancer incidence rates decreased in the most recent time period in both men (1.8%per year from 2001to 2005)and women (0.6%per year from 1998to 2005),largely because of decreases in the three major cancer sites in men (lung,prostate,and colon and rectum [colorectum])and in two major cancer sites in women (breast and colorectum).Overall cancer death rates decreased in men by 19.2%between 1990and 2005,with decreases in lung (37%),prostate (24%),and colorectal (17%)cancer rates accounting for nearly 80%of the total decrease.Among women,overall cancer death rates between 1991and 2005decreased by 11.4%,with decreases in breast (37%)and colorectal (24%)cancer rates accounting for 60%of the total decrease.The reduction in the overall cancer death rates has resulted in the avoidance of about 650,000deaths from cancer over the 15-year period.This report also examines cancer incidence,mortality,and survival by site,sex,race/ethnicity,education,geographic area,and calendar year.Although progress has been made in reducing incidence and mortality rates and improving survival,cancer still accounts for more deaths than heart disease in persons younger than 85years of age.Further progress can be accelerated by applying existing cancer control knowledge across all segments of the population and by supporting new discoveries in cancer prevention,early detection,and treatment.CA Cancer J Clin 2009;59:225-249.©2009American Cancer Society,Inc.IntroductionCancer is a major public health problem in the United States and many other parts of the world.Currently,one in four deaths in the United States is due to cancer.In this article,we provide an overview of cancer statistics,including updated incidence,mortality and survival rates,and expected numbers of new cancer cases and deaths in 2009.Materials and MethodsData SourcesMortality data from 1930to 2006in the United States were obtained from the National Center for Health Statistics (NCHS).1Incidence data for long-term trends (1975-2005),5-year relative survival rates,and data on lifetime probability of developing cancer were obtained from the Surveillance,Epidemiology,and End Results1Strategic Director,Cancer Surveillance,Surveillance and Health Policy Research,American Cancer Society,Atlanta,Georgia.2Manager,Surveillance Information Services,Surveillance and Health Policy Research,American Cancer Society,Atlanta,Georgia.3Vice President,Surveillance and Health Policy Research,American Cancer Society,Atlanta,Georgia.4Senior Epidemiologist,Surveillance and Health Policy Research,American Cancer Society,Atlanta,Georgia.5Epidemiologist,Mortality Statistics Branch,Division of Vital Statistics,National Center for Health Statistics,Centers for Disease Control and Prevention,Hyattsville,Maryland.6Vice President Emeritus,Epidemiology and Surveillance Research,American Cancer Society,Atlanta,Georgia.Corresponding author:Ahmedin Jemal,DVM,PhD,Surveillance and Health Policy Research,American Cancer Society,250Williams Street,NW,Atlanta,GA 30303-1002;ahmedin.jemal@DISCLOSURES:The findings and conclusions in this report are those of the authors and do not necessarily represent the views of the Centers for Disease Control and Prevention.The authors report no conflicts of interest.2009American Cancer Society,Inc.doi:10.3322/caac.20006.Available online at and CA CANCER J CLIN 2009;59:225-249by on September 15, 2010 (©American Cancer Society, Inc.) Downloaded fromTABLE 1.Estimated New Cancer Cases and Deaths by Sex,United States,2009*ESTIMATED NEW CASESESTIMATED DEATHSBOTH SEXESMALEFEMALEBOTH SEXESMALEFEMALEAll Sites1,479,350766,130713,220562,340292,540269,800Oral cavity &pharynx 35,72025,24010,4807,6005,2402,360Tongue 10,5307,4703,0601,9101,240670Mouth 10,7506,4504,3001,8101,110700Pharynx12,61010,0202,5902,2301,640590Other oral cavity 1,8301,3005301,6501,250400Digestive system 275,720150,020125,700135,83076,02059,810Esophagus 16,47012,9403,53014,53011,4903,040Stomach21,13012,8208,31010,6206,3204,300Small intestine 6,2303,2402,9901,110580530Colon†106,10052,01054,09049,92025,24024,680Rectum40,87023,58017,290Anus,anal canal,&anorectum 5,2902,1003,190710260450Liver &intrahepatic bile duct 22,62016,4106,21018,16012,0906,070Gallbladder &other biliary 9,7604,3205,4403,3701,2502,120Pancreas42,47021,05021,42035,24018,03017,210Other digestive organs 4,7801,5503,2302,1707601,410Respiratory system 236,990129,710107,280163,79092,24071,550Larynx12,2909,9202,3703,6602,900760Lung &bronchus219,440116,090103,350159,39088,90070,490Other respiratory organs 5,2603,7001,560740440300Bones &joints2,5701,4301,1401,470800670Soft tissue (including heart)10,6605,7804,8803,8201,9601,860Skin (excluding basal &squamous)74,61042,92031,69011,5907,6703,920Melanoma-skin68,72039,08029,6408,6505,5503,100Other nonepithelial skin 5,8903,8402,0502,9402,120820Breast194,2801,910192,37040,61044040,170Genital system 282,690201,97080,72056,16028,04028,120Uterine cervix 11,27011,2704,0704,070Uterine corpus 42,16042,1607,7807,780Ovary 21,55021,55014,60014,600Vulva3,5803,580900900Vagina &other genital,female 2,1602,160770770Prostate 192,280192,28027,36027,360Testis8,4008,400380380Penis &other genital,male 1,2901,290300300Urinary system 131,01089,64041,37028,10018,8009,300Urinary bladder70,98052,81018,17014,33010,1804,150Kidney &renal pelvis57,76035,43022,33012,9808,1604,820Ureter &other urinary organs 2,2701,400870790460330Eye &orbit2,3501,2001,150230120110Brain &other nervous system 22,07012,01010,06012,9207,3305,590Endocrine system 39,33011,07028,2602,4701,1001,370Thyroid37,20010,00027,2001,630690940Other endocrine 2,1301,0701,060840410430Lymphoma74,49040,63033,86020,79010,63010,160Hodgkin lymphoma 8,5104,6403,8701,290800490Non-Hodgkin lymphoma 65,98035,99029,99019,5009,8309,670Myeloma 20,58011,6808,90010,5805,6404,940Leukemia44,79025,63019,16021,87012,5909,280Acute lymphocytic leukemia 5,7603,3502,4101,400740660Chronic lymphocytic leukemia 15,4909,2006,2904,3902,6301,760Acute myeloid leukemia 12,8106,9205,8909,0005,1703830Chronic myeloid leukemia 5,0502,9302,120470220250Other leukemia ‡5,6803,2302,4506,6103,8302,780Other &unspecified primary sites‡31,49015,29016,20044,51023,92020,590*Rounded to the nearest 10;estimated new cases exclude basal and squamous cell skin cancers and in situ carcinomas except urinary bladder.About 62,280female carcinoma in situ of the breast and 53,120melanoma in situ will be newly diagnosed in 2009.†Estimated deaths for colon and rectum cancers are combined.‡More deaths than cases may suggest lack of specificity in recording underlying cause of death on death certificates.Source:Estimated new cases are based on 1995-2005incidence rates from 41states and the District of Columbia as reported by the North American Association of Central Cancer Registries (NAACCR),representing about 85%of the US population.Estimated deaths are based on US Mortality Data,1969to 2006,National Center for Health Statistics,Centers for Disease Control and Prevention,2009.Cancer Statistics 2009by on September 15, 2010 (©American Cancer Society, Inc.) Downloaded fromTABLE 2.Age-standardized Incidence Rates for All Cancers Combined,2001-2005,and Estimated New Cases*for SelectedCancers by State,United States,2009STATE INCIDENCE RATE†ALL CASESFEMALE BREAST UTERINE CERVIX COLON&RECTUMUTERINE CORPUSLEUKEMIALUNG &BRONCHUSMELANOMA OF THE SKINNON-HODGKIN LYMPHOMA PROSTATE URINARY BLADDERAlabama 449.224,0902,9701902,4805105904,0409309502,800960Alaska 466.12,530370‡250707035080110360120Arizona 416.827,6003,4702102,6806608103,9601,4601,2503,5301,460Arkansas 455.414,8001,8201301,5403104202,5805006802,140610California 446.2152,17021,7401,35014,6804,2304,57017,9109,0807,14020,7906,870Colorado 447.120,3402,8401501,8605307202,2401,2609203,070940Connecticut 508.320,6502,7901101,9506605402,7201,2609202,4001,120Delaware507.34,690600‡440140120800220190550220Dist.of Columbia §2,600340‡2608050370709038090Florida 470.3102,21012,65080010,4202,5903,18017,7904,9204,64012,3805,490Georgia 465.539,0805,3703403,7509301,0806,1502,0401,5605,2101,400Hawaii 426.86,40087050710200160740320260860220Idaho 462.26,800810‡6301702508203803301,170340Illinois 487.460,9607,6104806,4301,9601,9409,1802,0102,9007,5903,100Indiana 469.531,3203,7102203,2609709305,3601,1701,4203,2501,550Iowa 481.016,7402,080901,8005005902,6209107502,330870Kansas §13,0801,790901,2904003802,1106106001,970620Kentucky 512.824,0602,8401802,6205906904,6501,2609802,9101,070Louisiana 497.722,1702,7001902,3304306603,6506309603,160910Maine 527.29,0001,080508702702701,3904803601,130500Maryland §26,6503,6601902,6208406404,0601,3101,1203,5801,110Massachusetts 514.936,0804,8002003,3801,1401,0005,1202,0301,6104,2002,010Michigan 509.153,5506,4803205,0201,7001,6908,1902,2402,4707,0102,810Minnesota 481.023,6703,2801402,5208108903,3108901,1304,9101,200Mississippi §14,1501,8201301,4802703602,3403805401,990540Missouri 467.730,0903,8802203,1008708805,6001,2601,2503,6201,450Montana 477.65,340640‡520140170730220240810270Nebraska 474.48,8101,200609502702901,2304204001,410450Nevada471.712,0201,3501101,2402703801,9104804801,660630New Hampshire 507.07,6301,010‡7302402101,100460310910420New Jersey 515.747,9206,4404104,5901,6201,3806,2502,5302,1606,0602,640New Mexico 421.08,8301,090808102103109704603601,400350New York 489.1101,55013,5308709,9703,5103,14013,5503,7104,54012,5205,360North Carolina §42,2705,4703404,2301,0301,1506,6702,1901,7306,1301,790North Dakota 458.73,200410‡35090110420110140560180Ohio §62,4207,3403906,0601,9301,95010,6902,0802,8006,5102,990Oklahoma 466.418,1102,3401401,8604005803,2206908202,190770Oregon 472.819,2102,6801101,7805704902,6101,2209102,5101,020Pennsylvania 503.674,1709,3805007,5902,5502,20010,4803,4403,3308,1304,160Rhode Island 514.56,250810‡590190180900340260650370South Carolina 475.222,1002,8201702,1505205903,6801,0908702,910880South Dakota 474.54,120530‡440120140590180180740230Tennessee §32,5703,9702403,4907201,0005,3701,4101,3704,7901,380Texas 454.998,20013,0909809,8002,2203,47014,1503,8204,53013,1303,720Utah 411.88,8801,080607702503306206004401,570360Vermont §3,550480‡330120100500200140540190Virginia 440.334,1504,8502403,3801,0208405,3301,7901,4504,8301,430Washington 499.032,2904,5201902,8909609904,1301,9701,5404,6801,660West Virginia 490.510,2301,180701,0703302902,0304504201,210510Wisconsin §27,5603,4801602,7701,0009803,9601,0401,3102,7701,530Wyoming447.92,500300‡2407070320130110390130United States 476.61,479,350192,37011,270146,97042,16044,790219,44068,72065,980192,28070,980*Rounded to the nearest 10;excludes basal and squamous cell skin cancers and in situ carcinomas except urinary bladder.†Rates are per 100,000and age adjusted to the 2000US standard population.‡Estimate is fewer than 50cases.§Combined incidence rate is not available.Note:These model-based estimates are calculated by using incidence rates from 41states and the District of Columbia as reported by NAACCR.They are offered as a rough guide and should be interpreted with caution.State estimates may not add to the US total because of rounding and exclusion of states with fewer than 50cases.Source:North American Association of Central Cancer Registries (NAACCR),based on data collected by cancer registries participating in NCI’s SEER Program and CDC’s National Program of Cancer Registries.Rates for Alabama,Louisiana,Mississippi,and Texas are for cases diagnosed through June 2005.CA CANCER J CLIN 2009;59:225-249by on September 15, 2010 (©American Cancer Society, Inc.) Downloaded from(SEER)program of the National Cancer Institute,cov-ering about 26%of the US population.2,3,4,5Incidence data (1995-2005)for projecting new cancer cases were obtained from cancer registries that participate in the SEER program or the Center for Disease Control (CDC)’s National Program of Cancer Registries (NPCR),through the North American Association of Central Cancer Registries (NAACCR).State-specific incidence rates were obtained from NAACCR based on data collected by cancer registries participating in the SEER program and NPCR.Population data were obtained from the US Census Bureau.7Causes of death were coded and classified according to the International Classification of Diseases (ICD-8,ICD-9,and ICD-10).8,9,10Cancer cases were classi-fied according to the International Classification of Diseases for Oncology .11Estimated New Cancer CasesThe precise number of cancer cases diagnosed each year in the nation and in every state is unknown because cancer registration is incomplete in some states.Fur-thermore,the most recent year for which incidence and mortality data are available lags 3-4years behind the current year because of the time required for data col-lection and compilation.Estimated new cancer cases in the current year (2009)were projected by using a spa-tiotemporal model 12on the basis of incidence data fromEstimated DeathsEstimated New Cases*Prostat e192,280 25%Lung & bronchus 116,090 15% Colon & rectum 75,590 10% Urinary bladd er 52,810 7% Melanoma of the skin 39,080 5% Non-Hodgkin lymphoma 35,990 5%Kidney & renal pelvis 35,430 5%%3036,52ai m e k u e LOral cavity & pharynx25,240 3%%3050,12s a e r c n a P %001031,667se t i S l l A Lung & bronchus88,900 30%%9063,72et a t s o r PColon & rectum25,240 9%%6030,81s a e r c n a P %4095,21ai m e k u e LLiver & intrahepatic bile duct 12,090 4%Esophagus 11,490 4% Urinary bladd e r 10,180 3%Non-Hodgkin lymphoma 9,830 3%Kidney & renal pelvis8,160 3%%001045,292se t i S l l A %72073,291ts a e r B Lung & bronchus 103,350 14%%01083,17m u t c e r &n o l o C %6061,24su p r o c e n i r e t U Non-Hodgkin lymphoma 29,990 4%Melanoma of the skin 29,640 4%%4002,72di o r y h T Kidney & renal pelvis 22,330 3%%3055,12y r a v O %3024,12s a e r c n a P %001022,317se t i S l l A %62094,07s u h c n o r b &g n u L %51071,04t s a e r B %9086,42m u t c e r &n o l o C %6012,71s a e r c n a P %5006,41yr a v O Non-Hodgkin lymphoma 9,670 4%%3082,9a i m e k u e L %3087,7su p r o C e n i r e t U Liver & intrahepatic bile duct 6,070 2%Brain & other nervous system 5,590 2%%001008,962se t i S l l A FIGURE 1.Ten Leading Cancer Types for Estimated New Cancer Cases and Deaths,by Sex,United States,2009.*Excludes basal and squamous cell skin cancers and in situ carcinoma except urinary bladder.Estimates are rounded to the nearest 10.Cancer Statistics 2009by on September 15, 2010 (©American Cancer Society, Inc.) Downloaded fromTABLE 3.Age-standardized Death Rates for All Cancers Combined,2001-2005,and Estimated Deaths*for SelectedCancers by State,United States,2009STATEDEATH RATE †ALL SITES BRAIN &OTHER NERVOUS SYSTEMFEMALE BREAST COLON &RECTUMLEUKEMIA LIVERLUNG &BRONCHUS NON-HODGKIN LYMPHOMAOVARY PANCREAS PROSTATEAlabama 206.29,9002007009403402803,140290270550510Alaska 186.5830‡6070‡‡220‡‡50‡Arizona 167.510,2602807409704103602,820350*********Arkansas 207.36,2301304105802501902,160200130400340California 173.154,6001,4604,0304,8302,2002,45012,7501,9001,5803,7402,780Colorado 166.46,7402005206703002101,670230210430350Connecticut 184.36,9901504805502702101,810220180540390Delaware204.31,86050110150705059050‡11090Dist.of Columbia 209.5970‡7010050‡240‡‡6060Florida 180.141,2708102,7303,4601,6501,30012,2101,5609702,4702,280Georgia 194.214,9703201,1301,3705504004,660460400870800Hawaii 152.22,270‡140210801205708050170100Idaho 173.42,45090160200120806308050200160Illinois 197.623,2204701,7702,2609507006,4607706001,5601,150Indiana 205.112,8202908601,1305203504,000420340770520Iowa 185.96,3601604006003001501,760280170380330Kansas 187.05,2901503705102001401,620180*********Kentucky 222.79,4101505908403202403,430300210500390Louisiana 221.08,8102106909103103302,700310210530450Maine 206.83,19080180260110809809070200160Maryland 196.610,3202008109403903202,880300260690550Massachusetts 193.413,1402708701,0704904203,610430350880540Michigan 195.320,4504901,3501,7208206105,8407105201,250820Minnesota 178.89,0202306007603702602,380320240580410Mississippi 211.96,0901604306002201902,030180140350300Missouri 201.912,6202708901,1005303604,100430290750660Montana 186.61,9805012017090505507050120120Nebraska 179.63,360802103501508089013090190200Nevada197.14,6001203305001401601,340130120280230New Hampshire 193.02,62070170220100707506060170130New Jersey 193.416,4803201,4701,5806105404,1906104501,080660New Mexico 167.33,3008024032012015071011090220210New York 179.934,1907902,5503,1101,3801,2108,7801,4309702,3601,470North Carolina 196.118,5503301,3101,4106404705,6305304301,090860North Dakota 176.31,300‡8012050‡370‡‡90100Ohio 204.124,3505501,7902,2108906407,3007405801,4301,200Oklahoma 200.17,4201705206002902002,390240170380280Oregon 192.07,3802105006102902102,140330220470390Pennsylvania 198.528,6905502,0702,5501,0807908,0901,0907601,9201,440Rhode Island 194.72,2205013016090705607060120100South Carolina 200.79,1001906407803302502,880310210530420South Dakota 182.81,640‡10015060‡4507050100100Tennessee 211.213,3403509101,1404803504,520440*********Texas 184.936,0308502,5703,1401,4301,6509,7801,3008902,1201,700Utah 140.92,7601002602401307048013090190170Vermont 183.61,150‡8012060‡350‡‡7060Virginia 194.713,9202901,1401,2705003904,250410380880620Washington 187.111,2103807909404504103,090410340710680West Virginia 213.44,530902804301401101,500180*********Wisconsin 186.711,1702607509005003202,910400300710500Wyoming180.0990‡60100‡‡260‡‡60‡United States 189.8562,34012,92040,17049,92021,87018,160159,39019,50014,60035,24027,360*Rounded to the nearest 10.†Rates are per 100,000and age adjusted to the 2000US standard population.‡Estimate is fewer than 50deaths.Note:State estimates may not add to US total due to rounding and exclusion of states with fewer than 50deaths.Source:US Mortality Data,1969to 2006,National Center for Health Statistics,Centers for Disease Control and Prevention,2009.CA CANCER J CLIN 2009;59:225-249by on September 15, 2010 (©American Cancer Society, Inc.) Downloaded fromTABLE 4.Cancer Incidence Rates*by Site and State,United States,2001-2005STATEALL SITESBREAST COLON AND RECTUM LUNG AND BRONCHUS NON-HODGKIN LYMPHOMA PROSTATE URINARY BLADDER MALEFEMALEFEMALEMALEFEMALEMALEFEMALEMALEFEMALEMALEMALEFEMALEAlabama†555.6377.6114.262.241.9109.552.520.514.0150.731.17.7Alaska†533.2410.6127.961.346.082.462.823.516.1151.339.47.2Arizona 461.7363.0109.849.436.369.848.818.613.2116.635.08.7Arkansas†558.2381.5114.059.243.6113.459.021.915.1158.133.18.9California†518.2396.4124.753.839.867.047.522.615.5152.634.48.3Colorado†512.7401.7125.951.541.063.046.021.416.3159.435.09.1Connecticut†589.5454.3137.465.247.982.558.825.517.8166.644.612.5Delaware†601.7438.6126.462.646.497.866.222.516.7175.542.411.0Dist.of Columbia‡————————————Florida†549.3410.1116.757.743.491.460.821.915.5143.138.710.0Georgia†571.3395.2120.660.142.6104.153.420.614.2163.633.08.1Hawaii†484.9385.9126.062.442.567.838.918.912.7129.325.1 6.2Idaho†543.5399.0118.252.038.569.646.721.517.2168.838.48.5Illinois†580.1426.8124.168.048.593.157.823.816.3159.540.810.4Indiana†552.3414.9117.764.647.3105.362.222.616.0136.937.29.3Iowa†560.9428.3125.467.250.589.352.423.517.0147.340.69.8Kansas‡————————————Kentucky†612.5447.1120.570.351.4136.276.222.416.9144.438.19.8Louisiana†624.9409.5120.970.148.3111.358.222.916.2180.235.68.7Maine†621.6460.6130.667.749.199.865.724.518.6166.848.712.9Maryland‡————————————Massachusetts†604.0455.9133.867.648.486.063.024.117.1170.246.512.9Michigan†608.0440.2127.061.045.794.361.325.018.5186.442.510.7Minnesota†568.8418.6129.357.943.171.449.226.418.1185.940.010.5Mississippi (2002-2005)555.6365.5105.862.945.2110.150.919.913.0161.928.37.4Missouri†545.3414.6123.064.746.1105.461.821.815.9131.536.29.2Montana†561.2412.3122.655.441.578.257.923.215.0182.441.99.3Nebraska†557.0417.9127.868.548.084.548.824.016.9157.337.810.0Nevada†539.9415.8116.056.943.184.369.521.915.0148.743.011.2New Hampshire†586.7451.9132.361.746.982.361.524.418.1162.747.913.5New Jersey†612.5451.5129.868.350.080.956.025.917.7183.946.012.2New Mexico†490.7367.7111.750.835.459.138.518.414.0149.328.07.0New York†575.7432.7124.663.447.280.553.724.316.9165.942.111.2North Carolina‡————————————North Dakota†543.8396.7122.568.344.174.947.122.615.3170.836.79.9Ohio543.8413.6121.962.745.897.258.922.816.2145.638.79.7Oklahoma†551.3409.2126.461.243.9107.463.822.316.2147.033.88.1Oregon†533.4430.0134.754.441.779.960.424.117.5151.440.310.4Pennsylvania†593.9444.0125.768.449.691.655.724.817.3161.444.611.3Rhode Island†616.7446.9127.567.846.894.559.525.016.7161.651.612.9South Carolina†589.6395.2119.263.544.9103.852.320.614.5172.332.67.7South Dakota†568.5406.0125.563.846.780.345.022.417.4183.039.78.3Tennessee§496.9377.4115.357.742.2105.056.419.414.2120.331.57.8Texas†546.5390.9116.359.540.590.451.222.216.1146.630.27.4Utah†493.1348.2112.946.334.139.622.422.915.8185.029.1 6.4Vermont‡————————————Virginia515.6376.4119.556.742.386.151.919.613.1154.132.18.3Washington†571.2447.7138.954.641.480.560.026.918.4167.741.610.4West Virginia†576.0433.6115.370.651.7117.069.422.316.0139.440.011.4Wisconsin‡————————————Wyoming†515.5394.8117.949.443.662.647.220.616.3171.241.59.5United States 562.3417.3123.661.244.887.355.423.216.3158.238.49.8*Per 100,000,age adjusted to the 2000US standard population.†This state’s registry has submitted 5years of data and passed rigorous criteria for each single year’s data,including completeness of reporting,nonduplication of records,percentage unknown in critical data fields,percentage of cases registered with information from death certificates only,and internal consistency among data items.‡This state’s registry did not submit incidence data to the North American Association of Central Cancer Registries for 2001-2005.§Case ascertainment for this state’s registry is incomplete for the years 2001-2005.Source :North American Association of Central Cancer Registries,based on data collected by cancer registries participating in the National Cancer Institute’s Surveillence,Epidemiology,and End Results program and Centers for Disease Control’s National Program of Cancer Registries.Cancer Statistics 2009by on September 15, 2010 (©American Cancer Society, Inc.) Downloaded from1995through 2005from 41statesand the District of Columbia that met NAACCR’s high-quality data stan-dard for incidence,covering about 85%of the US population.The method also considers geographic vari-ations in sociodemographic and lifestyle factors,medi-cal settings,and cancer-screening behaviors as predic-tors of incidence,and accounts for expected delays in case reporting.Estimated Cancer DeathsWe used the state-space prediction method 13to es-timate the number of cancer deaths expected to occurin the United States and in each state in the year 2009.Projections are based on underlying cause-of-death from death certificates as reported to the NCHS.1This model projects the number of cancer deaths expected to occur in 2009on the basis of the number that occurred each year from 1969to 2006in the United States and in each state separately.Other StatisticsWe provide mortality statistics for the leading causes of death as well as deaths from cancer in the year 2006.Causes of death for 2006were coded andFIGURE 2.Annual Age-adjusted Cancer Incidence and Death Rates for All Sites by Sex,United States,1975-2005.Rates are age adjusted to the 2000US standard population.Incidence rates are adjusted for delays in reporting.Source:Incidence,Surveillance,Epidemiology,and End Results (SEER)program ().Delay-adjusted incidence database,SEER incidence delay-adjusted rates from nine registries,1975to 2005.National Cancer Institute,DCCPS,Surveillance Research Program,Statistical Research and Applications Branch,released in April 2008,based on the November 2007SEER data submission.Mortality,US mortality data,1960to 2005,National Center for Health Statistics,Centers for Disease Control and Prevention,2008.CA CANCER J CLIN 2009;59:225-249by on September 15, 2010 (©American Cancer Society, Inc.) Downloaded fromclassified according toICD-10.8This report also provides updated statistics on trends in cancer inci-dence and mortality rates,the probability of devel-oping cancer,and 5-year relative-survival rates for selected cancer sites based on data from 1975through 2005.3All age-adjusted incidence and death rates are standardized to the 2000US standard pop-ulation and expressed per 100,000population.The long-term incidence rates and trends (1975to 2005)are adjusted for delays in reporting where possi-ble.Delayed reporting primarily affects the most recent 1-3years of incidence data (in this case,2003-2005),especially for cancers such as melanoma,leukemia,and prostate that are frequently diagnosed in outpatient settings.The NCI has developed a method to account for expected reporting delays in SEER registries for all cancer sites combined and many specific cancer sites.14Delay-adjusted rates provide a more accurate assess-ment of trends in the most recent years for which data are available.Long-term incidence and mortality trends (1975-2005)for selected cancer sites were previously published in the 2008Annual Report to the Nation on the Status of Cancer .15We also provide the contribution of individual cancer sites to the total decrease in overall cancer death rates since 1990in men and since 1991in women and estimates of the total number of cancer deaths avoided because of the reduction in overall age-standardized cancer death rates over these time intervals.The total number of cancer deaths avoided was calculated by applying the age-specific cancer death rates in the peak year for the age-standardized cancer death rates (1990for males and 1991for females)to the corresponding age-specific popula-FIGURE 3.Annual Age-adjusted Cancer Incidence Rates among Males and Females for Selected Cancers,United States,1975-2005.Rates are age adjusted to the 2000US standard population and adjusted for delays in reporting.Source:Surveillance,Epidemiology,and End Results (SEER)program ().Delay-adjusted incidence database,SEER Incidence Delay-Adjusted Rates,from nine registries,1975to 2005.National Cancer Institute,DCCPS,Surveillance Research Program,Statistical Research and Applications Branch,released April 2008,based on the November 2007SEER data submission.Cancer Statistics 2009by on September 15, 2010 (©American Cancer Society, Inc.) Downloaded from。
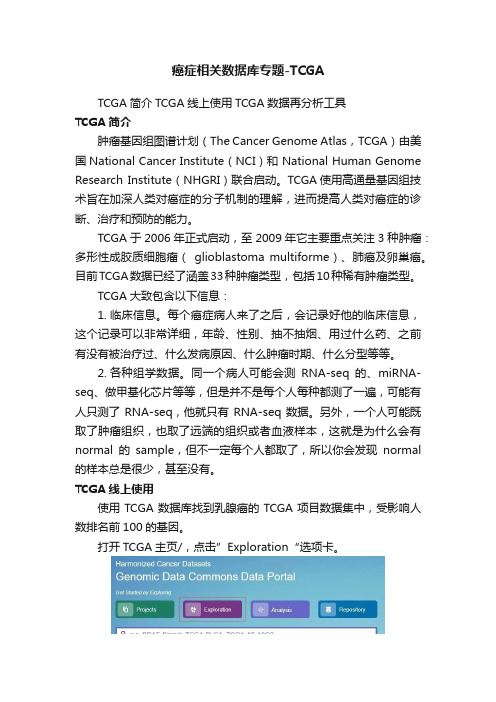
癌症相关数据库专题-TCGATCGA简介TCGA线上使用TCGA数据再分析工具TCGA简介肿瘤基因组图谱计划(The Cancer Genome Atlas,TCGA)由美国National Cancer Institute(NCI)和 National Human Genome Research Institute(NHGRI)联合启动。
TCGA使用高通量基因组技术旨在加深人类对癌症的分子机制的理解,进而提高人类对癌症的诊断、治疗和预防的能力。
TCGA于2006年正式启动,至2009年它主要重点关注3种肿瘤:多形性成胶质细胞瘤(glioblastoma multiforme)、肺癌及卵巢癌。
目前TCGA数据已经了涵盖33种肿瘤类型,包括10种稀有肿瘤类型。
TCGA大致包含以下信息:1.临床信息。
每个癌症病人来了之后,会记录好他的临床信息,这个记录可以非常详细,年龄、性别、抽不抽烟、用过什么药、之前有没有被治疗过、什么发病原因、什么肿瘤时期、什么分型等等。
2.各种组学数据。
同一个病人可能会测RNA-seq的、miRNA-seq、做甲基化芯片等等,但是并不是每个人每种都测了一遍,可能有人只测了RNA-seq,他就只有RNA-seq数据。
另外,一个人可能既取了肿瘤组织,也取了远端的组织或者血液样本,这就是为什么会有normal的sample,但不一定每个人都取了,所以你会发现normal 的样本总是很少,甚至没有。
TCGA线上使用使用TCGA数据库找到乳腺癌的TCGA项目数据集中,受影响人数排名前100的基因。
打开TCGA主页/,点击”Exploration“选项卡。
在打开页面的左边Cases选项卡中,分别选择Primary site:Breast,Project:TCGA-BRCA。
Disease Type中只有一个亚型,可不选。
在此时的页面右侧,点击Genes,接着点击右下角Save/Edit Gene Set即可保存基因列表。

有关肿瘤表观遗传的又一重磅数据库!快来看看本期直播主题:在中国当医生真的很累吗?什么样的人适合学医点击预约按钮,领开播好礼!解螺旋公众号·陪伴你科研的第2651天超重磅数据库在癌症阶段的转变过程中,主调控子(master regulator,MR)是指通过协调相关的靶基因来控制癌症发生和发展的关键基因。
由于其固有的重要性,MR可以作为癌症诊断和预后的重要生物标志物和治疗靶点。
开发一个简单易用的识别工具就显得尤为重要了。
来自香港大学的开发者就做了这件事情,开发了MR4Cancer数据库。
MR4Cancer数据库(/MR4Cancer)的开发者来自香港大学生物科学学院,数据库相关文章(PMID: 30052770)于2019年2月发表在Bioinformatics杂志(2019IF=5.612)上。
截至2021-05-24该数据库相关文章已引用2次(数据来源:PubMed)。
我们可以看到在MR4Cancer数据库选择相应的癌种之后,可以根据用户的需求输入两种数据——基因列表或者基因表达矩阵。
基因列表我们以GBM胶质母细胞瘤为例依次来进行查看。
提交之后会得到一个Job ID,用于查看结果。
结果部分主要包括五部分(最上方的Job ID就是我们之前获得的ID)。
1总结主要由输入部分和输出部分两部分组成。
输入部分显示了选择的癌种(GBM)和输入的139个基因名,点击后面的“Details”可以查看具体的基因。
输出部分根据校正后的P值<0.05为阈值统计了所以的上调的MR 及其GO和通路富集的结果。
2MR数据主要分为转录调控、非转录调控、miRNA、复发突变基因、ChIP-Seq 转录因子、PWM转录因子、信号蛋白和PPI-Hub八大类,每个大类后面括号内的数字表示该类的结果数目,单击可进行展开查看。
每个大类下的条目大同小异,都含有编号、MR、与输入基因的重叠数目、转录子数目、P值、调整后的P值等信息。

中国知识资源总库——CNKI 系列数据库一.中国知识资源总库——CNKI 系列数据库简介1.CNKI的发展历程CNKI是以实现全社会知识信息资源传播共享和增值利用为目标的国家信息化重点工程,被国家科技部等五部委确定为“国家级重点新产品重中之重”项目。
国家知识基础设施(National Knowledge Infrastructure)的概念,由世界银行提出于1998年。
CNKI 即是中国知识基础设施工程(China National Knowledge Infrastructure)。
CNKI 由中国学术期刊(光盘版)电子杂志社、清华同方知网(北京)技术有限公司主办,是基于《中国知识资源总库》的全球最大的中文知识门户网站,具有知识的整合、集散、出版和传播功能。
CNKI 亦可解读为“中国知网”(China National Knowledge Internet )的英文简称。
CNKI工程于1995年正式立项,在政府及社会各界多方努力下,经过10年建成了世界上全文信息量规模最大的“CNKI数字图书馆”。
《中国知识资源总库》(简称《总库》)是中国知网的核心资源,是由杨振宁先生担任顾问委员会名誉主任,众多院士、科学家、专家学者参与策划、编纂的我国知识信息资源的大规模集成体。
目前,中国知网已实现了国内25% 的知识资源的数字化和网络化共享。
基于《总库》丰富资源的中国知网,不是一般的新闻网站或综合信息网站,而是信息量远远大于现有互联网信息资源的,真正能够满足人们知识需求的知识门户网站。
CNKI 是全球信息量最大、最具价值的中文网站。
据统计,CNKI 网站的内容数量大于目前全世界所有中文网页内容的数量总和,可谓世界第一中文网。
CNKI 的信息内容是经过深度加工、编辑、整合、以数据库形式进行有序管理的,内容有明确的来源、出处,内容可信可靠,比如期刊杂志、报纸、博士硕士论文、会议论文、图书、专利等等。
因此,CNKI 的内容有极高的文献收藏价值和使用价值,可以作为学术研究、科学决策的依据。

---------------------------------------------------------------最新资料推荐------------------------------------------------------收藏级资源肿瘤数据库汇总收藏级资源|肿瘤数据库汇总现如今,随着人们生活方式和环境的改变,恶性肿瘤已经成为疾病死亡病因之一。
肿瘤在全球呈现发病率增高,以及发病年龄年轻化的趋势。
2019 年,A Cancer Journal For Clinicians 杂志发布了最新的数据。
该报告估计,2019 年美国将有 1,762,450 例新的癌症病例和606,888 例与癌症相关的死亡。
传统化疗是对抗癌症的常见方法,但它会攻击全身,造成不必要的副作用,如脱发,恶心和疲劳。
靶向治疗选择性地杀死癌细胞而不影响健康组织。
靶向药物开发将成为治疗癌症的重要手段。
图 1 肿瘤靶向治疗高通量检测技术迅速发展,使得与肿瘤相关的组学数据迅速积累。
这些数据对于研究肿瘤的发生发展机制具有重要意义。
对数据的挖掘能够确定许多与疾病有关的基因,为治疗和发病机制的研究提供新的思路。
如何有效利用和存储这些信息就显得尤为重要。
肿瘤的生物信息学数据库的建立提供了有效的解决方案,对肿瘤基础研究的发展、临床治疗水平的提高具有极大的推动作用。
以下是一些肿瘤相关的数据库分类和大致的信息。
1/ 311. 综合性肿瘤数据库2. 肿瘤基因组数据库3. 肿瘤 DNA 甲基化数据库4. 肿瘤转录组数据库5. 肿瘤蛋白组数据库---------------------------------------------------------------最新资料推荐------------------------------------------------------ 6. 肿瘤相关基因的数据库 7. 肿瘤与药物数据库 1. 综合性肿瘤数据库综合肿瘤数据库汇总如表 1 所示。
一些免费的文献资源大全(来源可靠)大全, 资源, 文献相关词条:大全, 资源, 文献我也想创建词条赚积分一、综合性资源1.CALIS重点学科网络资源导航门户:http://202.117.24.168/cm/main.jsp2.中国高校人文社科文献中心(CASHL) /search/default.asp :高校人文社科类外文期刊、图书等目录检索,国外人文社科核心期刊总览等。
3.国家科技文献中心/:可检索期刊、学位论文、会议文献、科技报告、标准、专利等文献信息。
4.中科院全国期刊联合目录http://159.226.100.141/Union/ :全国期刊联合目录查询5.中国科学院科学数据库/ :多种专业数据库6.中国科学院国家科学图书馆/ :文献、期刊、学科门户等多种信息的汇集7.211工程镜像资源:/jingxiang.htm8.中国精品课程导航:/cn/jpkc/index_un.html9.中国学术网(人文社科版)/10. Dialog 免费数据库/openaccess/ :由Dialog 提供的多个学科的免费检索及目次浏览服务11. INFOMINE 学术资源/ : 汇集了大量供高校及研究人员使用的各学科、各种文献类型的Internet 资源,可看到文摘。
12. Ingentaconnect: . 全球性学术研究的大型网关,收集有25,000种出版物的摘要和4,500种出版物全文,全文需付费。
来源:/old/zydh/wldh1.htm淘宝网购物赚取论坛币相关主题:人力资源各模块操作流程大全(PPT 33页)应聘面试大全职位说明书大全2010年注会——财务管理公式大全学车资料大全(全套模拟题!)华为笔试大全(转载)中国气功功法大全移动平均线操作大全2010年企业战略策划大全(1744页)兼职常用网站,兼职网站大全(2010版)收藏分享评分回复引用订阅TOPhattbuy 发短消息加为好友hattbuy 当前离线UID835019 帖子104 精华0 积分104 阅读权限20 在线时间63 小时注册时间2008-12-28 最后登录2010-6-2本科生帖子104 精华0 经验1108 点威望0 级论坛币367 个学术水平0 点热心指数0 点信用等级0 点在线时间63 小时注册时间2008-12-28 2楼发表于2009-11-25 15:05 | 加为好友| 发短消息| 只看该作者二、开放存取资源中国的:1.中国预印本服务系统:/eprint/index.jsp 用户在注册后可自由提交、检索、浏览预印本文章全文、发表评论等。
可能是最全的单细胞数据库汇总(2023更新版本)1.Jingle Bells: Jingle Bells(铃儿响叮当)这首歌恐怕是最为人们熟悉的圣诞歌曲,此处被用于数据库名称。
该数据库是一个用于从单细胞水平可视化分析RNA-Seq数据的标准化单细胞数据集库,根据文献研究对象将单细胞数据划分为免疫和非免疫类。
2.CancerSEA: CancerSEA是第一个旨在以单细胞水平全面解码肿瘤细胞不同功能状态的数据库,用途包括:①提供肿瘤单细胞功能状态图谱,涉及25种肿瘤类型的41900个肿瘤单细胞的14种功能状态;②查询基因(包括PCG 和 lncRNA)或感兴趣的基因列表与不同肿瘤类型相关的功能状态;③以单细胞分辨率提供与功能状态高度相关的pCG/lncRNA库。
14种肿瘤相关功能状态可以当作14种表型,包括细胞干性、侵袭、转移、增殖、EMT、血管生成、凋亡、细胞周期、分化、DNA 损伤、 DNA 修复、缺氧、炎症和静止。
通过表征每个肿瘤细胞的这些功能状态活动,CancerSEA提供了肿瘤单细胞功能状态的图谱,并将蛋白编码基因、PCG和lncRNA与单细胞水平的这些功能状态相关联,以促进对肿瘤机制的理解。
3.DISCO: DISCO整合了来自4593个样本的超过1800万个细胞,涵盖107个组织、细胞系或类器官、158种疾病和20个平台,数据以模块化形式呈现。
该数据库提供了三种在线工具,即Online FastIntegration、OnlineCELLiD和CellMapper,用于单细胞RNA-seq数据的集成、注释和投影到选定的图集中。
4.PanglaoDB: PanglaoDB是一个面向对探索小鼠和人类单细胞RNA测序结果分析的单细胞转录组数据库。
其中包含超过1000个单细胞实验的预处理和预分析结果,涵盖大多数单细胞平台数据的分析流程,基于来自各种组织和器官超过400万个细胞。
同时包含6000多个marker基因,是一个主要用于细胞分群注释的marker数据库。
收藏级资源|肿瘤数据库汇总现如今,随着人们生活方式和环境的改变,恶性肿瘤已经成为疾病死亡病因之一。
肿瘤在全球呈现发病率增高,以及发病年龄年轻化的趋势。
2019年,A Cancer Journal For Clinicians杂志发布了最新的数据。
该报告估计,2019年美国将有1,762,450例新的癌症病例和606,888例与癌症相关的死亡。
传统化疗是对抗癌症的常见方法,但它会攻击全身,造成不必要的副作用,如脱发,恶心和疲劳。
靶向治疗选择性地杀死癌细胞而不影响健康组织。
靶向药物开发将成为治疗癌症的重要手段。
图1 肿瘤靶向治疗高通量检测技术迅速发展,使得与肿瘤相关的组学数据迅速积累。
这些数据对于研究肿瘤的发生发展机制具有重要意义。
对数据的挖掘能够确定许多与疾病有关的基因,为治疗和发病机制的研究提供新的思路。
如何有效利用和存储这些信息就显得尤为重要。
肿瘤的生物信息学数据库的建立提供了有效的解决方案,对肿瘤基础研究的发展、临床治疗水平的提高具有极大的推动作用。
以下是一些肿瘤相关的数据库分类和大致的信息。
1. 综合性肿瘤数据库2. 肿瘤基因组数据库3. 肿瘤DNA甲基化数据库4. 肿瘤转录组数据库5. 肿瘤蛋白组数据库6. 肿瘤相关基因的数据库7. 肿瘤与药物数据库1. 综合性肿瘤数据库综合肿瘤数据库汇总如表1所示。
表1综合性肿瘤数据库以下是对数据库的简要概述1.1 canEvolve[1]canEvolve存储的信息包括:基因、microRNA (miRNA)和蛋白质表达谱、多种癌症类型的拷贝数变化(CNAs)以及蛋白质-蛋白质相互作用信息。
1.2 cBioPortal for Cancer Genomics (cBioPortal)[2]cBioPortal for Cancer Genomics是一个癌症基因组数据探索、可视化及分析平台,可用于多个癌症基因组学数据集的交互式探索。
该数据库可提供CNA、基因突变信息。
针对每个基因,它可给出多个信息,主要包括:基因的CAN信息、基因突变在样本中的分布、突变位点和频率、共表达基因以及生存曲线等。
对于用户提供的基因列表,还可生成互作网络并提供已知的相互作用的药物。
cBioPortal在发现肿瘤相关突变、分析基因的生物学功能以及药物选择等方面的研究中具有重要推进作用。
图2 cBioPortal数据库的主页1.3 Cancer Genome Anatomy Project (CGAP)[3]CGAP主要提供了cDNA克隆、文库、基因表达、SNP以及基因组变异等信息。
CGAP收集的数据包括正常组织、前癌组织以及癌细胞的基因表达水平。
图3 CGAP的主页1.4 Cancer Genomics Hub (CGHub)[4]CGHub是美国癌症研究所(NCI)测序项目的在线存储库,其数据来源包括癌症基因组图谱(TCGA)、癌症细胞系百科全书(CCLE)和产生有效治疗(目标)项目的治疗应用研究(TARGET)3个癌症协会项目,数据来自25种不同类型的癌症。
1.5 Cancer Genome Work Bench (CGWB)[5]CGWB提供了一系列工具来挖掘、整合以及可视化TCGA等数据库中的基因组和临床数据,它是第一个将临床肿瘤突变谱与参考人类基因组整合在一起的计算平台。
用户可快速地比较患者临床信息与基因组的变异及甲基化等。
1.6 Catalogue of Somatic Mutations in Cancer (COSMIC)[6]COSMIC是世界上最大最全面的有关肿瘤的体细胞突变以及其影响的资源库。
它主要提供多种肿瘤细胞基因组中的CNA、甲基化、基因融合、SNP及基因表达等信息。
这些突变信息是从科学文献中手工整理的。
图4 COSMIC的主页1.7 International Cancer Genome Consortium (ICGC)[7]ICGC的目标是获取包括胆道癌、膀胱癌、血癌等多达50种肿瘤及其亚型的基因组、转录组和表观遗传的全部信息。
这些数据可促进癌症的机理和治疗研究。
图5 ICGC的主页1.8 The Cancer Genome Atlas (TCGA)[8]TCGA是由美国国立癌症研究所(NCI)和人类基因组研究所资助,关注与癌症的发生和发展相关的分子突变图谱。
该数据库主要对样本进行外显子组和基因组测序分析,所提供的数据包括:基因组拷贝数变化、表观遗传、基因表达谱、miRNA等。
图6 TCGA的主页1.9 UCSC Cancer Genomics Browser[9]UCSC Cancer Genomics Browser是一个可以对癌症基因组学和临床数据进行整合、可视化、分析的网络分析工具。
它保存癌症基因组及临床数据并收集了样本的多种信息,包括基因表达水平、CNA、通路信息等。
在UCSC的癌症基因组浏览器中,可实现不同样本以及癌症类型之间的比较,分析基因组变异与表型之间的相关性。
图7 UCSC癌症基因组浏览器主页2. 肿瘤基因组数据库肿瘤细胞的基因组中都存在着大量的变异,主要包括染色体结构的变异、CNA、基因融合以及SNP等。
拷贝数改变(CNAs)在很大程度上有助于癌症发病机制和进展。
肿瘤基因组数据库汇总如表2所示。
表2肿瘤基因组数据库Datebase DescriptionarrayMap Reference resource for genomic copy number imbalances BioMuta Integrated sequence feature databaseCanGEM Cancer GEnome MineCasSNP Copy number alterations of cancer genome from SNParray dataCGP Cancer Genome Project2.1 ArrayMap[10]ArrayMap提供预处理过的肿瘤基因组芯片数据以及CNA图谱。
在ArrayMap 数据库中,用户可搜索自己感兴趣的样本,并在此基础上分析感兴趣的基因或基因组片段上的CNA;用户还可以比较两个样本之间的CNA的差异。
图8 ArrayMap的主页2.2 BioMuta[11]BioMuta数据库存储了癌症细胞中基因的非同义单核苷酸变异,这些突变会影响基因的正常功能。
BioMuta中的数据来源于COSMIC、ClinVar、UniProtKB 以及一些文献中。
用户可搜索感兴趣的基因,获得该基因在癌细胞中的突变位点及其分布频率。
图9 BioMuta的主页2.3 Cancer GEnome Mine (CanGEM)[12]CanGEM是一个公共的数据库,用于存储定量微阵列数据和临床肿瘤样本数据。
它主要利用ArrayCGH芯片来发掘基因的拷贝数变异。
图10 CanGEM的主页2.4 Cancer Genome Project (CGP)[14]CGP提供了肿瘤中的CNA及基因型信息,该数据库的主要目标是利用人类基因组序列和高通量的突变检测技术识别体细胞突变,进而发现人类肿瘤发生过程中重要的基因。
该数据库还提供了一些识别突变、CNA的软件,如BioView、GRAFT等。
图11 CGP主页3. 肿瘤DNA甲基化数据库DNA甲基化修饰是表观遗传学的一种重要形式,它调节基因的转录水平,对维持细胞的正常功能起着重要作用。
DNA甲基化模式的改变可能导致癌症。
肿瘤DNA甲基化数据库汇总如表3所示。
表3肿瘤DNA甲基化数据库Datebase DescriptionHuman disease methylation databaseDiseaseMethMENT Methylation and expression database of normal and tumortissuesMethDB Common resource for epigenetic phenomenonMethHC DNA methylation and gene expression in human cancerHuman DNA Methylation and CancerMethyCancerNGSmethDBNext-generation sequencing single-cytosine-resolutionDNA methylatio3.1 DiseaseMeth[15]DiseaseMeth是一个人类疾病甲基化数据库,其重点是对各种疾病的DNA 甲基化数据集进行有效的存储和统计分析。
它涉及的疾病包括癌症、神经发育和退行性疾病、自身免疫疾病等。
在DiseaseMeth中可以比较疾病与疾病之间、基因与基因之间以及疾病与基因之间的甲基化关系。
图12 DiseaseMeth的主页3.2 MENT[16]MENT数据库收集和整合了来自Gene Expression Omnibus(GEO)和TCGA的DNA甲基化、基因表达水平数据,同时将DNA甲基化和基因表达水平关联起来。
图13 MENT的主页3.3 MethHCMethHC是一个集成数据库,包含大量DNA甲基化数据和mRNA/microRNA 在人类癌症中的表达谱。
这些数据可以帮助研究人员确定表观遗传模式。
图14 MethHC的数据生成流程[17]3.4 MethyCancer[18]该数据库拥有来自公共资源的高度整合的DNA甲基化数据、癌症相关基因、突变和癌症信息,以及我们大规模测序得到的CpG Island (CGI)克隆。
MethyCancer可用于研究DNA甲基化、基因表达与癌症的相互作用。
图15 MethyCancer的主页除了上述针对癌症基因组甲基化的数据库外,还有一些数据库搜集和整理更为广泛的甲基化数据,如MethDB和NGSmethDB。
MethDB是较早的DNA甲基化数据库,主要集中于环境因子对甲基化的影响;NGSmethDB叫基于高通量测序数据,最近更新中还包含了SNP信息,以便后续分析。
4. 肿瘤转录组数据库肿瘤细胞具有较强的生长和繁殖能力,生命活动旺盛,因此与正常细胞相比,基因的转录水平和模式也存在较大的差异。
表4肿瘤转录组数据库DatebaseDescriptionArrayExpressMicroarray gene expression dataChiTaRS Chimeric transcripts and RNA-sequencing data GEO Gene Expression OmnibusmiRCancer MicroRNA cancer association database Oncomine Cancer microarray databaseOncomiRD B Experimentally verified oncogenic and tumor-suppressive microRNAsSomamiR Somatic mutations impacting microRNA function in cancer4.1 ArrayExpress[19]ArrayExpress是基于微阵列和高通量测序(HTS)的功能基因组实验的主要知识库之一。