Preparation of phase-pure perovskite lead indium niobate ceramics
- 格式:pdf
- 大小:253.86 KB
- 文档页数:3
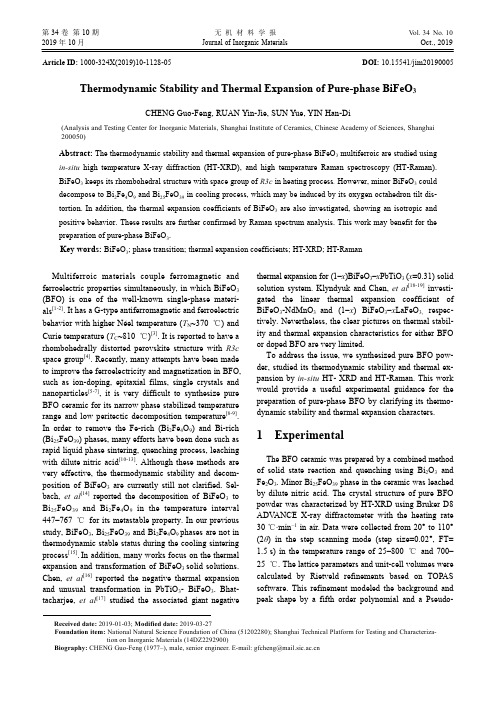
第34卷 第10期 无 机 材 料 学 报Vol. 34No. 102019年10月Journal of Inorganic MaterialsOct., 2019Received date: 2019-01-03; Modified date: 2019-03-27Foundation item: National Natural Science Foundation of China (51202280); Shanghai Technical Platform for Testing and Characteriza-Article ID: 1000-324X(2019)10-1128-05 DOI: 10.15541/jim20190005Thermodynamic Stability and Thermal Expansion of Pure-phase BiFeO 3CHENG Guo-Feng, RUAN Yin-Jie, SUN Yue, YIN Han-Di(Analysis and Testing Center for Inorganic Materials, Shanghai Institute of Ceramics, Chinese Academy of Sciences, Shanghai 200050)Abstract: The thermodynamic stability and thermal expansion of pure-phase BiFeO 3 multiferroic are studied usingin-situ high temperature X-ray diffraction (HT-XRD), and high temperature Raman spectroscopy (HT-Raman). BiFeO 3 keeps its rhombohedral structure with space group of R3c in heating process . However, minor BiFeO 3 could decompose to Bi 2Fe 4O 9 and Bi 25FeO 39 in cooling process, which may be induced by its oxygen octahedron tilt dis-tortion. In addition, the thermal expansion coefficients of BiFeO 3 are also investigated, showing an isotropic and positive behavior. These results are further confirmed by Raman spectrum analysis. This work may benefit for the preparation of pure-phase BiFeO 3.Key words: BiFeO 3; phase transition; thermal expansion coefficients; HT-XRD; HT-Raman Multiferroic materials couple ferromagnetic and ferroelectric properties simultaneously, in which BiFeO 3 (BFO) is one of the well-known single-phase materi-als [1-2]. It has a G-type antiferromagnetic and ferroelectric behavior with higher Néel temperature (T N ~370 ℃) and Curie temperature (T C ~810 ℃)[3]. It is reported to have a rhombohedrally distorted perovskite structure with R3c space group [4]. Recently, many attempts have been made to improve the ferroelectricity and magnetization in BFO, such as ion-doping, epitaxial films, single crystals and nanoparticles [5-7], it is very difficult to synthesize pure BFO ceramic for its narrow phase stabilized temperature range and low peritectic decomposition temperature [8-9]. In order to remove the Fe-rich (Bi 2Fe 4O 9) and Bi-rich (Bi 25FeO 39) phases, many efforts have been done such as rapid liquid phase sintering, quenching process, leaching with dilute nitric acid [10-13]. Although these methods are very effective, the thermodynamic stability and decom-position of BiFeO 3 are currently still not clarified. Sel-bach, et al [14] reported the decomposition of BiFeO 3 to Bi 25FeO 39 and Bi 2Fe 4O 9 in the temperature interval 447–767 ℃ for its metastable property. In our previous study, BiFeO 3, Bi 25FeO 39 and Bi 2Fe 4O 9 phases are not in thermodynamic stable status during the cooling sintering process [15]. In addition, many works focus on the thermal expansion and transformation of BiFeO 3 solid solutions. Chen, et al [16] reported the negative thermal expansion and unusual transformation in PbTiO 3- BiFeO 3. Bhat-tacharjee, et al [17] studied the associated giant negativethermal expansion for (1–x )BiFeO 3–x PbTiO 3 (x =0.31) solid solution system. Klyndyuk and Chen, et al [18-19] investi-gated the linear thermal expansion coefficient of BiFeO 3-NdMnO 3 and (1–x ) BiFeO 3–x LaFeO 3, respec-tively. Nevertheless, the clear pictures on thermal stabil-ity and thermal expansion characteristics for either BFO or doped BFO are very limited.To address the issue, we synthesized pure BFO pow-der, studied its thermodynamic stability and thermal ex-pansion by in-situ HT- XRD and HT-Raman. This work would provide a useful experimental guidance for the preparation of pure-phase BFO by clarifying its thermo-dynamic stability and thermal expansion characters.1 ExperimentalThe BFO ceramic was prepared by a combined method of solid state reaction and quenching using Bi 2O 3 and Fe 2O 3. Minor Bi 25FeO 39 phase in the ceramic was leached by dilute nitric acid. The crystal structure of pure BFO powder was characterized by HT-XRD using Bruker D8 ADV ANCE X-ray diffractometer with the heating rate 30 ℃∙min –1 in air. Data were collected from 20° to 110° (2θ) in the step scanning mode (step size=0.02°, FT= 1.5 s) in the temperature range of 25–800 ℃ and 700– 25 ℃. The lattice parameters and unit-cell volumes were calculated by Rietveld refinements based on TOPAS software. This refinement modeled the background and peak shape by a fifth order polynomial and a Pseudo-第10期CHENG Guo-Feng, et al: Thermodynamic Stability and Thermal Expansion of Pure-phase BiFeO31129Voigt II function, respectively. Backscattered Electron (BSE) images and Energy-dispersive Spectrometry (EDS) quantitative measurement were carried out by a Scanning Electron Microscope (FEI MAGELLAN 400). The Ra-man spectra of pure BFO powder at the temperature range 25–750 ℃were examined using a Renishaw confocal Raman spectroscopy (model inVia). The laser power was maintained at 0.2 mW with semiconductor laser excitation at 532 nm.2 Results and discussionThe thermodynamic stability of pure BFO powder is performed by the in-situ HT-XRD. Fig. 1(a–b) show the X-ray diffraction patterns at selected temperatures in the heating and cooling process, respectively. The upper in-serts show the two main peaks of BFO as index of (104) and (110). During the heating process, BFO keeps rhom-bohedral R3c structure and no phase transition occurs. The shift of 2θ-values towards smaller Bragg angles is observed in the XRD patterns, which means that heating could make the lattice parameters transition, indicating the thermal expansion behavior. However, the main peak of Bi25FeO39as index of (201) is observed during the cooling process from 700 ℃to 25 ℃as shown in the upper left insert in Fig. 1(b), which demonstrates the decomposition of metastable BiFeO3.BSE images and EDS quantitative analysis results of the sample before and after HT-XRD analyzing are shown in Fig. 2. It is clearly seen that some white phases (Bi-rich Bi25FeO39and Fe-rich Bi2Fe4O9) are dispersed on the boundary of gray phases (BiFeO3). The decompo-sition equation of BiFeO3 will be[13,15]:49BiFeO3→Bi25FeO39+12Bi2Fe4O9 (1)This decomposition suggests that BiFeO3 shows ther-modynamic instability behavior in the cooling process, which is different from that in the heating process. The decomposition reaction could be assimilated to a first- order transition, and the nucleation is required[20]. In ad-dition, the shift of 2θ-values towards bigger Bragg angles in the cooling process could indicate the negative thermal expansion behavior. To further study the detailed changes of the lattice constants transition, Rietveld refinements are performed using TOPAS software.Fig. 3 shows the typical measured and simulated XRD patterns of BFO samples before and after heating process (room temperature, 25 ℃). BFO and a little amount of Bi25FeO39phase (weight percentage 3.5%) were refined with R3c and I23 structural model, respectively. All the criteria R-factors (R WP) are less than 6.5%, which sug-gests that the refinements are successfully performed. The refined structural parameters in the heating process are summarized in Table 1 and Table 2.Fig. 1 High temperature XRD patterns of BFO at selected temperatures in the heating (a) and cooling (b) process Two main peaks of BFO as index of (104) and (110) are shown in upper insert at 31° to 33°;The main peak of Bi25FeO39 as index of (201) is shown in the upper left insert (b)Fig. 2 BSE images and EDS results on the surface of BFO powder before (left) and after (right) heating1130无 机 材 料 学 报第34卷Fig. 3 Observed (black solid lines), calculated (red solid lines) and difference (blue solid lines) XRD patterns of BFO powder before and after heating processTable 1 Refined lattice parameters of BFO powder in the heating processLattice parametera /nm c /nm V /nm 3 25 0.5579253(74) 1.387086(20) 0.373926(11)100 0.5582803(68) 1.388433(20) 0.374766(11)200 0.5588673(71) 1.390434(20) 0.376096(11)300 0.5594514(79) 1.392472(23) 0.377435(12)4000.5601610(83) 1.394704(24) 0.378999(13)500 0.5608080(19) 1.396426(49) 0.380344(29)600 0.5614370(21) 1.397813(54) 0.381577(32)700 0.5621000(24) 1.398977(61) 0.382797(36)8000.5628300(22)1.399778(58)0.384011(34)Table 2 Refined structural parameters of BFO powder in the heating processAtom positionBi FeO T /℃ x y z x yzx y z R wp /%25 0 0 0 0 0 0.22124(27)0.46400(22) 0.01990(16) 0.95452(57) 5.87 100 0 0 0 0 0 0.22129(30)0.46160(21) 0.02330(17) 0.95583(57) 5.98 200 0 0 0 0 0 0.22227(29)0.44790(19) 0.02350(18) 0.95600(65) 6.05 300 0 0 0 0 0 0.22039(28)0.45230(18) 0.03560(17) 0.95718(64) 5.96 400 0 0 0 0 0 0.22192(29)0.43660(18) 0.02550(18) 0.95829(68) 5.82 500 0 0 0 0 0 0.22325(32)0.42590(23) 0.01370(23) 0.95869(84) 5.88 600 0 0 0 0 0 0.22484(36)0.41590(23) 0.01790(24) 0.96229(85) 6.07 700 0 0 0 0 0 0.22400(38)0.43700(19) 0.00720(18) 0.95701(67) 5.6 8000.22376(49)0.43290(20)0.01880(21)0.95832(77)6.02The temperature dependences of lattice parameters (a , c ) and unit-cell volumes (V ) for BFO in the heating and cooling process are shown in Fig. 4. The variation of the lattice parameters (a , c ) and unit-cell volumes (V ) with temperature could be fitted to a linear function [21-22]. It can be observed that the lattice parameters and unit-cell volumes of BFO increase and decrease monotonically in the heating or cooling process, respectively. This linearfitting also suggests that no structural phase transition occurred for BFO.Fig. 5 shows the relative changes of lattice parameters and cell volumes for BFO in the heating process. The black, blue and red dash lines represent the values calcu-lated from the linear fit of the lattice parameters and cell volumes. The thermal linear and volumetric expansion coefficients of BFO in the heating process (25–800 ℃)Fig. 4 Lattice parameters and cell volume of BFO in the heating process (temperature regime 25–800 ℃, (a))and cooling process (temperature regime 700–25 ℃, (b))T /℃第10期CHENG Guo-Feng, et al : Thermodynamic Stability and Thermal Expansion of Pure-phase BiFeO 31131Fig. 5 Relative changes in lattice parameters of BFO as a function of temperature in the heating processare calculated with the following equation [20-21,23]:0000()xT x x x x T T x Tα-∆==-∆(2)Where x denotes a , c , and V at selected high temperatures, and x 0 denotes the value of a , c , and V at 25 ℃. The calculated thermal linear and volumetric expansion coef-ficients of BFO are listed in Table 3, which show an iso-tropic and positive behavior. It was suggested that the rhombohedral structure with the space group of R3c is very stable, which could be the possible mechanism for their non-phase transition and lower thermal expansion behavior during the heating process.To establish qualitatively the temperature dependent structural evolution, we further analyze the bond length/bond angle. The atomic positional and occupancy parameters of BFO in the heating process are calculated and refined by the least squares method using TOPAS software. The chemical bonding behavior are determined from this Rietveld refinement. For the G-type structure with space group R3c of BiFeO 3, the tilting of FeO 6 oc-tahedron represents the rhombohedral distortion of the perovskite structure. Fig. 6 exhibits the two types of Fe–O bond lengths and the inter-octahedral O–Fe–O an-gles in the heating process [24]. Fe–O (I) and Fe–O (II) bond lengths basically maintain invariable and slowly increase in the temperature range of 25–400 ℃, respec-tively. However, Fe–O (I) bond lengths dramatically in-crease above 400 ℃, Fe–O (II) bond length drops sud-denly around 700 ℃. In addition, We note, the O–Fe–O bond angles exhibit compression in the temperature range of 300–600 ℃. After that, these bond angles showTable 3 The thermal linear and volumetricexpansion coefficients of pure BFOSample Temperature/ ℃ αT a / (×10–6,℃–1) αT c / (×10–6,℃–1) αT V/(×10–6,℃–1)BiFeO 3 25–800 11.34 11.81 34.80Fig. 6 Fe–O bond lengths and Fe–O–Fe angles of BFO in the heating processan increase upon heating above 600 ℃, which conse-quently induces tilts oxygen octahedron and expansion of the unit cell [25]. This oxygen octahedron tilt distortion may result in the decomposition of BiFeO 3.Fig. 7 shows the Raman spectra of BFO at selected temperatures in the heating process. For BFO at 25 ℃, three strong peaks at 138, 172, 219 cm −1 and one weak peak around 427 cm −1 are assigned as A 1-1, A 1-2, A 1-3 and A 1-4 mode, respectively. The peaks at 259, 283, 321, 349, 475, 523, and 553 cm –1 belong to E mode [26]. In the heating process, BFO keeps its structure which is in agreement with the HT-XRD results. Increasing tem-perature results in the shift (toward lower wavenumber) and broaden of Raman bands, which is explained in terms of thermal expansion and oxygen octahedron tilt distortion.Fig. 7 Raman spectra of BFO at selected temperatures in theheating process1132 无机材料学报第34卷3 ConclusionIn this study, the thermodynamic stability, decomposi-tion and thermal expansion of pure BiFeO3are studied systematically. BFO keeps its rhombohedral structure with the space group of R3c. The temperature dependences of the relative lattice parameters and cell volume for the BFO are linear, suggesting that, in the heating process (25– 800 ℃), no structural phase transition occurs. However, minor BiFeO3 could decompose to Bi2Fe4O9 and Bi25FeO39 in the cooling process. The oxygen octahedron tilt distortion reflected by the change in bond length may result in the decomposition of BiFeO3. The thermal linear and volumetric expansion coefficients of BFO in the heating process are calculated, which show an isotropic and positive behavior.References:[1] CARV ALHO T T, TA V ARES P B. Synthesis and thermodynamicstability of multiferroic BiFeO3. Mater. Lett., 2008, 62(24): 3984–3986.[2] BERNARDO M S, JARDIEL T, PEITEADO M, et al.Reactionpathways in the solid state synthesis of multiferroic BiFeO3. J. Eur.Ceram. Soc., 2011, 31(16): 3047–3053.[3] RANGI M, SANGHI S, JANGRA S, et al.Crystal structuretransformation and improved dielectric and magnetic properties of La-substituted BiFeO3multiferroics. Ceram. Int., 2017, 43(15): 12095–12101.[4] MICHEL C, MOREAU J M, ACHENBACH G D, et al.Theatomic structure of BiFeO3. Solid State Com., 1969, 7(9): 701–704.[5] CHATURVEDI S, BAG R, SATHE V, et al.Holmium inducedenhanced functionality at room temperature and structural phase transition at high temperature in bismuth ferrite nanoparticles. J.Mater. Chem. C, 2016, 4(4): 780–792.[6] WEI J, HAUMONT R, JARRIER R, et al. Nonmagnetic Fe-sitedoping of BiFeO3multiferroic ceramics. Appl. Phys. Lett., 2010, 96(10): 102509.[7] GAUTAM A, RANGRA V S. Effect of Ba ions substitution onmultiferroic properties of BiFeO3 perovskite. Cryst. Res. Technol., 2010, 45(9): 953–956.[8] NALWA K S, GARG A, UPADHYAYA A. Effect of samariumdoping on the properties of solid-state synthesized multiferroic bismuth ferrite. Mater. Lett., 2008, 62(6/7): 878–881.[9] WANG Y P, ZHOU L, ZHANG M F, et al. Room-temperaturesaturated ferroelectric polarization in BiFeO3 ceramics synthesized by rapid liquid phase sintering. Appl. Phys. Lett., 2004, 84(10):1731–1733.[10] ZHANG S T, LU M H, WU D, et al. Larger polarization and weakferromagnetism in quenched BiFeO3ceramics with a distorted rhombohedral crystal structure. App. Phy. Lett., 2005, 87(26): 262907.[11] SELBACH S M, TYBELL T, EINARSRUD M A, et al.Size-dependent properties of multiferroic BiFeO3nanoparticles.Chem. Mater., 2007, 19: 6478–6484.[12] ZHANG L, CAO X F, MA Y L, et al. Polymer-directed synthesisand magnetic property of nanoparticles-assembled BiFeO3microrods. J. Solid. State. Chem., 2010, 183(8): 1761–1766. [13] KUMAR M M, PALKAR V R, SRINIV AS K, et al.Ferroelectricity in a pure BiFeO3 ceramic. Appl. Phys. Lett., 2000, 76(19): 2764–2766.[14] SELBACH S M, EINARSRUD M A, GRANDE T. On thethermodynamic stability of BiFeO3. Chem. Mater., 2009, 21(1): 169–173.[15] CHENG G F, RUAN Y J, LIU W, et al.Effect of temperaturevariation on the phase transformation in the reaction sintering of BiFeO3 ceramics. Mater. Lett., 2015, 143: 330–332.[16] CHEN J, FAN L, REN Y, et al, Unusual transformation fromstrong negative to positive thermal expansion in PbTiO3-BiFeO3perovskite. Phys. Rev. Lett., 2013, 110: 115901.[17] BHA TTACHARJEE S, TAJI K, MORIYOSHI C, et al. Temperature-induced isostructural phase transition, associated large negative volume expansion, and the existence of a critical point in the phase diagram of the multiferroic (1-x)BiFeO3-x PbTiO3solid solution system. Phys. Rev. B, 2011, 84(10): 104116.[18] KLYNDYUK A I, CHIZHOV A E A. Structure, thermal expansion,and electrical properties of BiFeO3-NdMnO3, solid solutions. Inorg.Mater., 2015, 51(3): 272–277.[19] CHEN J, XING X R, LIU G R. Structure and negative thermalexpansion in the PbTiO3-BiFeO3system. Appl. Phys. Lett., 2006, 89: 101914.[20] PALAI R, KATIYAR R S, SCHMID H, et al.β, phase and γ-β,metal-insulator transition in multiferroic BiFeO3. Phys. Rev. B, 2008, 77(1): 014110.[21] GUSEV A I, SADOVNIKOV S I, CHUKIN A V, et al.Thermalexpansion of nanocrystalline and coarse-crystalline silver sulfide Ag2S. Phys. Solid State, 2016, 58(2): 251–257.[22] KESKAR M, KRISHNAN K, DAHALE N D. Thermal expansionstudies on Th(MoO4)2, Na2Th(MoO4)3, and Na4Th(MoO4)4. J.Alloys Compounds, 2008, 458(1): 104–108.[23] HALV ARSSON M, LANGER V, VUORINEN S. Determination ofthe thermal expansion of κ-Al2O3, by high temperature XRD. Surf.Coat. Tech., 1995, 76-77(5): 358–362.[24] KUBEL F, SCHMID H. Structure of a ferroelectric and ferroelasticmonodomain crystal of the perovskite BiFeO3. Acta Cryst., 1990, B46: 698–702.[25] FIZA M, HASSNAIN J G, ISMAT S S. Peculiar magnetism in Eusubstituted BiFeO3and its correlation with local structure. J.Phys.:Condens. Matter, 2018, 30: 435802.[26] PANDEY R, PANDA C, KUMAR P, et al. Phase diagram of Smand Mn co-doped bismuth ferrite based on crystal structure and magnetic properties. J. Sol-Gel Sci. Technol., 2018, 85: 166–177.纯相BiFeO3的热稳定和热膨胀性质研究程国峰, 阮音捷, 孙玥, 尹晗迪(中国科学院上海硅酸盐研究所, 无机材料分析测试中心, 上海200050)摘要: 本研究利用原位高温衍射和高温拉曼技术对纯相BiFeO3粉体的热稳性和热膨胀性质进行了系统的解析。
高分子基固-固相变材料的研究进展300?材料导报2010年11月第24卷专辑16高分子基固一固相变材料的研究进展高毅,田春蓉,王建华(中国工程物理研究院化工材料研究所,绵阳621900)摘要简要介绍了近年来兴起的高分子固一固相变材料的研究进展,从机理,应用,优缺点等各方面对各类材料进行了阐述比较,并通过分析得到目前研究的高分子固一固相变材料主要为物理共混类与化学接枝共聚类,着重讲解了各类材料的制备过程与性能表征,并展望了今后高分子固一固相变材料的发展前景.关键词高分子材料固一固相变材料储能材料ResearchProgressofPolymer-basedSolid-SolidPhaseChangeMaterialsGAOYi,TIANChunrong,WANGJianhua (ChemicalInsitituteofChinaAcademyofEngineeringPhysics,Mianyang621900) AbstractPolymersolid-solidphasechangematerialsstudyarereviewed.Fromthemechanis m,applications, advantagesanddisadvantagesofotherpartiestodothefaceofvariousmaterialsaredescribed. Analysisofthecurrentstudyofpolymersolid-solidphasechangematerialmainlyblendsphysicsandchemistryclas sescopolymerization.The varioustypesofmaterialsfocusedonthepreparationprocessandcharacterizationareexplain ed.Andthenextpolymersolid-solidphasechangematerialsdevelopmentisprospects. Keywordspolymermaterials,solid-solidphasechangematerials,energystorge0引言能源是人类赖以为生的基础,但能源的供给却常常存在时间和空间上的不匹配,这就造成大量能源的浪费.因此,对能源高效合理利用具有重要的现实意义.相变材料(Phasechangematerials,PCM)的理论基础和应用就是在这样的背景下迅速发展起来的,它利用物质在升降温过程中吸热或放热进行能量的储存和温度调控l1].由于气体相变前后体积变化过大且不易控制,人们的研究方向着重在固一液相变材料和固一固相变材料上.固一液相变过程有液体出现,且材料形状不易控制,尽管可以通过制成微胶囊r3使其宏观表现为固一固相变,但是它存在对壳层材料要求较高,制造过程毒性较大,成本高等缺陷.因此,固一固相变材料作为新兴产业,近年来得到蓬勃发展[4].而此类材料中,高分子相变材料又由于贮热容量大,容易制成各种形态,可以直接用作系统的结构材料并且不具有无机类固一固相变材料"过冷"与"析出"l_5]的缺陷等特点而成为相变储能材料最有发展前途的研究领域.本文概述了近30年国内外高分子材料领域中有关相变材料的研究状况.1高分子固一固相变材料的研究历史及应用美国在相变材料的储能理论和应用研究方面一直处于领先地位,2O世纪6O年代就已经制成具有加热被垫的衣服, 并将相变材料应用在阿波罗15上,DrMariaTelkes在被动式太阳房领域成果卓越.紧随其后的是日本和德国,三菱和东京电力公司联合进行了采暖和制冷系统的研究,西门子研究了用于高温储热在多孔陶瓷材料中充填PCM的技术.瑞典,法国,意大利和前苏联也进行了很多研究].我国在这方面的研究起步比较晚,理论与技术都相对较薄弱.目前我国的研究重点是"削峰填谷",以缓解电网负荷过重,同时近几年兴起的建筑材料的应用也是主要支柱之一.现阶段,高分子固一固相变材料主要应用于以下几个方面:(1)军,民用保暖服装,主要体现在各纤维类相变材料的生产上;(2)墙体保温材料,在太阳能比较充足的天气下充分吸收太阳能,储存在墙体内,在温度相对较低时释放出来,维持室内恒温;(3)军用防红外侦探的仿真诱饵;(4)人造卫星,航天飞行器等关键部位的恒温保护;(5)运输业的运用,现已将高分子固一固相变材料用于制造恒温集装箱等;(6)日常用品,如近年兴起的"笔记本电脑恒温垫"就是高分子固一固相变材料.2高分子固一固相变材料的分类高分子固一固相变材料的工作原理主要是在晶型转变时可逆吸放热,主要包括高分子交联型结晶聚合物相变材料和醇类及层状钙钛矿物质复合材料及部分接枝共聚物[io3.因此,可以根据制备方法将现阶段研制的高分子固一固相变材料*中国工程物理研究院学科发展基金重点资助项目(2O07AO3003)高毅:女,1983年生,硕士生,主要研究方向为相变储能材料E~mail:sagy312sin,~com 王建华:通讯作者E-mail:***********.cn高分子基固一固相变材料的研究进展/高毅等?301?分为以下几类.2.1物理共混法制备高分子固一固相变材料此类材料的制备是通过将具有很高相变焓的高分子固一液相变材料与载体基质进行共混[1],即利用二者的相容性,熔融后混合在一起而制成成分均匀的相变材料,这样可以使材料结合有机和无机的优点,达到高相变焓和形状固定的双重目的.Salyer[13]将熔融状态下的脂肪酸与经表面处理的纳米级Si()2粉末进行混合,得到一种以Si0为核,周围吸附大量脂肪酸分子的粉末状复合物.吸附在SiO.表面的脂肪酸可以随温度的变化而进行可逆相变,存储或者释放能量;同时Si02颗粒则起到稳定形状的作用,使材料从宏观上体现形状稳定的特点,但纳米Si0分散性不易控制,工艺复杂. WangXw_】将多元醇与环氧树脂共混配合形成二元体系,固化后压制成膜,制成相变温度为30~40℃,相变焓大于100J/g的固一固PCM,但热性能不稳定,会分解失效.赵建国_15]以天然鳞片石墨为原料制备可膨胀石墨,并制成了聚乙二醇/膨胀石墨相变材料,聚乙二醇可以很好地保持其相变性质,同时膨胀石墨又能控制其相变过程中的形状.肖敏等口将相变材料石蜡与苯乙烯一丁二烯一苯乙烯三嵌段共聚物制得的定形固液相变储热材料中加入了膨胀石墨,其放热速率较纯石蜡提高了1.5倍.他们还采用液相插层法将有机相变物材料嵌入到二氧化硅或膨润土纳米材料中,利用其纳米尺寸效应,比表面积大等特点,使有机一无机纳米复合储热材料在发生相变时,有机相变材料很难从二氧化硅的三维纳米网络中或膨润土的纳米层问释放,也可解决有机相变储热材料的泄漏问题.中科院广州化学所[1将聚乙二醇和纤维素通过溶液混合得到以聚乙二醇为主体的复合固一固相转变储能材料.该复合物实际上是聚乙二醇与纤维素之间的物理混合物,其中聚乙二醇的结构并没有发生变化.但这种复合材料存在一些缺陷:(1)制备工艺比较复杂,所需的溶剂体系价格较高而且难以回收,材料的成本较高;(2)由于纤维素是刚性链大分子,与聚乙二醇形成的共混物不具有热塑性,因而不能进行热成型.物理共混合制备的高分子固一固相变材料存在一些缺点: (1)难以克服低熔点工作物质在融熔后通过扩散迁移作用与载体基质问出现相分离的难题;(2)工作物质中加入一定量的载体后,导致整个材料储热能力下降,材料的能量密度较小;(3)载体中掺人工作物质后又导致材料力学性能下降,整个材料的硬度,强度,柔韧性等性能都受到很大的损失,以至于寿命缩短,易老化而使工作物质泄漏,污染环境.2.2化学交联/接枝法制备高分子固-固相变材料2.2.1聚烯烃类固一固相变材料这类PCM使用最多的是高密度聚乙烯(HDPE),其相变潜热高达21OJ/g,结晶熔点为135~C,廉价且易加工¨1引. 并且,由于其分子链柔顺性好,内旋转位垒低,流动单元的链段短,熔融温度Tf被粘流温度了1m覆盖[1,结晶熔融后聚合物仍处于高弹态,无宏观流动,一定温度范围内可保持固定形状,因此,可以将其用作固一固相转变储能和温控材料.文献[2o3报道,为提高HDPE在高温下使用时的形状稳定性,可使用化学,辐射交联的方法对聚乙烯的颗粒进行表面交联,也可以在聚乙烯颗粒表面加上一薄层包封物.这种交联改性和包复的聚乙烯已经被用于120~135℃条件下的能量贮存.但聚乙烯用作相变材料时存在相变温度高的缺陷,影响了它的使用范围.通过与其它有机材料共聚的方法可以适当降低聚乙烯的相变温度.2.2.2多元醇类固一固相变材料此类物质主要包括新戊醇(NPG),2一氨基一甲基一1,3一丙二醇(AMP),三羟甲基乙烷(PG),三羟甲基氨基甲烷(TAM),季戊四醇(PE)等,其热性能见表1_2.表1几种多元醇的相变点和相变焓数据Table1PhasechangebehaviorofPCMsampleswith differentpolylols由表1可以看出,多元醇本身就是一种固一固相变材料.根据对其进行的偏光显微测试(POM)和扫描电镜测试(SEM)研究表明,其相变主要是通过由一种晶态到另一种晶态的转变进行能量吸收和释放,相变潜热主要来源于不同晶型氢键的形成和破裂面吸收的能量.Benson等__1]在对多元醇类相变材料进行深入研究后发现,多元醇的固一固相变属于一级相变,随着羟基数目的增加,相变焓也相应增大.多元醇类PCM具有使用寿命长,相变温度较高(80~200~C),反复使用不分解无分层等优点,但其存在热性能不稳定的缺点.在固一固相变温度以上,其晶体受到较高的蒸气压,易变成气体逸出[243,经多次热循环后就会逐渐分解而失效.何天白等口也提到还有一种与多元醇/聚合物复合相变材料相类似被称为"Perovskite层状复合物/聚合物"的复合相变材料(Perovskite层状复合物是Fittinaldi等研究的具有可逆固一固相转变的金属有机复合材料,是将金属与长链高分子进行复合,具有与钙钛矿类似的三明治层状结晶结构).由多元醇与Perovskite层状复合物复合制成的PCM在低温状态下烷基链处于平面排列的结晶状态,而在高温态它们则发生相转变,吸收能量由有序的晶态转变为无序态.相变过程中复合物的宏观物理状态保持不变它的缺点就在于其是一种易碎的粉末,力学强度不高,使用范围也受到一定的影响.2.2.3聚乙二醇类固一固相变材料聚乙二醇(PEG)本身具有-6CH一CH一O的结构,链结构较规整,易结晶,相变潜热达到187J/g_l,具有相变材料302?材料导报2010年11月第24卷专辑16的典型特性,其相变温度还可以通过相对分子量进行调节,因此目前对PEG相变行为研究的相关报道很多.(1)聚乙二醇与纤维素接枝共聚Vigo[zs,26]将聚乙二醇接枝到棉花,麻等纤维素分子链上,或将交联聚乙二醇吸附于聚丙烯,聚酯等高分子纤维表面,所得到的纤维材料具有温度调节功能,可以制成穿着舒适的"恒温服装".但吸附在纤维表面的聚乙二醇量还太少, 导致纤维材料的储热容量较低,服装的恒温时间较短,测试结果表明仅仅只有2O~25rain,且必须重新置于低于相变温度的环境,让衣物回到低温状态,才能再次致冷.姜勇等口先对聚乙二醇(PEG)进行改性,再把它的端羟基接枝在二乙酸纤维素(CDA)骨架上,合成了一种PEC~CDA网状材料, 但存在使用寿命较短,生产工艺复杂等缺陷_2.此外,还有研究者瞳将不同分子量的聚乙二醇接枝或嵌段到一些聚酯(如聚对苯二甲酸乙二酯(PET)或聚对苯二甲酸丁二酯(PBT))中研制出具有储热调温功能的纤维.(2)聚乙二醇与其他分子接枝共聚徐金军[3o]使甲基丙烯酸单封端聚乙二醇大分子单体(MA—PEG)与甲基丙烯酸甲酯(MMA)进行自由基接枝共聚反应,得到了以PEG为支链,聚甲基丙烯酸甲酯为主链(PMMA—g-PEG)的接枝共聚物.各表征结果表明,在MA_ PEG大分子单体与MMA的不同配比条件下,得到的PM—MA-g-PEG的分子量和分子量分布基本相同,具有明显的相转变,相变焓,相变温度与PEG的含量有关,并且随其含量的增加而增大或升高.周光宇等..以不同相对分子质量的聚乙二醇为原料,用酯交换法与聚对苯二甲酸乙二醇酯(PET)进行共缩聚,得到PEG嵌段长度或含量不同的PET-PEG共聚物.结果显示,当PEG的相对分子质量达到4000时,共聚物中的PEG链段才具有常温相转变热性质,且共聚物中PEG的含量过高,热焓反而下降,故PEG含量宜控制在4O~45%.这种材料的优点是PEG嵌段长度可调,具有智能相变功能.但PET—PEG共聚物中作为工作物质的PEG含量太低,致使其储热能力较弱.以上这种化学接枝改性的方法克服了固一液相变材料的泄漏问题,无需容器盛装,可直接加工成型,不会发生过冷现象.但若在相变介质中加入热导率较低的聚合物载体,就会使有机相变材料的热导率更低,还可能使整个材料的储热能力下降.(3)聚乙二醇为软段的聚氨酯型固一固相变材料1999年专利[3利用PEG分子链上的羟基与多官能团的异氰酸酯反应制备了聚氨酯结构的固一固相变材料[3,其原理主要是将大量的PEG与适量的多官能团异氰酸酯反应,通过控制分散状态和反应程度,得到海~岛两相结构的反应产物.PEG由于多异氰酸酯的交联,使产物在结晶温度以上仍可保持固态.该材料也可通过改变PEG的含量与PEG的分子量得到不同相变焓和不同相变温度的固一固相变材料. 表2为纯PEG与PUPEG经多次热循环后的热性能与结晶度的比较__3.表2纯PEG与PUPEG经过多次热循环后的对比数据Table2ThecomparativedatasofpurePEGandPUPEG afterthermalcirculation注:为熔融温度;为结晶温度;H为相变焓;PEG结晶度是利用相变焓数据对比完全熔融情况下相变焓比例推算得出张梅等口先使TDI与PEG的端羟基反应,再将其接枝到PV A的主链上,形成梳状或交联网状的结构,利用DSC,W AXD和POM对其相变行为及形态结构进行了研究.结果表明,该材料呈现出可逆的固一固相转变特性,其结晶峰值温度和相变焓比纯PEG的低,接枝率对相变温度和归一化相变焓影响不大;接枝率只影响结晶与熔融行为,不影响结晶结构.粟劲苍[3]选用中高分子量聚乙二醇为软段,4,4,_二苯基甲烷二异氰酸酯(MDI)与丁二醇(BD0)为硬段,合成了具有储热性能的聚氨酯固一固相变材料,通过FTIR,DSC,W AXD等测试手段对体系的软硬段结晶性,微相分离,相变可逆性及循环热稳定性进行研究.结果表明,即使聚氨酯型相变材料(PUPCM)加热到高于PEG熔点时仍不会发生宏观流动而呈现出固相状态_1,而且由于它具有多嵌段聚氨酯结构,因此具有较好的化学稳定性和力学性能,缺点是制备工艺比较复杂.QiCao[11]用PEG6000和TDI合成聚氨酯预聚物,然后加入适量的Boltorn—H30(Boltorn公司研制的具有32个伯羟基,分子量为3600g/mol的多羟基树枝型聚酯)制成了超支化PUPCM.测试结果显示,当环境温度达到PEG6000熔点时,PUPCM仍能保持固态而不出现液态流动,同时,相变焓由于硬段的引入必然减少,但是减少幅度并不大. LiWeidong[1]以PEG1000,MDI和PE为原料,与上述二者不同之处在于,他先将PE与MDI反应得到星状结构, 再加入PEG,通过两步法合成了PLⅡ,CM,经DSC测试,产物相变焓达152.97J/g,相变温度在58.68℃左右,经过100次热循环后仍保持固态.3结语目前,就全球范围来看,现阶段开发的高分子基固一固相高分子基固一固相变材料的研究进展/高毅等?303?变材料热能储存量大,温度可调控,无需容器盛装,可以直接加工成型;并且固一固相变膨胀系数较小,体积变化小;无过冷现象和相分离现象;无毒,无腐蚀,无污染;性能稳定,使用寿命长,使用方便,装置简单.因此高分子固一固相变材料是最有前途的研究领域之一.同时由于对此类相变材料研究的时间相对较短,尚有大量未开垦的领域.目前已经得到的固一固相变材料,由于品种较少且有缺陷,如导热系数低,完成相变所需时间较长,还需要进一步研究.根据目前的发展,预计今后的重点应放在以下几个方面:(1)研究具有一系列相变温度的相变材料以满足不同的需求;(2)改善相变材料的导热性能和相变速率;(3)根据相变机理提高其相变焓,研制出高能量密度的相变材料;(4)掌握相变材料之间的复合原则以及如何复合提高材料的性能以弥补不足;(5)开发出除具有相变储能功能外还具有其它功能的多功能相变材料,如导电相变材料,可微波加热的相变材料,防水相变材料,可杀菌防虫蛀的相变材料,形状记忆相变材料等;(6)降低成本,实现工业化.参考文献1FengHY,LiuXD,HeSM,eta1.Studiesonsolid-solid phasetransitionsofpolyolsbyinfraredspectroscopy[J]. ThermochimActa,2000,348:1752秦培煌,周世权.能源材料的研究现状及发展前景[J].节能, 2002(5):53Y amagishiY,SugenoT,IshigeT,eta1.Anevaluationofmi—croencapsedPCMforuseincoldenergytransportationme-dium[J].ProcIntersocEnergyConversEngConf,1996,31:20774赵镇南,吴挺,李丽新,等.乳液相变储冷材料的基本特性与应用前景[J].能源工程,2000(4):285张寅平,胡汉平,孑L祥东,等.相变储能理论和应用[M].合肥:中国科学技术大学出版社,1996:46TelkesIVtThermalstorageinsalt-hydrates~M]//MurrLE.SolarMaterSci.NewY ork:AcademicPress,1980:3777Sadek0M,MekhamerWK.Camontmorilloniteclayasther—malenergystoragematerial[J].ThermochimActa,2000,363:4478HawladerMNA,UddinMS,ZhuHJ.Encapeulationphase changematerials[J].IntJEnergyRes,2002(26):1599GongZX,MujumdarAS.Enhancementofenergycharge dischargeratesincompositeslabsofdifferentphasecharge materials[J].IntJHeatMassTransfer,1996,39(4):7251o吕社辉,郭元强,陈鸣才,等.复合高分子相变材料研究进展[J].高分子材料科学与工程,2004,20(3):3711QiCao.Crystalline-amorphousphasetransitionofhyper—branchedpolyurethanephasechangematerialsforenergystorage[J].JMaterSci,2007,42:566112LiWeidong,DingEnyong.Preparationandcharacterization ofcross—linkingPEG/MDI/PEcopolymerassolid-solid phasechangeheatstoragematerial[J].SolarEnergyMater SolarCells,2007,91:76613SalyerIO.Thermoplastic,moldablenon-extrudingphase changematerials:US,5565132JP).199614刑澄清,迟广山.多元醇二元体系固一固相变贮热的研究[J]. 太阳能,1995,16(2):13115粟劲苍,刘朋生.具有储能功能的聚氨酯固一固相变材料的研究口].华东理工大学,2006,32(2):19716赵建国.聚乙二醇/膨胀石墨相变储能复合材料rJ].现代化工,2008(9):3417何天白,胡汉杰.功能高分子与新技术[M].北京:化学工业出版社,2001:17818SuJunfeng.SynthesisofpolyurethanemicroPCMscontai—ningn-octadecanebyinterfacialpolycondensation:Influence ofstyrene-maleicanhydrideasasurfactant[J].ColloidsSurfA-PhysicochemEng,2007,299(1-3):26819吴刚,郑强,江磊,等.HDPE氧化交联与动态流变行为[J].高等学校化学,2004(4):35720SonCH.Thermalconductivityenhancementofsolid-solid phasematerialsforthermalstorage[J].ThermophysicHeat Transfer,1991,5(1):12221郭静,李楠.高分子基相变储能材料的研究进展[J].合成纤维,2008(5):2722MohammedMFarid,AmarMKhudhair,SiddiqueAliK.A reviewonphasechaneenergystornge:materialandapplica—tionsEJ].EnergyConversionManagement,2004,45(910):159723邓卓,卢英先.结晶性高聚物作为相变材料的应用[J].中国塑料,1995,9(4):1724田胜力,张东,肖德炎.硬脂酸丁酯/多孔石墨定形相变储能材料[J].节能,2005(11):525VigoTkAntimiorobialmaterials[J].PolymNews,1996,21(3):8226VigoTL.Intelligentfibroussubstrateswiththermalanddi—mensionalmemories[J].PolymAdvTechn,1997,8(5):28127姜勇,丁恩勇,黎国康.一种新型的相变储能功能高分子材料[J].高分子材料科学与工程.2001,17(3):17328王忠,陈立贵,付蕾,等.接枝共聚法制备PEG/CDA高分子固一固相变材料及其表征[J].化工新型材料,2008(4):4229王艳秋,张恒中,朱秀林.化学法制备固一固相转变材料[J]. 精细石油化工进展,2005(12):3330徐金军,等.PMMA-g-PEG的制备及其相转变性能研究口]. 化工新型材料,2008(8):5131周光宇,胡吉,朱美芳,等.PET—PEG共聚物相变性能的研究.[J].合成纤维,2005(3):132Salyer.Phasechangematerialincorporatedthroughtthe structureofpolymerfiber:US,5885475[P].1999—03~2333CampbellC,eta1.Crystallinityofuniforrntriblockoxyethy- lene/methylene/oxyethyleneoligomersstudiedbyX-raydif—fraction,differentialscanningcalorimetryandramanspec—troscopy[J].DieMakromolekulareChem,2003,194(3):79934张梅.接枝共聚法制备聚乙二醇(PEG/聚乙烯醇(PV A)高分子固一固相变材料性能研究[J].高等学校化学,2005,26(1):17O35粟劲苍.聚氨酯固一固相变材料的研究[D].湘潭:湘潭大学, 2003。

DICP Course -Dalian, 2012Preparation of solid catalystsExercisesSupported by the Chinese Academy of Sciences Charles Kappenstein, Professor Emeritus, University of Poitiers, FranceEx.1. A transition alumina support has been prepared; the determination of the specific surface area (S BET ) and the porous volume (V p ) gave the following results:S BET = 200 m 2g -1V p = 1 mL g -1a) Calculate the size of the pores (hint: use the cylindrical pore model with constant diameter)b) Is this alumina microporous, mesoporous or macroporous?c) What is the accuracy of the experimental data? (hint: the accuracy can beexpressed as estimated relative standard deviation)Ex.2. A transition alumina support display a specific surface area S BET = 180 m 2g -1. It is used for the preparation of platinum supported catalysts Pt/Al 2O 3.The maximum loading of H 2PtCl 6precursor is: 1.6 µmol m -2.The number of surface hydroxyl groups is 8 OH nm -2.a) Compare the number of surface OH groups able to adsorb the precursor to the total number of surface OH groups (assumption: the adsorption need one OH group per precursor molecule).b) Describe the different steps of the preparation procedure.c) Determine the maximum platinum loading (in term of mass percentage) that can be reach at the end of the catalyst preparation.d) What would you suggest for the surface loading for 10 g of support? Calculate the initial pH for different surface loadings. Conclusion.Ex.3. We have prepared a catalyst Ir/Al 2O 3for the decomposition of hydrazine for space propulsion. The characteristics of the catalyst are:wt.-% Ir = 40 %Specific surface area of the support = 100 m 2g -1Porous volume = 0.7 mL g -1Ir crystallite size = 2 nma) Estimate the pore diameter of the supportb) Calcultate the distance x 1of Ir particles center to center on the surfacec) Calculate the distance x 2of Ir particles center to center in the porous volumeEx.4. Preparation of a copper catalyst on silica (200 m 2g -1)We prepare a solution containing the complex tetraamminecopper(II) [Cu(NH 3)4]2+by adding commercial concentrated ammonia (28 wt.-%, density 0.898 kg L -1)to 50 mL of an aqueous solution containing copper nitrate 0.2 mol L -1; the final pH is 12.The pK a of the acid-base couple NH 4+/NH 3is 9.25 at 25 °Ca) Concentration of the commercial ammonia solution?b) Concentration of ammonia in an aqueous solution of pH 12 at 25°C?c) Volume of the commercial ammonia solution to be to be added to reach pH 12?d) Final volume, concentration of copper and pH? ConclusionExercice4 (cont’d)Ex.4. Preparation of a copper catalyst on silica (200 m2g-1)We dip 8.5 g of silica into the solution at room temperature and maintain agitation for 2 h. Then we remove the impregnated support by filtration, wash with water, dried, then calcined under air at 300 °C. We observe that 57 % of initial copper remains on the support as CuO.e) How can we obtain experimentally this value?f) Describe the silica surface in ammonia solution? Compare with the aqueous solution.g) What happen in the presence of the copper complex; what is the best procedure to impregnate silica? What is the surface density of copper complex(in nm-2)?h) Determine the wt.-% of CuO and Cu in the sample. How can we obtain experimentally this value?A sample of 100 mg is followed by H2TPR. At 300 °C, the H2consumption is 1.44 cm3(20°C, 1 bar); at 500 °C, the H2consumption is 1.55 cm3(20 °C, 1 bar)i) Determine the reduction rate for copper at both temperatures. What is the final wt.-% of Cu in the sample?Ex.5. Study of a silica-supported copper catalyst Cu/SiO2Cu cubic cell, Bravais lattice F, a = 3.6147 Å= 1 wt.-% Cu Dispersion = 10 %Loading level xma) Determine: (i) the diameter of a copper atom, (ii) the atom surface density for the threefaces (100), (110) and (111), (iii) the mean density, and (iv) the average distance LCu between two Cu atoms.b) Determine: (i) the surface area of copper A(m2g-1), (ii) the size of the coppermparticles d (nm), (iii) the number of copper particles (g-1), the perimeter of the interface metal/support (hint: cubic particles with one face in contact with support, edge length d, surface density = mean density).c) Calculate: (i) the total number of copper atoms present in one particle; (ii) the number and percentage of Cu atoms on the free edges and corners; (iii) the number and percentage of Cu atoms on the free faces and (iv) the number and percentage of atoms in contact with the support.Ex.6. Characterization of a silica-supported copper catalyst Cu/SiO 2hydrogen is adsorbed on copper at 25 °C without dissociation; the adsorption enthalpy is close to -40 kJ mol -1.a) Can we use hydrogen to determine the number of surface Cu atoms?Nitrous oxide decomposes on copper between 25 and 80 °C following the reaction:N 2O(g) + 2 Cu(surface) Cu-O-Cu(surface) + N 2(g)Using 150 mg of the catalyst, we obtain 0.43 cm 3N 2(STP). Take data from Ex. 4.b) Determine the dispersion of copper and the metallic surface area.c) Calculate the size of the copper particles.d) We use electron microscopy; how many copper particles can we expect to see on a picture 200 nm x 200 nm?The copper atoms in contact with the support are more difficult to reduce. e) How ca we explain the TPR results?Ex.7. Preparation of a Rh/Al 2O 3catalystThe rhodium precursor is "RhCl 3⋅xH 2O" and contains 39.2 wt.-% Rh.50.00 g alumina are dip in 100 cm 3of aqueous HCl 0.100 mol L -1. Then, 1.00 g of precursor RhCl 3⋅xH 2O is added and the mixture is stirred for 1 h. After filtration, the impregnated alumina is dried at 120 °C for 6 h. The sample contains 1.10 wt.-% Cl.a) Determine the value of x in the precursor formula.b) With the assumption that all the precursor has been adsorbed onto the alumina, calculate the wt.-% for Cl and Rh. Explain why the experimental value for Cl is different. Explain why this precursor is able to be adsorbed quantitatively in acidic conditions.The dried catalyst is reduced (1 vol.-% H 2in Ar, 300 °C, 20 cm 3min -1, 1 h) and characterized by H-chemisorption at 20 °C. The hydrogen uptake is 0.62 cm 3g -1(STP)c) Determine the rhodium dispersion (hint: 1 surface Rh atom can adsorb 1 H atom)d) Calculate the metallic area (1 Rh atom, 7.9 Å2)and the average size of Rh particles (cubic model)Exercice 7 (cont'd)Ex.7. Preparation of a Rh/Al 2O 3catalyst。

原创性声明本人郑重声明:所提交的学位论文是本人在导师的指导下,独立进行研究取得的成果。
除文中已经注明引用的内容外,论文中不含其他人已经发表或撰写过的研究成果,也不包含为获得聊城大学或其他教育机构的学位证书而使用过的材料。
对本文的研究作出重要贡献的个人和集体,均已在文中以明确方式标明。
本人承担本声明的法律责任。
学位论文作者签名:日期导师签名:日期学位论文使用授权声明本学位论文作者完全了解聊城大学有关保留、使用学位论文的规定,即:聊城大学有权保留并向国家有关部门或机构送交学位论文的复印件和磁盘,允许论文被查阅和借阅。
本人授权聊城大学可以将学位论文的全部或部分内容编入有关数据库进行检索,可以采用影印、缩印或其它手段保存、汇编学位论文。
学位论文作者签名:日期导师签名:日期摘要本文从以下两个方面对BaTiO3压电陶瓷进行性能改性:采用固相合成法制备了对BaTiO3进行A、B位掺杂的BaTiO3基无铅压电陶瓷,研究了等价或异价离子掺杂对BaTiO3压电陶瓷的结构和性能的影响;改进了压电陶瓷的工艺制备过程,研究了直接反应烧结法对BaTiO3基压电陶瓷的结构和性能的影响。
主要内容如下:1.采用与BaTiO3的Ba2+位、Ti4+位化合价相同的离子Ca2+、Sn4+、Zr4+的两种(Ca2+、Sn4+)或三种离子(Ca2+、Zr4+、Sn4+)对BaTiO3陶瓷进行取代改性,研究了离子取代改性后陶瓷的结构和电性能。
适量的离子掺杂后的陶瓷仍具有纯的BaTiO3钙钛矿相结构,随着Ca2+添加量的增加,陶瓷的正交-四方相转变温度(T O-T)逐渐向低温移动,Ca2+掺杂量较多时T O-T移到室温以下,Ca2+的掺杂基本上不影响陶瓷的居里温度(T C)。
Zr4+和Sn4+对陶瓷相转变温度的影响相似,均能提高T O-T,但是使居里温度T C剧烈下降,合适配比的Ca2+、Sn4+共同掺杂或Ca2+、Zr4+、Sn4+共同掺杂能够调节陶瓷的正交-四方相转变至室温附近,由于在正交-四方相转变区时Gibbs自由能曲面变的较平,使得正交相和四方相的稳定性相似,在极化过程中自发极化便有更多的可转向方向,从而使得陶瓷的压电性能较为优异,Ca2+、Sn4+共同掺杂或Ca2+、Zr4+、Sn4+共同掺杂的BaTiO3基压电陶瓷因此都获得了优异的压电性能。
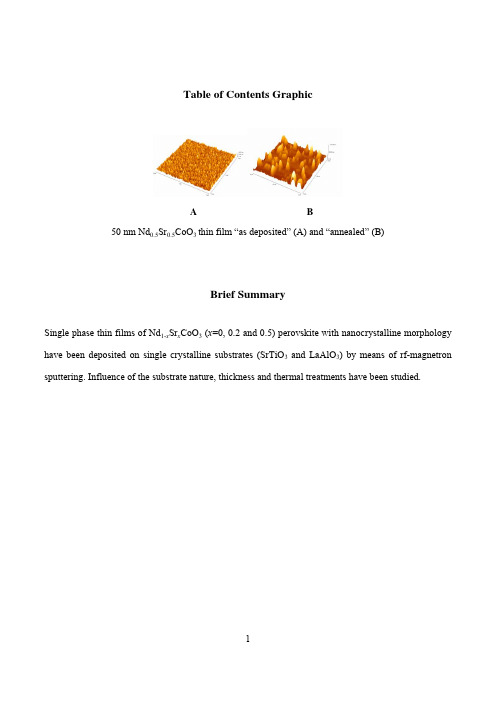
Table of Contents GraphicA B50 nm Nd0.5Sr0.5CoO3 thin film “as deposited” (A) and “annealed” (B)Brief SummarySingle phase thin films of Nd1-x Sr x CoO3 (x=0, 0.2 and 0.5) perovskite with nanocrystalline morphology have been deposited on single crystalline substrates (SrTiO3 and LaAlO3) by means of rf-magnetron sputtering. Influence of the substrate nature, thickness and thermal treatments have been studied.RF Sputter Deposition of Epitaxial NanocrystallineNd1-x Sr x CoO3 Thin FilmsLorenzo Malavasi1,*, Eliana Quartarone1, Carla Sanna2, Nathascia Lampis2, Alessandra Geddo Lehmann2, Cristina Tealdi1, Maria Cristina Mozzati3, and Giorgio Flor11Dipartimento di Chimica Fisica “M. Rolla” and INSTM, Università di Pavia, Viale Taramelli 16,27100 Pavia, Italy.2Dipartimento di Fisica – Università di Cagliari - Cittadella Universitaria St. Pr.le Monserrato-Sestu km.0.700, I-09042 Monserrato (Ca), Italy.3CNISM, Unità di Pavia and Dipartimento di Fisica “A. Volta”, Università di Pavia, Via Bassi 6, I-27100, Pavia, Italy.RECEIVED DATE (to be automatically inserted after your manuscript is accepted if required according to the journal that you are submitting your paper to)*Corresponding Author: Dr. Lorenzo Malavasi, Dipartimento di Chimica Fisica “M. Rolla”, INSTM, Università di Pavia, V.le Taramelli 16, I-27100, Pavia, Italy. Tel: +39-(0)382-987921 - Fax: +39-(0)382-987575 - E-mail: lorenzo.malavasi@unipv.itABSTRACTIn this paper we report the deposition of epitaxial thin films of Nd1-x Sr x CoO3 with x=0, 0.2 and 0.5 on single crystalline substrates (SrTiO3 and LaAlO3) carried out by means of rf-magnetron sputtering. The deposited films are all completely oriented and epitaxial and characterized by a nanocrystalline morphology. As-deposited films have an average roughness around 1 nm while after the thermal treatment this increases up to 20 nm while preserving the nanocrystalline morphology. All the films deposited on SrTiO3 have shown to be under a certain degree of tensile strain while those on the LaAlO3 experience a compressive strain thus suggesting that at about 50 nm the films are not fully relaxed, even after the thermal treatment. For the x=0.2 composition three different thickness have been investigated revealing an increased strain for the thinner films.KEYWORDS: cobaltite, perovskite, thin films, rf-sputtering, x-ray diffraction.IntroductionCobalt-containing perovskite-type oxides, particularly La-rich oxides, have been the subject of intense research mainly due to the possibility of optimizing their structural and physical properties by doping. The range of possible application for these oxides is wide, extending from components in solid oxides fuel cells (SOFCs), oxygen separation membranes and electrochemical reactors, to sensor devices based on their ability to catalytically oxidize CO and CH4 and reduce NO.1-6 In addition, perovskite cobaltites have received further attention after the observation of elevated Seebeck coefficients in related layered systems such as GdBaCo2O5+δ7-9 which suggest their possible application as thermoelectric materials (TE). Recent reports showed that doped perovskite cobaltites have relatively high figures of merit (Z) and this directly correlates to the different spin states available for the cobalt ions10-13. As a consequence, the TE materials research is the latest field where cobaltites appeared as promising and new compounds.Their magnetic and magnetoresistive properties are also of recent interest. In particular, a debate has been opened regarding the actual spin-state of Co in lanthanum cobaltites. In fact, it has been shown that in the range from 5 to 1000 K the Co ions pass through three different spin-states (low-spin LS, intermediate-spin IS, and high-spin HS) which are intimately connected to the structural as well as internal parameters such as the metal-oxygen bond lengths14. The spin state, in turn, affects the physical properties such as transport, magnetic and optical properties15-18 acting as a sort of “Jahn-Teller switch”, where for certain spin configurations the J-T distortion, for the same Co valence state, is suppressed. A general gradient approximation (GGA) study due to Knižek19 demonstrated that the relative stability of IS and LS depends on the Co-O distances and angles with longer bonds and more open Co-O-Co angle favouring the IS state. It is clear that the internal parameters, such as bond lengths and angles, play a major role in defining the cobaltites physical properties.Among RECoO3 (RE=rare earth) compounds, LaCoO3 and NdCoO3 have been object of previous investigation both as pure compounds and considering the role of divalent dopant (Sr) concentration20-23. Much of the previous work focussed on bulk or single crystalline materials and less on thin films preparation and characterization which, however, is the useful “physical form” for sensing and catalytic as well as TE micro-devices applications. Moreover, it would be desirable to make available nanocrystalline thin films where the high surface-to-volume ration can enhance the cobaltites physical properties.The current literature concerning with the synthesis of cobalt containing perovskite thin films is not rich and mainly devoted to the LaCoO3 and Sr-doped LaCoO3 whose preparation has been carried out by means of sol-gel24-26, screen-printing27, pulsed laser deposition (PLD)28, spray pyrolysis29 and hybrid CVD/sol-gel route30. Thin films of other phases with a different lanthanide on the A-site, such as the object of this work, have not been considered in the previous literature. However, other materials, such as the NdCoO3 perovskite, have already shown to be highly interesting materials for both magnetic18,20, sensing31-33, catalytic34,35, SOFC36,37 and thermoelectric properties38.In this paper we report the synthesis and structural and morphological investigation of oriented epitaxial thin films of Nd1-x Sr x CoO3 with x=0, 0.2 and 0.5 on single crystalline substrates (SrTiO3 and LaAlO3). The Sr-dopant has been chosen since it has shown to be one of the most soluble39 and one of the most favourable dopants in terms of structure distortion, with a tolerance factor close to 1. This leads to low-distorted phases where the Co-O-Co hole hopping is favoured. Increasing Sr-concentration gives origin to higher Co valence state and oxygen vacancies concentration, which are thought to be the active sites for gas adsorption. We stress that among the current literature, to the best of our knowledge, this is the first work reporting the deposition of a cobalt containing perovskites thin films by means of rf-sputtering and, in addition, the first paper reporting the preparation of oriented Nd1-x Sr x CoO3 thin films.Experimental SectionPowder samples of NdCoO3, Nd0.8Sr0.2CoO3 and Nd0.5Sr0.5CoO3 have been prepared by conventional solid state reaction from the proper stoichiometric amount of Nd2O3, Co3O4, and SrCO3 (all Aldrich ≥99,9%) by repeated grinding and firing for 24 h at 900-1050 °C.Thin films were deposited onto single-crystalline SrTiO3 (001), and LaAlO3 (100) (Mateck) by means of off-axis rf-magnetron sputtering (Rial Vacuum). The gas composition in the sputtering chamber was argon and oxygen (16:1) with a total pressure of 4x10⁻⁶ bar. The substrate was heated at 700°C and rotated during deposition. The rf-power was set to 150 W. After the deposition the films were annealed at 900°C in pure oxygen for 30 minutes. The chemical composition of starting powders and thin films was checked by means of electron microprobe analysis (EMPA) which confirmed their correct cation ratio.XRR data have been collected by using a Bruker D8 advance reflectometer equipped with a Göbel mirror. The Cu Kα line of a conventional X-ray source powered at 40 kV and 40mA was used for the experiment. The grazing incidence specular reflectivity curves were recorded with a θ-θscan in the 0–3°range. X-ray diffraction (XRD) patterns of starting powders were acquired on a Bruker D8 Discover diffractometer equipped with a Cu anode in a θ-2θgeometry. High resolution reciprocal space maps around symmetric and asymmetric reflections and ω-scans (rocking curves) on the epitaxial layers were performed on a 4-circles “Bruker D8 Discover” diffractometer (Cu anode) equipped with Goebel mirror for parallel beam geometry and pure Kα selection and with a 2-bounces (V-Groove) monochromator (Ge 022) for Kα2 elimination.AFM images (256×256 pixels) were obtained with an AutoProbe CP microscope (ThermoMicroscopes-VEECO), operating in contact mode (C-AFM), by means of sharpened silicon tips onto V-shaped cantilevers (resonance frequency: 15 kHz; force constant: 0.03 N/m). For each analysed film, scans of 5 µm × 5 µm and 2.0 µm × 2.0 µm have been carried out with a scan rate ranging from 1.0 to 1.5 Hz. A standard 2nd order flatten processing of the images has been performed in order to correct the scanner non-linearity.Results and DiscussionFigure 1 reports the refined X-ray diffraction pattern of the Nd 0.8Sr 0.2CoO 3 target material, chosen as a representative example. For all the three samples, namely NdCoO 3, Nd 0.8Sr 0.2CoO 3 and Nd 0.5Sr 0.5CoO 3, the X-ray diffraction patterns can be perfectly refined considering an orthorhombic unit cell (space group n. 62, Pnma ) with lattice constants reported in Table 1.Doping the Nd-site with of Sr induces a progressive expansion of the unit cell from 215.59(1) Å3 to 220.67(2) Å3. This relatively small expansion with respect to the difference in the ionic radii which, for the same coordination (12), are 1.27 Å for Nd 3+ and 1.44 Å for Sr 2+, is due to the concomitant oxidation of Co ions as the Sr-doping occurs. As a matter of fact, we expect that the Sr-doping will increase the hole concentration according to the following equilibria, which take into account the cation replacement and the (partial or total) compensation of oxygen vacancies with external oxygen:x O 32O 'Nd 3O 5O Nd V Sr 2SrO 22NdCoO +++⇔+••(1) x O 2O O 2h 4O 2V +⇔+•••(2)Starting from the pure and Sr-doped NdCoO 3 targets we deposited a series of thin films on single-crystalline substrates. We chose to grow the films on cubic SrTiO 3 (001) and LaAlO 3 (001). The choice has been done considering the lattice constants of the target materials with respect to the parameters of the substrate. In particular, the cubic axis for SrTiO 3 is 3.905 Å while for LaAlO 3 the pseudo-cubic axis is 3.785 Å. Considering a pseudo-cubic cell for the Sr-doped neodymium cobalt perovskites, we may expect an average parameter around 3.78 Å for the NdCoO 3, ~3.79 Å for the Nd 0.8Sr 0.2CoO 3 and ~3.81 Å for the Nd 0.5Sr 0.5CoO 3, respectively. So, in principle, we should be able to look at the role of substrate nature on the growth of the films and on the physical properties induced by possible modulation of the lattice parameters (i.e. strain).The deposited films have been, first of all, characterized through X-ray reflectivity (XRR) to determine their thickness. The estimated standard deviation in the determination of the film thickness by means of XRR is around 4-5%. Figure 2 reports, as an example, the XRR spectrum for the pure NdCoO3 thin film deposited on STO for about 30 minutes. In the inset it is highlighted a small part of the spectrum in order to put in evidence the Kiessig fringes which originate from the interference between successive layers of the film. The separation between two successive maxima in the curve is a direct and reliable measurement of the thin film thickness, t. However, the t value has been calculated from a fit of the experimental curve to a model curve by means of the LEPTOS software (Bruxer AXS). It turned out that the film thickness is around 50 nm, thus indicating a deposition rate of ~1.7 nm/min. For the three cobaltites, namely x=0, 0.2 and 0.5, we deposited 50 nm thin films on STO and LAO substrates. For the x=0.2 composition we also deposited thinner films, i.e. ~8.5 and 17 nm, in order to look at the role of film thickness. For all the deposited films the roughness estimated from the XRR are around or lower than 1 nm prior to oxygen annealing. After the thermal treatment the film roughness is significantly enhanced and reach, usually, values of few nm for the 50 nm thin films. Some more details about the samples roughness is given later in the text when discussing the AFM data. We note that in this work we were mainly interested in looking at thin films (< 100 nm), where the substrate-induced effects are more significant but the preparation route detailed here can be easily applied to the deposition of thicker films of hundreds of nanometers.A full x-ray diffraction characterization has been carried out on the as-deposited as well as annealed thin films of all the three compositions. In the following we will show some representative examples of the general behaviour shown by the samples.Let us look first at the role of post-deposition annealing treatment. Figure 3 reports the X-ray diffraction patterns for the Nd0.8Sr0.2CoO3 50 nm film (labelled as NSCO in Figure 3) measured immediately after the deposition (black line), and after the oxygen annealing (blue line), respectively; in addition, vertical red bars represent the STO peaks (also labelled in the Figure) while the green lines are relative to the orthorhombic Nd0.8Sr0.2CoO3 peaks.First of all we note that the thin films are highly oriented since in their X-ray patterns are clearly visible the only peaks related to those of the substrate. Before the annealing treatment the full-width-at-half-maximum (FWHM) of the peak centred around 48° is 0.352°; after the thermal treatment the peak width slightly reduces to 0.327°, thus suggesting the crystallinity of the films is not significantly improved by this relatively short treatment. From the X-ray patterns of Figure 3 we calculated the out-of-plane parameter for the 50 nm Nd0.8Sr0.2CoO3 thin film before and after the annealing treatment. In the first case the out-of-plane coordinate is 3.781(3) Å while after the heat treatment the parameter slightly contracts to 3.771(3) Å. This is most probably due to the partial oxidation of the cobalt ions with the creation of smaller oxidised species such as Co4+. This effect has been found to be a general trend for all the films.The role of the thermal treatment on thin film morphology was studied. Figure 4 shows the comparison between the morphology of the 50 nm thin film of Nd0.8Sr0.2CoO3 after the deposition (“as-deposited” sample) and after the thermal treatment (“annealed” sample). The as-deposited sample has a very low roughness of about 0.8 nm and is formed by nanocrystalline grains with an average size of about 10-15 nm characterized by a relatively narrow grain size distribution. The treatment at 900°C leads to a significant increase of both the grain size and the roughness, which is now around 5 nm. Peak in the grain size distribution after the thermal treatment is around 80 nm. Let us note, however, that the grains of the annealed sample are actually made of smaller grains of tents of nm; the high temperature treatment led to the formation of bigger island as a consequence of the coalescence of the previous, smaller, islands.Concerning the thin films orientation we can not be conclusive based on these XRD data. In fact, considering the pseudo-cubic cell parameters derived from the orthorhombic ones and assuming that the thin films adopt the Pnma crystal structure of the target material, two orientations of the films, with respect to the substrate, can be found: i) [010]-orientation, and thus the peaks in Figure 3 correspond to the (020) and (040) reflections of the cobaltite, and ii) [101]-orientation, with peaks in the pattern corresponding to the (101) and (202) cobaltite planes. This point is illustrated in more details in Figure1-SI available as Supporting Information, where, for a wider specular scan, the two sets of Miller indices for the two different epitaxial orientations of the Nd 0.8Sr 0.2CoO 3 film are indicated. Finally, we may not exclude that the substrate induced the growth of more symmetric films with respect to the target materials. In particular, cubic or more probable, tetragonal symmetry may not be ruled out based on these data. In the following we will use a pseudocubic approximation to evaluate the relaxation degree of the films.Let us now pass to discuss the role of Sr-doping on the thin films structure and morphology. Figure 5 shows the X-ray diffraction patterns for the three 50 nm thin films grown on STO (001) substrate for those two regions of the patterns where the (002) and (004) cubic diffraction peaks due to the perovskite are present. The out-of-plane lattice parameter for the three films is reported in Table 2. As can be seen, by increasing the Sr-concentration the parameter tends to expand, in accordance with the higher ionic radius of Sr with respect to Nd. We may note that the out of plane parameter for the three films is smaller than the pseudo-cubic parameter calculated from the bulk lattice constants. This is most probably directly connected to the tensile strain induced by the substrate, that is, a decreasing in the growth direction and expanding in the plane, which has an in-plane parameter of 3.90 Å. To evaluate the in plane lattice parameters and the relaxation degree of the films substratebulk substrate strained a a a a R −−= - in pseudocubic (tetragonal) approximation - high resolution reciprocal space maps (RSM) have been performed around the asymmetric cubic reflection (103)+ (grazing exit). The results for the 50 nm thick Sr-doped films with x =0, 0.2, 0.5 are shown in Figure 6A-C. The estimated in-plane lattice parameters are a =3.847(6) Å, 3.836(4) Å and 3.820(3) Å, leading to a relaxation degree R of about 50%, 60% and 90% respectively for the three compositions. We note that even if the film of composition Nd 0.5Sr 0.5CoO 3 appears to be to most relaxed among the analyzed samples, its epitaxial quality is still high as shown by the narrow rocking curve on the (002) pseudocubic reflection (Figure 7a) and also by the RSM around the symmetric (002) cubic reflection (Figure 7b) which shows that the width of the Bragg diffusion along the L direction (which depends on the out of plane texture) is thesame for the film and of the oriented single crystalline substrate. We also note in the (002) map the absence of the film truncation rod intensity, which indicates a three dimensional growth in agreement with AFM results.The same structural investigation has been carried out for the three 50 nm films on LAO (001). Figure 8 reports the results for the undoped sample, i.e. NdCoO3. First we note that also with the LAO substrate the film growth is completely oriented. In this case the lattice parameters of the substrate and those of the cobalt perovskites are closer with respect to the STO substrate. The pattern in Figure 8 shows the presence of just two peaks exactly located at the position of the (001) and (002) reflections of the LAO substrate. In the inset of the Figure it is presented the comparison of the diffraction patterns of the NdCoO3 film on LAO (red line) and of the substrate (black line). As can be appreciated, the only difference between the two patterns is the lack, in the film pattern, of the clear Kα1/Kα2 separation which is clearly visible in the substrate pattern. This means that the film has grown with lattice constants so close to those of the LAO substrates that is not possible to discriminate between them. This is also due to the FWHM of the films being of the order of 0.3° with respect to the FWHM of the single crystal peaks whish is around 0.05°. Overall, this result means that the out-of-plane parameter for the NdCoO3 film on LAO is 3.785(5) Å and considering that the in-plane parameter for the LAO material is 3.785 Å this suggests that the perfect match of the lattice parameters between the film and substrate leads to the growth of a nearly cubic film.For the other two compositions (patterns not shown), i.e. x=0.2 and 0.5, the out-of-plane parameter is bigger. For x=0.2 it is about 3.816(3) Å, to be compared to the pseudo-cubic parameter of the bulk phase being ~3.79 Å. In this case the film grows under the effect of a compressive strain, that is, an expanding in the growth direction and a decreasing in the plane. For the x=0.5 sample the effect is even higher, with a out-of-plane parameter close to 3.820(2) Å.We also note that different Sr-dopings lead to different morphologies. Figure 9 shows, as an example, the AFM measurements carried out on the x=0.5 50 nm film deposited on STO (001). This has to be compared to Figure 4, which reports the same data for the x=0.2 composition. As can be seen, byincreasing the Sr-doping, the surface roughness increases from 0.8 nm (x=0.2) to 1.1 nm (x=0.5) and it is clearly composed by very tiny grains which are practically undetectable on the surface of the x=0.2 film. A greater difference between the two samples is found looking at the surfaces of the annealed samples. The difference in the surface roughness between the two compositions is now higher: ~4.6 nm for the x=0.2 film and ~23 nm for the x=0.5 film. Also the morphology is significantly different, with elongated island for lower Sr-doping with respect to the round-shaped found for x=0.5. This difference is interesting and is most probably correlated to the different growth properties (both adsorption and diffusion processes) of the two compositions induced by the presence of a higher doping level of Sr. More details about this topic are beyond the scope of the present paper and will be considered in the future. However, for practical applications in which surface properties are crucial, the knowledge of this doping-dependence of both roughness and morphology has to be taken into account.For the Nd0.8Sr0.2CoO3 sample grown on STO we tried to look at the role of film thickness on the structural properties. Figure 10 shows the X-ray diffraction pattern for three thicknesses: 8.5, 17 and 50 nm. The out-of-plane parameter for the thicker film is, as mentioned above, 3.771(3) Å, while for the other two films it is slightly reduced to about 3.753(5) Å. For both 8.5 and 17 nm the diffraction peaks looks also wider with respect to the 50 nm sample being the 8.5 nm the one with the highest FWHM (ca. 1.2°). The presence of a smaller lattice parameter for the 8.5 and 17 nm samples suggest a stronger effect of the substrate on the film which induces a higher degree of strain; in both cases the samples are less relaxed with respect to the 50 nm sample. The presence of broader diffraction peaks for the thinner samples may be the result of the presence of a relaxation gradient or/and of an interface substrate/film layer contribution where the chemical composition of this layer is different with respect to that of the film “bulk”.Finally, the influence of substrate temperature during thin film deposition is put in prominence through Figure 11. Here, it is reported the XRD pattern of a NdCoO3 thin film deposited while heating the substrate to 400°C instead of heating to 700°C, as done for the other films considered in this work; all the other deposition parameters were kept constant. As can be appreciated, beside the cobaltite phaseother intense peaks appear in the pattern (marked with an asterisk). At present we are not able to undoubtedly associate these peaks to a precise phase. The peak located at about 38° might be the (102) and (201) reflections of the orthorhombic cobaltite, thus indicating that in order to obtain full oriented films the deposition has to occur by heating the substrate to high temperatures. Anyway, peak at around 65.5° can not be related to the cobaltite structure. As a consequence, another possibility is that these peaks originate from a second phase of still uncertain composition (which is not, however, any of the simple metal oxides of Co or Nd). We also remark that the FWHM of the NdCoO3 peaks is around 0.55° which strongly indicates that higher deposition temperatures are effective in improving the thin film crystallinity.ConclusionIn this paper we report, to the best of our knowledge, the first deposition of epitaxial thin films of Nd1-x Sr x CoO3 with x=0, 0.2 and 0.5 on single crystalline substrates (SrTiO3 and LaAlO3) and also the first deposition by means of rf-sputtering of a cobalt perovskite film.Our investigation has shown that epitaxial single phase thin films can be successfully deposited by means of rf-magnetron sputtering if the substrates is heated at high temperatures (700°C); lower substrate temperature has shown to lead to multi-phase materials with a low degree of crystallinity.All the deposited thin films posses a nanocrystalline morphology, even after the post-deposition annealing treatments with average grain size lower than 100 nm. This aspect is of significant interest, particularly when considering the possible applications of these materials as sensors and/or catalysts.Post-deposition annealing treatments in oxygen are efficient in increasing the oxygen content of the samples, as witnessed by the lattice constant reduction.All the films deposited on SrTiO3 have shown to be under a tensile strain while those on the LaAlO3 experience a compressive strain thus suggesting that at about 50 nm the films are not fully relaxed even after the thermal treatment. In addition, by reducing the film thickness more strained films have been found for the x=0.2 composition. This tuning of the film strain may lead to improved and unexpected magnetic and transport properties as well as induce positive effects on the catalytic/sensing activity of the film. Future work is planned in order to fully characterized the physical properties of the deposited films.AcknowledgementFinancial support from the Italian Ministry of Scientific Research (MIUR) by PRIN Projects (2004) is gratefully acknowledged. One of us (L.M.) gratefully acknowledges the financial support of the “Accademia Nazionale dei Lincei”. Dr. Oleg Gorbenko is gratefully acknowledged for useful discussion.“Supporting Information Available: Figure showing the two possible epitaxial orientations of the film with respect to the cubic substrate. This material is available free of charge via the Internet at .”References1.Tejuca L.G.; Fierro J.L.G.; Tascon J.M.D. Adv. Cat.1989, 36, 237-328.2.Steele B.C.H. Solid State Ionics1996, 86-88, 1223-1234.3.Doshi R.; Alcock C.B.; Carberry J.J. Catal. Lett. 1993,18, 337-343.4.Forni L.; Rossetti I. Appl. Catal. B-Environ. 2002, 38(1), 29-37.ne J.A.; Benson S.J.; Waller D.; Kilner J.A. Solid State Ionics1999, 21, 201-208.6.van Doorn R.H.E.; Bouwmeester H.J.M.; Burggraaf A.J. Solid State Ionics1998, 111(3-4), 263-272.7.Taskin A.A.; Lavrov A.N.; Ando Y. Phys. Rev. B2006, 73(12), 121101/1-121101/4.8.Taskin A.A.; Ando Y.Phys. Rev. Lett.2005, 95(17), 176603/1-176603/4.9.Taskin A.A.; Lavrov A.N.; Ando Y. Phys. Rev. B2005, 71(13), 134414/1-134414/28.10.Berggold, K.; Kriener, M.; Zobel, C.; Reichl, A.; Reuther, M.; Mueller, R.; Freimuth, A.;Lorenz, T., Phys. Rev. B.2005, 72, 155116/1-155116/7.11.He T., Chen J., Calvarese T.G., Subramanian M.A. Solid State Sci,.2006, 8, 467-469.12.Koshibae W., Tsutsui K., Maekawa S. Phys. Rev. B 2000, 62, 6869-6972.13.Robert R.; Romer S.; Reller A.; Weidenkaff A. Adv. Eng. Mat.2005, 7, 303-308.14.Radaelli P.G.; Cheong S-W. Phys. Rev. B2002, 66, 94408.15.Knizek K.; Novak P.; Jirak, Z. Phys. Rev. B2005, 71, 054420/1-054420/6.16.Nomerovannaya L.V.; Makhnev A.A.; Streltsov S.V.; Nekrasov I.A.; Korotin M.A.; ShiryaevS.V.; Bychkov G.L.; Barilo S.N.; Anisimov V.I. J. Phys. Cond. Matter2004, 16, 5129-5136.17.Maignan A.; Flahaut D.; Hebert S. Eur. Phys. J. B2004, 39, 145-148.18.Yan J.-Q.; Zhou J.-S.; Goodenough J.B. Phys. Rev. B2004, 69, 134409/1-134409/6.19.Knizek K.; Novak P.; and Jirak Z Phys. Rev. B2005, 71, 54420.20.Stauffer D.D.; Leighton C. Phys. Rev. B 2004, 70, 214414.。
水热合成法是一种常用的无机材料的合成方法,在纳米材料、生物材料和地质材料中具有广泛的应用。
水热/溶剂热合成法的主要步骤是将反应原料配置成溶液在水热釜中封装并加热至一定的温度(数百摄氏度)。
水热釜使得该合成体系维持在一定的压力范围内,在这种非平衡态的合成体系内进行液相反应往往能够制备出具有特殊优良性质的材料。
水热合成是指温度为100~1000 ℃、压力为1MPa~1GPa 条件下利用水溶液中物质化学反应所进行的合成它的优点:所的产物纯度高,分散性好、粒度易控制。
水热合成法是一种常用的无机材料的合成方法,在纳米材料、生物材料和地质材料中具有广泛的应用。
水热/溶剂热合成法的主要步骤是将反应原料配置成溶液在水热釜中封装并加热至一定的温度(数百摄氏度)。
水热釜使得该合成体系维持在一定的压力范围内,在这种非平衡态的合成体系内进行液相反应往往能够制备出具有特殊优良性质的材料。
[编辑]水热合成法的分类根据加热温度,水热法可以被分为亚临界水热合成法和超临界水热合成法。
通常在实验室和工业应用中,水热合成的温度在100-240℃,水热釜内压力也控制在较低的范围内,这是亚临界水热合成法。
而为了制备某些特殊的晶体材料,如人造宝石、彩色石英等,水热釜被加热至1000℃,压力可达0.3 GPa,这是超临界水热合成法。
[编辑]水热合成法的应用∙制备单晶∙制备有机-无机杂化材料∙制备沸石∙制备纳米材料锂离子电池阴极材料Li1+x Mn2O4的水热合成及表征Hydrothermal Synthesis and Characterization of Cathode Materials Li1+x Mn2O4 forRechargeable Lithium ion Batteries∙推荐CAJ下载∙PDF下载∙不支持迅雷等下载工具。
合成化学, CHINESE JOURNAL OF SYNTHETIC CHEMISTRY,编辑部邮箱,1999年04期[给本刊投稿]【作者】刘兴泉;李庆;于作龙;【Author】Liu,Xing Quan Li,Qing Yu,Zuo Long (Research and Development Center for Functional Materials, Chengdu Institute of Organic Chemistry, Chinese Academy of Sciences, Chengdu, 610041)【机构】中国科学院成都有机化学研究所!功能材料研究开发中心;成都;610041;【摘要】以化学MnO2(CMD)为Mn源,LiNO3和LiOH·H2O分别为Li源,采用无机水热合成法合成了锂离子二次电池的阴极材料Li1+xMn2O4(0≤x<1),并采用XRD,BET,TEM,TGA和电化学测试等手段对材料进行了表征。
Preparation of 200nm BaTiO 3Particles with their Tetragonality 1.010Via a Solid-State Reaction Preceded by Agglomeration-FreeMechanical ActivationRui Yanagawa and Mamoru Senna wFaculty of Science and Technology,Keio University,Yokohama 223-8522,JapanChie Ando,Hirokazu Chazono,and Hiroshi KishiMaterial Development Department,Taiyo Yuden Co.Ltd.,Gunma 370-3347,JapanWell-dispersed barium titanate (BaTiO 3;BT)with an average primary particle size o 200nm and lattice tetragonality 1.010,being very close to that of a BT single crystal,was obtained via a solid-state route with the aid of preliminary dry mechanical processing.The latter treatment not only activates the starting mixture but also decreases the particle sizes of individual ingre-dients and increases the homogeneity.All these favor to suppress grain growth of the product BT due to increasing nucleation site density,easing the nucleation at the given nucleation site,and decreasing the diffusion paths.These were confirmed by (i)mi-croscopy and particle size analysis to observe downsizing of in-dividual particulates without causing agglomeration;(ii)electron probe microanalysis to reveal increase in the homogeneity in a few micrometer regime;and (iii)X-ray photoelectron spectro-scopy to reveal mechanochemical effects across the solid–solid boundary of dissimilar particles.I.IntroductionDEMANDSfor small-grained and well-crystallized ferroelectricmaterials are ever increasing for microelectronic devices,among others,multi-layer ceramic capacitors (MLCC).There are a number of techniques other than a conventional solid-state route,notably,hydrothermal syntheses,1,2processes via a sol–gel route,3or starting from oxalates.4Not only their high cost but also various structural imperfections unavoidable due to their intrinsic nature make the latter processes not always particularly attractive.Conventional products of a solid-state reaction (SSR)are generally regarded as inferior to newer processes mentioned above,due mainly to the products with coarser grains and as-sociated lower homogeneity.It is well known that temperatures well above 10001C are required to obtain barium titanate (BaTiO 3;BT)powders by SSR.Mechanochemical effects are known to be quite effective in reducing the firing temperature for SSR.5–7There are a number of reports on BT synthesis using mechanochemical effects,8–10mostly as a primary attempt to reduce the firing temperature.Kong et al .11milled the starting mixture in a planetary mill in air and obtained BT by subsequent calcination at 8001C for 2h.Until now,however,a decrease in the tetragonality with decreasing grain size was thought to be a matter of course and hence unavoidable.Begg et al .12reported a sharp decrease in the tetragonality from a grain size below 600nm.Uchino et al .13kept the tetragonality as high as 1.0085at a grain-size ca.230nm,but it declined to 1.007with a grain sizeca.200nm.A decrease in the firing temperature usually lowers the crystallinity.The remaining major challenge is,therefore,to maintain high crystallinity and purity.In our previous study on fine-grained BT by SSR,we therefore elaborated on the use of mechanochemical effects in an optimal manner while keeping the homogeneity of the starting mixture as homogeneous as possible.A key issue in our present study is thus to suppress grain growth without sacrificing the crystallinity.More explicit-ly,we have focused our attention,among others,on increasing the homogeneity of the starting mixture by reducing the particle size without causing agglomeration,and enhancing nucleation at the contact points of dissimilar ingredient particles,BaCO 3and TiO 2.As the downsizing of the particles and increase in the surface reactivity are not always compatible,we made efforts to avoid agglomeration during mechanochemical treatment by us-ing milling balls with an abradable nylon coating.Our goal is to obtain phase-pure perovskite BT fine particles suitable for MLCC with a primary particle size as small as 200nm and with crystallographical properties as close to those of the BT single crystal as possible.II.Experimental Procedure(1)Sample PreparationStarting fine particulate materials,BaCO 3and TiO 2(Rutile),are the same as those that we used in our previous study.15The specific surface area was 12.5m 2/g for BaCO 3and 26.5m 2/g for TiO 2.An equimolar mixture was dispersed in deionized water and simply dried without particular mechanical dispersion to obtain sample W.Sample W was then subjected to hydrody-namic dispersion by conventional agitation.After this conven-tional procedure of mixing in a wet state,the mixture was dried to obtain sample S.Mechanical activation was then carried out on these samples in an entirely dry process using a laboratory-sized vibration ball mill (Heiko,HI-100,CMT Scientific,Sai-tama,Japan)with 10mm nylon-coated steel balls and a PTFE vial,for up to 10h to obtain samples Wb-n or Sb-n ,where n de-notes the milling time in hours.We heated these samples in air at a constant rate of heating,5K/min,up to predetermined tem-peratures between 8001and 10501C,and maintained the samples at these maximum temperatures for 2h and air quenched.(2)CharacterizationThe specific surface area was determined by a BET method using a conventional vacuum line with N 2at its boiling point.Particle size and morphology were determined by transmission electron microscopy (TEM,JEOL,JEM-200CX,Tokyo,Japan)with the sample dispersed on a carbon-coated microgrid,and scanning electron microscopy (SEM,Hitachi,S-4700,Tokyo,Japan).The particle size distribution of the materials before calcina-tion was determined by a laser diffraction—scattering particle W.Suchanek—contributing editorwAuthor to whom correspondence should be addressed.e-mail:senna@applc.keio.ac.jpManuscript No.20325.Received March 18,2006;approved November 8,2006.J ournalJ.Am.Ceram.Soc.,90[3]809–814(2007)DOI:10.1111/j.1551-2916.2007.01498.x r 2007The American Ceramic Society809size analyzer (Beckman Coulter,Japan,LS230,Tokyo,Japan)after the samples were ultrasonically dispersed for 10min.We also intermittently ultrasonicated during measurement.The de-gree of dispersion or homogeneity of the reaction mixture in a particulate regime with a resolution power of a few micrometers was evaluated by the relative standard deviation of the local molar ratio or the coefficient of variation,s /x ,where s and x are,respectively,the standard deviation and average value of the local molar ratio,Ba/Ti.8The reciprocal of the variation coef-ficient serves as an index of the homogeneity.The change in the electronic states of the mixture was eval-uated by X-ray photoelectron spectroscopy (XPS,JEOL JFC-1100).X-ray diffractometry (XRD)data were obtained from a diffractometer with Cu K a (Rigaku,Rad-C,Tokyo,Japan).The detailed conditions of XRD are as follows:divergence slit 11;Voltage 40kV Scattering slit 11;current 50mA Receiving slit 0.15mm;scanning mode Fixed Time Scanning time 1.5s;and scanning Step 0.011.We carried out precision XRD for Rietveld analysis in the 2y range from 101to 1201.The powder diffrac-tion data were refined by Rietveld analysis by using Rietan-2000.14We also used high-temperature XRD with the same dif-fractometer at a constant rate of heating,10K/min.III.Results and Discussion(1)Granulometrical and Crystallographical Changes Due to Mechanical TreatmentWe always observed bimodal particle size distribution profiles,as shown in Fig.1.On comparing with the electron micrographs shown in Fig.2,we confirmed two distinct groups of the par-ticles,i.e.an elongated larger one and an equiaxed smaller one,to correspond to BaCO 3and TiO 2,respectively.From the change in the particle size distribution profiles with milling time,we distinguished individual ingredients.It is particularly noteworthy that we did not observe any severe and coherent agglomeration,often regarded as an unavoidable consequence of milling a reactive mixture in air.The degree of mixing homogeneity,as evaluated from the reciprocal of the variation coefficient of the local atomic ratio,x /s ,increased significantly with mechanical dispersion (from sample W to sample S),as shown in Table I.Note that the spe-cific surface area increased slightly,but never decreased even after prolonged dry milling.This is in line with the absence of the hazardous coherent and severe agglomeration mentioned above.As shown in Fig.3,all the mixtures comprise three distinct phases,i.e.BaCO 3,TiO 2(anatase),and TiO 2(rutile),without any remarkable crystallographical changes upon milling.TheFig.1.Particle size distribution profiles for samples W dry vibro-milled for up to 10h.Fig.2.Electron micrographs of the starting mixtures.Upper row:scanning electron microscopy (SEM);Lower row:transmission electron microscopy (TEM);Left column:Sample W;Right column:Sample Wb-10h.810Journal of the American Ceramic Society—Rui et al.Vol.90,No.3average lattice distortion and crystallite size of BaCO3obtained from the results of XRD after Rietveld refinement are displayed as a function of milling time in Fig.4.While no appreciable changes were observed in the crystallite size and lattice distor-tion by mechanical dispersion,subsequent dry milling brought about a significant increase in the lattice distortion of BaCO3.A closer look at Fig.3reveals that the relative diffraction peak intensity from BaCO3(200)2y527.71decreased preferentially with respect to TiO2(rutile)(110)at2y527.51,as recognized from the change in the shape of the apparently bimodal peaks. This is in line with the preferential crystallographical degrada-tion of BaCO3to that of TiO2mentioned above.(2)Chemical Changes by MillingThe results of O1s profiles of XPS are summarized in Table II. We always observed two O1s peaks,with higher and lower binding energies due to oxygen atoms of BaCO3and TiO2,re-spectively.Note that the milling generally decreases the separa-tion of two O1s peaks,D BE,as shown in Table II.This implies that the state of individual oxygen atoms bound either to Ba or Ti is influenced by those bound to Ti or Ba,respectively,as a consequence of dry milling.The observed XPS peak shift may not,however,be a direct consequence of the formation of the hetero-bridging bonds,Ba–O–Ti,like those in BT.This might have resulted in a more appreciable change in the binding energy amid those of Ba–O and Ti–O.(3)SSR ProcessesBy high-temperature in situ XRD shown in Fig.5(a),we ob-served the second phase,Ba2TiO4(B2T),in sample W,partic-ularly at the temperature range from8501to9501C.The second phase persisted even after homogenization,i.e.in sample S,although its relative amount was reduced substantially at above 9001C.In sharp contrast,dry milling completely suppressed the formation of B2T,as shown in Fig.5(b).All the products were phase-pure BT at temperatures above10501C,as shown in Fig.6.The diffractograms reveal the peak split of the BT be-tween(001)and(100)to demonstrate the well-developed tetra-gonality.A quantitative discussion is given below.(4)Crystallographical Properties—Compatibility of Small Grain Size and High TetragonalityBy refining the results of XRD based on the Rietveld analyses, we have obtained lattice parameters and hence tetragonality. Some representative analytical data are given in Table III with their reliability factors.Note that the tetragonality reaches 1.010,which is very close to the value of the BT single crystal, 1.011.Typical scanning electron micrographs of the samples cal-cined at10501C for2h are shown in Fig.7.More homogeneous particle size distribution of BT as a consequence of preliminary dry milling is visible.The average particle size was obtained from the image analyses of the SEMfigures.The values are shown in Table IV.The change in the particle size with calci-nation temperature is given in Fig.8.Remarkable grain growth suppression for samples Bb-10h and Wb-10h is quite obvious.The average crystallite size obtained by XRD is plotted in Fig.9against the particle size determined from the scanning electron micrographs.Note that dry milling increases the crys-tallite size to a value more than half the particle size.The par-ticles in the calcined product are,therefore,closer to single crystals.We primarily attribute the grain-growth suppression to the increase in the number density of the contact pointsbetweenTable II.O1s Binding Energy and its Difference Betweenthose of Barium Carbonate and Titanium Dioxide,D BE inSome of the Reactant MixturesSampleBE(eV)O1s(B)O1s(T)D BEW533.4529.9 3.5S533.1530.2 2.9Wb-2h532.7530.0 2.7Wb-5h532.9530.1 2.8Wb-10h532.8530.0 2.8Sb-5h532.8530.2 2.6 Table I.Variation Coefficient and Specific Surface Area ofthe Reactant MixturesSample x/s Specific surface area(m2/g)W 3.115.6S13.515.7Wb-2h9.417.7Wb-5h11.516.1Wb-10h16.918.1Sb-5h15.918.9March2007Preparation of BaTiO3Particles Via a Solid-State Reaction Preceded by Agglomeration-Free Mechanical Activation811the dissimilar species,enhanced rate of nucleation at those con-tact points due to mechanical activation,and a decrease in the diffusion path due to particle size reduction.15Finally,we plot the tetragonality against the particle size.Figure 10demonstrates that the product BT particles after pro-longed dry milling retain their tetragonality ca.1.010,while maintaining the particle size below 200nm.Some of the liter-ature data are also given in Fig.10.Uchino et al .13and Begg et al .12tried to obtain fine grained BT by hydrothermal andoxalate methods,respectively.As shown in Fig.10,these meth-ods were not able to avoid sharp reduction of the tetragonality with decreasing particle size.They attribute the reduction to (i)the surface tension generating compressive stress or (ii)the im-purities including H 1and OH Àfrom the adsorbed water mol-ecules,entrapped in the lattice.13Both of these processes favor cubic symmetry reducing the tetragonality.The present solid-state route is free from these drawbacks.IV.ConclusionAs a result of size reduction and increased homogeneity without sacrificing the well-dispersed state of the starting mixturebyFig.5.High-temperature X-ray diffractograms for the samples:(a)W (left)and S (right)and (b)Wb-10h (left)and Sb-10h(right).Fig.6.X-ray diffraction profiles for samples calcined at 10501C for 2h.Table ttice Parameter and TetragonalitySampleTemperature (1C)Lattice parameterTetragonalityacc /aS 950 3.999 4.029 1.0051000 3.998 4.032 1.0071050 3.993 4.034 1.008Sb-5h 950 3.995 4.032 1.0091000 3.996 4.033 1.0091050 3.995 4.035 1.010Wb-10h950 3.997 4.033 1.0091000 3.996 4.034 1.0091050 3.995 4.035 1.010812Journal of the American Ceramic Society—Rui et al.Vol.90,No.3vibro-milling in air,the temperature of BT formation was low-ered by more than 150K with complete suppression of the for-mation of second phases like B 2T.This in turn resulted in the formation of well-crystallized BT with an average particle size less than 200nm and tetragonality as high as 1.010.We attribute all these positive effects to the increase in the number density of the contact points between dissimilar species,BaCO 3and TiO 2,the decrease in the diffusion path due to particle downsizing,and enhanced rate of nucleation.References1W.J.Dawson,‘‘Hydrothermal Synthesis of Advanced Ceramic Powders,’’Am.Ceram.Soc.Bull.,67,1673–8(1988).2D.Hennings,C.Metzmacher,and B.Schreinemacher,‘‘Defect Chemistry and Microstructure of Hydrothermal Barium Titanate,’’J.Am.Ceram.Soc.,84[1]179–82(2001).Fig.7.Scanning electron micrographs of the samples annealed at 10501C for 2h obtained from sample W (upper row)and Wb-10h (lower row).Table IV.Average Particle Size and its Variation CoefficientSample9501C10001C10501CParticle size (m m)Coefficient of variation (%)Particle size (m m)Coefficient of variation (%)Particle size (m m)Coefficientof variation (%)W0.1247.50.1553.30.4042.1S0.1040.60.1241.60.3538.6Wb-5h 0.1740.10.1840.80.3540.4Wb-10h 0.1832.50.2036.40.2034.2Sb-5h 0.1639.90.2033.80.3340.43S.van der Gijp,M.H.J.Emond,A.J.A.Winnubst,and H.Verweij,‘‘Preparation of BaTiO3by Homogeneous Precipitation,’’J.Eur.Ceram.Soc., 19,1683–90(1999).4D.H.S.Potdar,S.B.Deshpande,and S.K.Date,‘‘Chemical Coprecipitation of Mixed(Ba1Ti)Oxalates Precursor Leading to BaTiO3Powders,’’Mater. Chem.Phys.,58,121–7(1999).5M.Senna,‘‘Incipient Chemical Interaction Between Fine Particles Under Mechanical Stress—Feasibility of Producing Advanced Materials Via Mechano-chemical Routes,’’Solid State Ionics,63/65,3–9(1993).6M.Senna,‘‘Charge Transfer and Hetero-Bonding Across the Solid–Solid Interface at Room Temperature,’’Mater.Sci.Eng.,A304/306,39–44(2001).7M.Senna,‘‘Preparation of Functional Materials Via Non-Conventional Routes,’’Ann.Chem.Sci.Mater.,27,3–14(2002).8Y.Arai,T.Yasue,H.Takiguchi,and T.Kubo,‘‘Mechanochemical Effect on the Solid State Reaction Between Barium Carbonate and Titanium Dioxide,’’J.Chem.Soc.Jpn.,9,1611(1974).9O.Abe and Y.Suzuki,‘‘Synthesis and Study of the Properties of Barium Titanate Powder by the Mechanochemical Process,’’J.Soc.Powder Technol.Jpn., 31,176(1994).10C.Gomez-Yanez, C.Benitez,and H.Balmori-Ramirez,‘‘Mechanical Activation of the Synthesis Reaction of BaTiO3from a Mixture of BaCO3 and TiO2Powders,’’Ceram.Int.,26,271(2000).11L.B.Kong,J.Ma,H.Huang,R.F.Zhamg,and W.X.Que,‘‘Barium Titanate Derived from Mechanochemically Activated Powders,’’J.Alloy Comp., 337,226(2002).12B.D.Begg,E.R.Vance,and J.Nowotny,‘‘Effects of Particle Size on the Room Temperature Crystal Structure of BaTiO3,’’J.Am.Ceram.Soc.,77[12] 3186–92(1994).13K.Uchino, E.Sadanaga,and T.Hirose,‘‘Dependence of the Crystal Structure on Particle Size in BaTiO3,’’J.Am.Ceram.Soc.,72[8]1555–8 (1989).14F.Izumi and T.Ikeda,‘‘A Rietveld-Analysis Program RIETAN-98and Its Applications to Zeolites,’’Mater.Sci.Forum,321–324,198–203(2000).15C.Ando,R.Yanagawa,H.Chazono,H.Kishi,and M.Senna,‘‘Nuclei-Growth Optimization for Fine-Grained BaTiO3by Precision-Controlled Mechanical Pretreatment of Starting Powder Mixture,’’J.Mater.Res.,19, 3592–9(2004).&814Journal of the American Ceramic Society—Rui et al.Vol.90,No.3。
专利名称:A PROCESS FOR THE PREPARATION OF HIGHLY PURE CRYSTALLINE QUINAPRILHYDROCHLORIDE发明人:DESAI, Parimal, Hasmukh,SALVI, Narendra, Jagannath,PATRAVALE, Bharat, Kumar,Surendra,PARAB, Seema, Susheel申请号:IN2006000367申请日:20060913公开号:WO07/054966P1公开日:20070518专利内容由知识产权出版社提供摘要:A simple, efficient and industrially feasible process for the preparation of crystalline quinapril hydrochloride in high purity and good yield is disclosed. A solution of benzyl ester of quinapril hydrochloride is prepared with an alkyl nitrile and is subjected to catalytic hydrogenolysis, after pH. adjustment of the solution to 0.8 to 1 by adding 3 to 17% solution of hydrogen chloride in dry ether or dry alkyl nitrile. The molar ratio of the benzyl ester of quinapril and hydrogen chloride is selected to be 1.0: 1.15: to 1.0: 1.35. Catalytic hydrogenolysis is carried out with hydrogen in the presence of Pd/C catalyst at a pressure of 40 to 150 psi and a temperature of 10-40° C. The solvent is distilled out to 50 to 70 % of its volume to obtain crystalline quinapril hydrochloride, which is washed with n-pentane and dried.申请人:DESAI, Parimal, Hasmukh,SALVI, Narendra, Jagannath,PATRAVALE, Bharat, Kumar, Surendra,PARAB, Seema, Susheel地址:IN,IN,IN,IN,IN国籍:IN,IN,IN,IN,IN代理机构:MADAN, Jose, A.更多信息请下载全文后查看。