图表作文的写作要领
- 格式:doc
- 大小:61.50 KB
- 文档页数:6
如何描写图表作文
1认真读图,不要缺失任何一个部分。
图表作文总的来说是结合说明和表达观点的文章,所以首先就要审好题,无论是以什么形式展现出来的图表作文,我们首先都要看清楚说的内容以及它的数据,分析它要我们写什么。
2三段论——第一段(描述段):
考试的作文三段论通常是跑不掉的,见到英语考试有图表作文不要慌。
我们还是把作文分为三部分,第一段对图表来一个总体的描述,简单概括一下图表的内容,基本就不会有什么岔子了。
3三段论——第二段(分析段):
分析图表内容,这一段就不是概括那么简单了,我们要横向地、纵向地对图表进行分析,特别是数据的最大值、最小值等等,通常图表作文都会有一个主题,我们分析之余要往这个方向靠。
不要罗列数字,要分析出规律。
4三段论——第三段(表达段):
这一段通常就文章的大意,或者顺着出题者的意思去进行一个“自己的意见”补充,也就是对这个现象或者是情况作出一种总结和评论。
这一点大家写作文通常都会有,就不用太担心了。
5检查与修改:
写完一篇作文后,如果有时间,尽量去检查一下单词有没有错误,因为图表作文通常都要用到一些平时不常用的短语,注意看看有没有对图的描述还有没有其他的遗漏,如果有尽量作出一点补充。

如何描写图表作文
图表作文是一种特殊的文章形式,它结合了图形和文字,能让文章更加直观地表达内容,从而更有助于帮助读者理解作者所想传达的信息。
在学习如何正确描写图表作文时,有几个要点需要注意。
首先,要清楚所描写的图表类型,包括饼图、柱状图、折线图以及其他任何可能的图表。
这样做可以使您更容易理解图表的大意,然后写出更有层次的描述,从而更容易把重点传递给读者。
其次,要仔细分析图表中的信息,从而了解每个数据点的准确意义。
这一步对于正确描述图表内容至关重要,因为假如误读数据,就会出现错误的描述信息。
第三,要运用相关的语法结构,以更加准确地描述图表。
比如,如果图表显示某个元素占比例,可以用“数据显示,XXX占据了XX%”来组织观点;如果图表描述某个变量的变化趋势,可以用“数据表明,XXX的数据呈现XX的趋势”这一类的句式来描述。
最后,要把握好写作结构,如正文开头部分,要先简述图表的总体类别和整体内容,以便读者可以很快把握文章的重点;然后进行详细描述,让读者能清晰地理解图表中的各个数据点;最后要给出总结和归纳,把各个数据点联系到一起,以便最终形成一个完整的结论。
总之,描写图表作文需要考虑众多要点,不仅要正确处理文字,还要正确分析各个数据点的准确意义,需要结合读者的理解能力,注意使用熟悉的句式,以及关注文章的结构,努力将信息展示得更加清晰、准确。
只有掌握了这些技巧,才能写出一篇优秀的图表作文,最
终让读者得到最全面的信息。

写作图表作文时应该注意的几个方面:1. 要对图表作简要的主题介绍。
2. 切忌不加详细分析、罗列数字。
要进行横向、纵向的比较,寻找规律性的信息,通过计算找出部分与整体、部分与部分之间的关系,如增减的绝对数字、百分比、分数或倍数等。
3. 分析原因,寻找规律,把握主题。
4 根据分析所得信息得出结论。
(1)考生应仔细研究题目以及提示信息,认清图表中的数字、线条、阴影等部分的变化趋势和走向,抓住其主要特点,然后根据图表所显示的中心信息确定内容层次以及主题句。
(2)考生应该仔细研究图表所给出的大量信息,从中选取最重要,最有代表性的信息,然后根据全文的主旨去组织运用所获取的关键信息。
切忌简单地罗列图表所给出的信息。
(3)图表作文一般采用的时态为一般现在时,但如果图表中给出了具体时间参照,考生则应对时态进行相应的调整。
(4)图表作文有一些固定句型和表达法,考生应对此融会贯通。
(5)图表作文可以细分为表格,曲线图、柱形图和饼形图。
除了上述共同要点,考生还应了解这四种图在写作方面的不同特点。
——表格可以表示多种事物的相互关系,所以考生要对表格中所给出的大量数字进行比较分析,从中找出其变化规律。
——曲线图常表示事物的变化趋势,考生应认真观察坐标系所显示的数据信息,并且密切注意交汇在坐标横轴和纵轴上的数字及单位。
——柱形图用来表示各种事物的变化情况及相互关系,要求考生通过宽度相等的柱形的高度或长度差别来判断事物的动态发展趋势,因此考生应密切关注坐标线上的刻度单位及图表旁边的提示说明与文字。
——饼形图表示各事物在总体中所占的比例及相互关系,旨在要求考生准确理解并阐述一个被分割成大小不等切片的饼形图所传达的信息。
考生应清楚掌握部分与整体,部分与部分之间的相互关系,这种关系通常是以百分比的数字形式给出的。
(6)列出各段主题句。
考生可以根据所给提纲或已知信息列出每段的主题句,为全文的展开做好铺垫。
(7)围绕主题句完成段落的展开。
一、表格图图表作文的写作要点1横向比较。
介绍横向各个数据的区别,变化和趋势2不需要将每一个数据分别说明,突出强调数据最大值和最小值3最对比时要总结出数据对比最悬殊的和最小的二、曲线图图表作文的写作要点1极点说明。
即,对图表当中最高的,最低的点要单独进行说明2趋势说明。
即,对图表当中曲线的连续变化进行说明,如上升,下降,波动,持平3交点说明。
即,对图表当中多根曲线的交点进行对比说明三、饼状图图表作文的写作要点1介绍各扇面及总体的关系2各个扇面之间的比较,同类扇面在不同时间,不同地点的比较3重点突出特点最明显的扇面:最大的,最小的,互相成倍的四、综合图图表作文的写作要点1不求甚解,不拘泥于细节2分门别类,分段落详细介绍各个图表3不画蛇添足,主观臆断或猜测图表之间的关系以上就是这四类图表作文的写作要点介绍,对于各个图表的特点和描写的重点的不同进行了对比,大家可以在备考图表作文考试的时候,提前进行适当的参考和借鉴。
英语四级图表作文讲解及参考范文图表作文也是四(六)级考试中常见,而且被认为是一种较难的作文形式。
图表作文就是把非文字信息(通常为各种图表表示的数字信息等)转换成文字信息的一种作文。
它要求我们用文字来描述非文字性的图表或对图表显示的关系作解释说明。
第一节图表作文的出题形式和写作要领一、图表作文常见出题形式图表作文一般在题目中给出作文的标题和一个或几个统计表格、圆形图、曲线图或条形图,有时还用英文或中文提纲的形式给出提示,要求我们:1)用文字描述图表,客观解释图表中所传递的信息,并找出某种规律或趋势; 2)就图表中所反映的某种趋势或问题分析其原因或后果。
图表作文着重说明事实,常常是通过对图表中所反映的具体数据的说明、分析、比较,对某种事物或现象的事实或变化情况等加以说明,并提出结论或看法。
因此,图表作文常常采用议论文体的写作方法。
写好图表作文,关键在于能否读懂图表中所提供的信息,把握各信息间的联系,用准确流畅的语言把这一信息表达出来,并就这一信息发表自己的看法。

怎样写图表分析作文纵观近几年高考,英语书面表达大致分为材料作文、图表作文和开放作文。
且材料作文逐渐被图表作文取代,图表分析作文就是将数据、图像所包含的信息,转化为表意的说明文字。
图表分析作文通常比较复杂,学生不仅要弄清提示,还要看懂所给的图表和数据。
由于这类试题提示内容少,信息点分散,审题时一定要领会作者的出题意图,弄清主题再动笔:1.单纯描述解释图表信息,按图表所示内容如实表达,不加评论。
2.通过叙述图表(或图画)中的内容和数字变化来分析原因,发表议论。
(一) 柱状图(BAR CHART)人们日常生活中事物的变化情况通常可以用宽度相等的柱状图形来表示,柱状图的高度差别用来说明事物的动态发展趋势,同时要注意图例说明和坐标刻度所提示的信息。
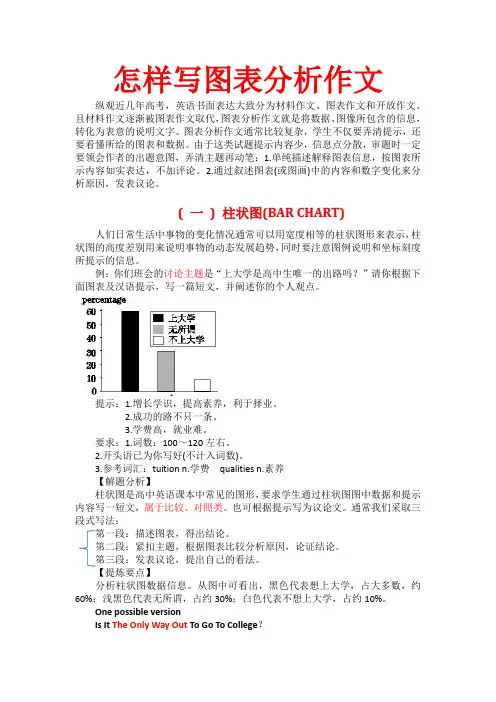
例:你们班会的讨论主题是“上大学是高中生唯一的出路吗?”请你根据下面图表及汉语提示,写一篇短文,并阐述你的个人观点。
提示:1.增长学识,提高素养,利于择业。
2.成功的路不只一条。
3.学费高,就业难。
要求:1.词数:100~120左右。
2.开头语已为你写好(不计入词数)。
3.参考词汇:tuition n.学费qualities n.素养【解题分析】柱状图是高中英语课本中常见的图形,要求学生通过柱状图图中数据和提示内容写一短文,属于比较、对照类。
也可根据提示写为议论文。
通常我们采取三段式写法:第一段:描述图表,得出结论。
第二段:紧扣主题,根据图表比较分析原因,论证结论。
第三段:发表议论,提出自己的看法。
【提炼要点】分析柱状图数据信息。
从图中可看出,黑色代表想上大学,占大多数,约60%;浅黑色代表无所谓,占约30%;白色代表不想上大学,占约10%。
One possible versionIs It The Only Way Out To Go To College?We had a discussion about whether it is the only way out for senior students to go to college. Views vary from person to person.The majority of us consider it very necessary to go to college. They think it can widen their knowledge and improve their qualities. Only in this way can they find better jobs after graduation. Very few students,that is about ten percent of the students,think it no use going university,because the tuition is too high for their family to afford. What's more,it's rather hard for college graduates to seek satisfactory jobs. Thirty percent of the students,however,believe “All roads lead to Rome.”Therefore it doesn't make any difference whether they go to college or not.In my opinion,we can receive a better education at college so that we can serve our motherland.【语言亮点】①词汇。

一、表格图图表作文的写作要点1横向比较。
介绍横向各个数据的区别,变化和趋势2不需要将每一个数据分别说明,突出强调数据最大值和最小值3最对比时要总结出数据对比最悬殊的和最小的二、曲线图图表作文的写作要点1极点说明。
即,对图表当中最高的,最低的点要单独进行说明2趋势说明。
即,对图表当中曲线的连续变化进行说明,如上升,下降,波动,持平3交点说明。
即,对图表当中多根曲线的交点进行对比说明三、饼状图图表作文的写作要点1介绍各扇面及总体的关系2各个扇面之间的比较,同类扇面在不同时间,不同地点的比较3重点突出特点最明显的扇面:最大的,最小的,互相成倍的四、综合图图表作文的写作要点1不求甚解,不拘泥于细节2分门别类,分段落详细介绍各个图表3不画蛇添足,主观臆断或猜测图表之间的关系以上就是这四类图表作文的写作要点介绍,对于各个图表的特点和描写的重点的不同进行了对比,大家可以在备考图表作文考试的时候,提前进行适当的参考和借鉴。
英语四级图表作文讲解及参考范文图表作文也是四(六)级考试中常见,而且被认为是一种较难的作文形式。
图表作文就是把非文字信息(通常为各种图表表示的数字信息等)转换成文字信息的一种作文。
它要求我们用文字来描述非文字性的图表或对图表显示的关系作解释说明。
第一节图表作文的出题形式和写作要领一、图表作文常见出题形式图表作文一般在题目中给出作文的标题和一个或几个统计表格、圆形图、曲线图或条形图,有时还用英文或中文提纲的形式给出提示,要求我们:1)用文字描述图表,客观解释图表中所传递的信息,并找出某种规律或趋势; 2)就图表中所反映的某种趋势或问题分析其原因或后果。
图表作文着重说明事实,常常是通过对图表中所反映的具体数据的说明、分析、比较,对某种事物或现象的事实或变化情况等加以说明,并提出结论或看法。
因此,图表作文常常采用议论文体的写作方法。
写好图表作文,关键在于能否读懂图表中所提供的信息,把握各信息间的联系,用准确流畅的语言把这一信息表达出来,并就这一信息发表自己的看法。

图表作文写作的七项基本原则一、长短句原则写一个短小精辟的句子,可以起到画龙点睛的作用。
而且如果我们把短句放在段首或者段末,也可以揭示主题:As a creature, I eat; as a man, I read. Although one action is to meet the primary need of my body and the other is to satisfy the intellectual need of mind, they are in a way quite similar.如此可见,长短句结合,抑扬顿挫。
强烈建议:在文章第一段(开头主要意思,然后在阐述几个要点的时候采用先短后长的句群形式,)用一长一短,且先长后短;在文章主体部分,要先用一个短句解释定会让主体部分妙笔生辉!文章结尾一般用一长一短就可以了。
二、主题句原则国有其君,家有其主,文章也要有其主。
一定要写一个主题句,放在文章的开头(保险型)或者结尾,让读者一目了然。
三、一二三原则领导讲话总是第一部分、第一点、第二点、第三点、第二部分、第一点如此罗嗦。
可毕竟还是条理清楚。
考官们看文章也必然要通过这些关键性的“标签”来判定你的文章是否结构清楚,条理自然。
1)to start with, next, in addition, finally2)first and foremost, besides, last but not least3)most important of all, moreover, finally4)on the one hand, on the other hand5)for one thing, for another thing四、短语优先原则写作时,尤其是在考试时,如果使用短语,有两个好处:其一、用短语会使文章增加亮点,如果老师们看到你的`文章太简单,看不到一个自己不认识的短语,必然会看你低一等。
图表作文写作指南写作指南:图表作文图表作文是在文章中使用图表来解释、分析和说明数据,以更清晰地展示信息和结论。
在写作这类作文时,有一些关键点和步骤可以帮助你组织思路并有效地传达你要表达的信息。
以下是图表作文的写作指南,包括准备、写作和审查阶段,每个阶段涉及的关键点和步骤:准备阶段:1. 仔细阅读题目和图表:仔细理解题目并观察图表的数据,包括数据类型、时间范围和单位等。
2. 理解图表的主要内容:图表通常包含主要趋势、变化和关系。
注意图表中的最大值、最小值和重要变化点。
3. 组织信息:将图表中的数据和趋势进行分类和排序,找到其中的相关性和区别。
写作阶段:1. 引言:简要描述图表的主题,并指出你要解释或分析的主要趋势和变化。
这是给读者提供全局视图的一部分。
2. 主体段落:根据图表中的数据、趋势和关系,组织你的主要观点和论据。
每个主体段落都应该专注于一个特定的方面或变化。
a. 描述数据和趋势:使用清晰的语言描述图表中的数据和趋势。
强调重要数字和变化点。
b. 分析原因和结果:解释导致数据和趋势的可能原因,并分析可能的结果和影响。
c. 进行比较和对比:将不同的数据进行比较和对比,强调相似之处和差异。
d. 用例子和证据支持观点:用例子、事实和数据支持你的观点和结论。
e. 使用合适的连接词:使用适当的连接词和短语,如"moreover"、"in addition to"、"on the other hand" 等,使你的论述连贯流畅。
3. 结论:总结你的观点和结论,强调图表中的关键变化和趋势。
对图表可能的局限性进行讨论,提出可能的解决方案或预测。
审查阶段:1. 检查语法和拼写错误:审查你的文章,确保没有语法和拼写错误。
这可以通过使用语法和拼写检查工具来帮助你。
2. 检查数据和数字:确认你引用的数据和数字准确无误。
如果可能,可以重新计算或交叉验证数据。
3. 重新检查结构和逻辑:再次检查你的段落结构和论证的逻辑性。

图表写作1.语言要求图表作文十分客观因此其中不应当出现第一人称,只是一种客观表述,而不应当包含主观的内容,在文章的措辞上就表现出一种客观的态度。
2.内容方面趋势描写图表中常常会反映出某个事物的趋势,有总体趋势也有局部趋势,因此趋势描写便成为图表作文中必不可少的内容。
图表的目的是通过对比对照来说明问题,因此文章也应当描写有关对比对照的趋势。
数据导入图表的另外一个特点是表中会出现大量数据,因此图表作文中也一定要导入数据。
只是泛泛地谈某种趋势是远远不够的,必须有具体的数据来支持。
例如文章中说某物在增长,后面就应该导入数据来证明事物的增长。
没有数据的导入,就必定会导致内容上遗漏重要信息。
3.结构要求图表作文要求结构清晰、层次分明。
一定要注意衔接手段的使用。
开头部分:图表作文的首段必须交代三个要素:图表研究的时间段、研究的对象和研究所采用的数据形式(是具体的数字还是百分比),应当争取将这三个要素在一句话里面说清楚,实际上就是把题目中描述图表的那一句话用自己的语言描述并拓展一下就可以了。
最多两句话。
主体段落:主体段落应当描写单方面的趋势,根据趋势的分类来决定主体段落应当划分为几个自然段。
结尾部分:图表通过对具体数据的对照和对比来说明问题,因此在图表作文的结尾部分要写出对照对比的趋势,以及从这个趋势中得出一个什么样的结论。
4. 图表作文常用句型1.表示“说明”的句子结构The table/chart/diagram/graph shows (that)…The figures/statistics show (that)…The diagram shows/describes/illustrates how …According to the / As (is) shown in the/ As can be seen from the table/chart/diagram/graph/figures…It can be seen from the/ We can see from the/ it is clear (apparent) from the table/chart/diagram/graph/figures that…2.表示“数据”的句子结构Australia and the UK both had 10%.The profit rose to 10%.The monthly profit increased/fell by 10% from 10% to 20% /from 20% to 10%.The profit remained steady at 10%.The profit peaked at just over 10%.Thailand had the largest percentage/number (10%/245) of the students.10% of the students were from the People’s Republic of China. Thailand accounted for 10% of the students.They made twice/three times/four times the profit/the percentage of profit in May than in March.The profit percentage/percentage of profit doubled (increased/decreased three-fold) from March to May.Company A’s profit percentage rose steadily, whereas that of Company B fell slightly.There were more males than females (10% and 5% respectively).另外还要注意下列表中表达数字和统计数据的方式:3.表示“数据变化”的句子结构1)表示增加、较少和波动可使用下面两种结构来表达:Verb + adverb formAdjective + noun form2)表示变化不大或没有变化使用下列句型:The number of (cars sold) remained steady (stable) / stayed the same from … to…/between … and…There was little / hardly any/ no change in the number of (cars sold) from … to… / between … and …3) 表示曲线图上最高点和最低点使用下列句型:The monthly/ the figures/ the situation peaked/reached a peak/ bottomed out/ reached the bottom in December/ at 20%.4.使用正确的时态和语态5.不要在文章中发表个人看法Sample Topic 1You should spend about 20 minutes on this task.You should write at least 150 words.Sample Answer 1This diagram unfolds a clear comparison between Florida, a state of the United States, and the United States as a whole in four aspects, namely, registered engineers, the civilian laborforce, manufacturing employment and hi-tech employment, from 1978 to 1987.Obviously, in every aspect, Florida had a much higher growth rate than the United States as a whole during that period. The number of registered engineers increased by 87.5%, the most rapid increase of all the four aspects. As to the other three, though the growth rates were not so high, they were indeed remarkable and impressive. The increases in civilian labor force, hi-tech employment and manufacturing employment were 48.8%, 50.8% and 27.5% respectively.Compared with Florida, the United States as a whole made much less progress in the ten years from 1978 to 1987, the highest being only 31.5% in hi-tech employment. The number of registered engineers increased by 19.9% and that of the civilian labor force by 17.1%. In manufacturing employment, things were even worse: the number of employed dropped by 6.8%.From the diagram it can be safely concluded that in the years 1978~1987 Florida developed much more rapidly than the United States as a whole. Thus, job opportunities were moreplentiful, and people specialized in manufacturing, high technology and other fields were more certain to achieve success in their careers in Florida than in other states in the United States.Sample Topic 2You are advised to spend a maximum of 20 minutes on this task.The graph below shows the monthly profits of 3 Australian companies in the car retail industry for the 1994 financial year. Write a report for a university lecturer comparing the performance of Acme Sports Cars and Branson Motors for the period given.You should write at least 150 words.Sample Answer 2The graph shows the four quarters of the 1994 financial year and the monthly profit of Acme Sports Cars and Branson Motors for 12 months. The former was making almost twice theprofit at the beginning than at the end of the financial year. There was a three-fold increase in the latter’s monthly profit over the same period.During the first quarter, Acme Sports Cars’monthly profit decreased slightly from $70,000 to $ 60,000, but rose sharply to $80,000 by the end of September. Branson Motors’monthly profit, however, doubled from $20,000 to $40,000.Due to the introduction of a luxury goods tax, Acme Sports Cars’monthly profit fell dramatically during the second quarter from $80,000 to only $10,000, whereas that of Branson Motors continued to rise, peaking at just over $60,000 by the end of December.In the third quarter, Acme Sports Cars’ monthly profit increased steadily to $20,000 and remained stable, while Branson Motors’monthly profits fluctuated between just over $60,000 and $40,000. at the beginning of the last quarter, a boost in the economy meant the monthly profit of both Acme Sports Cars and Branson Motors gradually increased to $40,000 and $60,000 respectively by the financial year’s end.Sample Topic 3You should spend about 20 minutes on this task.The graph below shows the area of land from which grain was harvested.Write a report for a university lecturer describing the information in the graph.You should write at least 150 words.Sample Answer 3The graph shows total world grain harvest area in millions of hectares between 1950 and 1996. In general, the total harvest area increased until 1980, at which point there was a reduction in the area harvested due to retrenchment.In 1950 almost 600 million hectares of grain were harvested worldwide. During the 1950s the USSR initiated a Virgin Lands Program which greatly increased the area harvested to around 650 million hectares. From this point until the mid-1970s the area harvested increased slowly, which some fluctuations, to just over 700 million hectares. Then around 1975 the price of grain doubled and this caused a rapid increase in the amount of land devoted to grain production. From 1980 to 1995 there was a gradual decrease in the amount of land used for grain cultivation. After this the area harvested again began to rise.In summary, we can see that the area devoted to grain production was affected by both government policy and market forces.Sample topic 4You are advised to spend a maximum of 20 minutes on this task.The table below summarises some data collected by a college bookshop for the month of February 1995.Write a report describing the sales figures of various types of publications, based on the information shown in the table.You should write at least 150 words.Sample Answer 4The table shows the sales figures of fiction books, non-fiction books, and magazines in a college bookshop for February 1995.The figures are divided into two groups: sales to non-Book Club members and to Book club members.The non-Book Club member figures comprise sales to college stag, college students, and members of the public. College staff bought 332 magazines, 44 fiction and 29 non-fiction books. College students bought 1249 magazines, 194 non-fiction and 31 fiction books. More magazines were sold to college students than to any other group of customers. Although no fiction books were sold to members of the public, they purchased 122 non-fiction books and 82 magazines.Book club members bought more fiction (76) and non-fiction books (942) than other customers. On the other hand, magazine sales to Club members (33) were fewer than to any other type of customer.The total number of publications sold for the month was 3134 (1474 to college students, 405 to staff, 204 to the public, and 1051 to Book Club members.) of this figure, 151 items were fiction books and 1287 were non-fiction. Therefore, magazines accounted for the greatest number of sales (1696).。
图表描写型作文图表作文要求要看懂图表的含义并描写图表显示的内容,然后进行相应的分析和概括,或对趋势进行预测。
CET4 — 6级的图表示作文不多见,但此类作文给命题者的余地很大(可结合描写、说明、议论等多种体裁),所以还是必须对其基本的写法有所了解和掌握。
图表型作文的命题方式主要有如下几种:1・给出图表,要求描写图表内容;2・分析图表所表现出来的问题或规律;3・结论或趋势预测。
注意:描写图表内容时,首先要观察图表,抓住规律性的变化,哪些数据体现总的变化规律要着重描写,哪些不能说明主题或无关紧要可以忽略的。
不能简单逐一翻译图表数据,所以学生要必要掌握表达数据间关系的短语和句型。
举例:例一Title: Changes in People" s Daily Expenses1. Changes in people* s daily experises in the past five years.2.Possible reasons for the changes3.My own cone I us i on写法:第一段描写图表,首句为主题句,然后指出图表的显著特征第二段指出三个原因最后一段结论。
范文:In the past five years, there have been great changes in people,s da i I y expenses. Accord ing to the figures given i n the tab I e, the amo unt of money spent on food decreased graduaI Iy T accounting for 35% in 2000. However, there was a rapid increase in cIothing expenses, which made up 17% i n 2000. In add it i on, the t able shows an upward tendency i n recreat i on expenses. The same was true with other experises.In my opinion, there are at least three good reasons for these remarkabIe changes ・To beg in with, with the rap i d deveIopment of agr i cu It ure i n Ch i na, the output of gra i n, f ru i t, vegetab I es and milk has sharp Iy increased, which contr i butes to the dec line in the i r pr i ces・ Second I y, the fami I y in comes of people both in the city and i n the country have greatly r i sen so that peopIe now can afford expensive clothing and some of them eve n want to dress i n the I atest fash i on. Fin ally, as the I i v i ng cond i tions improve, the demand for a var i ety of recreations i s growing stead i Iy, too.In shor t, with the in comes continuing to r i se, peop I e are no Ion ger reconciled to living a simple, monotonous I ife. They are eager to make the i r I i fe i nterest i ng and exc i t i ng. Therefore, I am sure that peop I e wi I I spend more money on clothing and recreations・例二Title: Means of Communication of College Students1 •请描述表格2.请阐述不同的手段的优缺点3.你主要使用哪种手段第一部分:第一句引出话题,第二句具体描述图表内容第二部分:分别描述使用电话、电子邮件和写信的优缺点第三部分:谈我的选择及理由Nowadays, with the rapid dcvclopment of science and tcchnology, an increasing number of means of communication are available, especially to us college students. As can be seen from the chart, on the top of the three main means of comm un ication is phon e-call, which takes up some thing like 45%. Emai1 is rated second, accounting for approximate!y 40%. At the bottom is, not surprisingly , letter writing , which occupies a little higher than 15%.It is not strange that college students prefer to by phone-call, as it is rather fast, convenient, and Hearing what your lover, your friend or your family intimacy and warmth. However, it is by far the mostcommunication. When it comes to communicating with each other by e-mail, somestudents claim that it is also quite convenient and prompt. It may merely take a few seconds to reach your cont act. But as far as int imacy i s concerned, e-mail fails to fulfill this goa1.Despite the fact that letter-writing, which is something called" snail-mail n , is a slow process, and that is usual 1 ytakes at least several days to reach your contact, some students still think that this means shoul d never be total 1 y rejected. They hoi d that 1 etters are more amiabl e, cnjoyablc and familiar. What' s more, letters arc enduring which can be cherished for good and reread whenever you want to.For all the advantages of e-mail and phone-call, I still prefer letter writing. Maybe it is because I am rather conventional that I cling to this somewhat tradi tional way. 例三:Title : Sharp Increase in World Population1. 描写图表2. 指出原因3. 我的观点contact each other above all, direct, say makes luxurious you feelmeans of范文:According to the figures given in the bar graphs we cem see a sharp in crease in world popula ti on. It took from the begin ning of human life to the year 1830 for the population of the earth to reach one billion. That represents a time span of at least two million years. Then the world population increased rapidly, adding up to two bill ion in 1930. The next billion was added by 1960, only in 30 years. From then on the global population was on the rise, amounting to 4 billion in 1975, which is another billion people in only 15 years.There are at least two reasons, I think, for the sharp increase in world population. In the first place, the birth rate continues to climb in many countries, especially in developing ones. General1y speaking, people there hold the opinion that children don" t cost much and when they get old enough to work they will bring in money and that when parents are old, they will take care of them. Secondly, the death rate, in most developed countries declines steadily because people" s standards of 1iving are raised and heal th care improves.In my opinion, the chief reaso n for the popula tion grow th is not so much a risein birth rates is a fall in death as a resuIt of improvements in medical care.-1830 年1831-1930 年 1931-1960 年 (约200万年) (100 年) (30 年) 1961-1975 (15 年)图表作文的常用句型:1・引出数据出处部分:1)From the chart(graph/table/diagram), we can see…2)The chart (graph/1able/diagram) shows (di splays/ reflects/ reveals) that…3)As can be seen from the chart (graph/table/diagram)••-4)It is clear (apparent) from the chart (graph/table/diagram)…2.静态数据或数据比较2) On the top of the list is …which accounts for 70%3) At the bottom of the list is…,which takes up 20% only.4) A is ranked first, fol lowed by B at 20% and C at 50%5) The figure reached the highest/lowcst point in…1)•••accounts for (takes up) 20% of all.3.动态数据1) The number increased( /rose) suddenly(/ dramatically/ rapidly/substantially/considerably/sharply) from… to …2)During 1990-2000, there was a sudden(/rapid/dramatic/substemtial/sharp/considcrablc) rise (/boom) in the number of private cars from---to•••3)The ten years from 1990-2000 witnessed (/saw) a steady growth of private cars from…to…4)The number of private cars in creased (/rose) or fell(/dropped/decl incd/decreased) by 20%5)The number of private cars in 2000 was 5 times more than that in 1990.6)The number of private cars was roughly (/about/ approximately) doubled (/tripled) between 1990-2000.2.必背模版句型As can be seen from/in the chart/diagram/table/graph•…从表格/图形中我们可以看到……The tab 1e shows a three times increase over that of last year.表格显示比去年上升了3倍。
图表作文图表作文要求考生用文字材料把图表中所提供的信息准确、完整地表达出来。
在写作图表作文时,首先要仔细观察并分析图表,以及题中所给出的有关信息,如作文的题目、提纲等。
在分析图表时,要抓住与主题有关的信息,要发现数据呈现的规律,要充分利用图表中的图形、数据等去说明主题。
但是注意不要过多地引用数据,以免造成滥用数据的后果。
另外,在写作图表作文时可以套用一些常用词汇或表达方式,这将有助于你写出较为地道的图表作文图表作文至少包含描述图表与解释原因两个部分,而当前的图表作文大多还有第三个段落。
图表作文的规律性很强,不像图画式作文那样富于变化。
图表的类型主要有下列几种:简称“三图一表”即柱状图(Bar Graph)、线形图(Line Graph)、饼状图(Pie Graph)和表格(Table),下边给出了三种图样。
图表作文的题型特点:以图表作为信息来源的写作模式,即根据图标上的数字,找出所反映的社会现象,并从中看出主要问题和发展趋势;通常的写作逻辑结构为:Paragraph I:(1)描述图表:趋势描写;(2)描述图表:必要数据支持(细节性)。
Paragraph II:(1)提出自己理由和观点;(2)细节性分论点(支持自己观点)。
Paragraph III:(1)预测未来和提出解决方法;(2)总结全文和表达作者自己观点。
图表作文基本模式(a)段落一:According to the figures given in the diagram/picture/pie chart, we can see that________________________ is increasing in the past __________________________, while________________________________ is decreasing. (从整体上对事物发展的趋势作概括) 段落二:Possible reasons for this are as follows. (问题产生的原因) On the one hand,_________________________________________ ____________. (原因一) On the other hand,_________________________________________ _________________________. (原因二)Furthermore,_________________________________________ ________. (原因三)段落三:From what has been analyzed, we can draw a conclusion that________________________________. (得出结论) As a matter of fact, with the improvements in____________________________, the trend will go on in the future. (提出改进的方法或措施) Therefore, ________________________________. (最后再强调观点)(b)段落一:The chart gives us an overall picture of the ____________(图表主题). The first thing we notice is that_______________(图表最大特点). This means that as __________, ________________(进一步说明).段落二:We can see from the statistics given that _______________(图表细节一). Afterv+ing_________(细节一中的第一个变化), the_____V+ed+幅度+时间(紧跟着的变化). The figures also tells us that_________________________(图表细节二). (数据位置,如In the second column), we can see that ____________accounts for_______(进一步描述).段落三:Judging from these figures, we can draw the conclusion that___________(结论). The reason for this, as far as I am concerned isthat_____________(给出原因). / It is high time that (发出倡议)图表作文常用词汇上升:increase、rise、ascend 、core、surge 、go up 、climb 、mount、level up下降: decrease、fall 、drop、descend、decline 、reduce 、lessen、level down平稳:stable 、steady、remain/maintain/keep/be the same as/similar to波动:fluctuate、fluctuation、rise and falls、up and down占:occupy、take up、account for、gain而:while、however、whereas、on the other hand、actually/in fact相比:by contract、on the contrary、likewise、compared with最高点:the highest 、the top、the summit 、the peak、the most最低点:bottom 、less 、least 、rock bottom平均:mean、average趋势:tendancy 、trend、inclination预见:prediction达到顶峰: mount to在***中占***:***gain the percentage of有一个稳定的过程:a stable period can be seen1. As can be seen from the table (graph, form) that...2. From the above table it can be seen (concluded) that...3. A careful study of the table shows that...4. The number (percentage) is 3 times as much as that in 2000.5. It has decreased (fell, dropped) about twice, compared with (as compared with, as against) that of 2000.6. In 2001, it increased (went up, rose) from 5 to 15 percent of the total (to 15 percent, by 15 percent).。
图表作文写作方法写作策略一.语言要求:从语言角度来看,图表作文必须做到用词正确,句型多变,语法精确,这就要求一篇文章不能重复使用同一个词,同一个句型。
在描绘图表作文的过程中,语言应力求客观。
比较:1.In 1960, there were about nine thousandmarriages in Denmark, in 1970 there were aboutthree thousand marriages, in 1980 there wereabout two thousand five hundred marriages.2.The number of marriages in Denmark fell verysharply between 1960 and 1970, and continued todecline until around 1985 though at a lower rate.From 1985 onwards there was a gradual increasein the number of marriages which then leveledoff in 1994.二.趋势描写:图表中常常会反映出某个事物的趋势,有总体趋势也有局部趋势,因此趋势描写也成为图表作文中不可或缺的内容。
图表的目的是通过对比,对照来说明问题,因此文章中也应该有描写有关对比,对照的趋势。
三.数据导入:图表的另一个特点是表中会出现大量数据,因此一定要有数据导入。
四.分析问题:根据图表信息对其内在的因果关系进行分析解构,提出自己的看法或对策。
五.结构要求写作步骤一.观察图表二.组织材料三.描写图表四.分析问题五.修改成文范文解析Students tend to use computers more and more nowadays. Reading this chart, we can find that the average number hours of a student spends on the computer per week has increased sharply. In 1990, it was less than 2 hours; and in 1995, it increased to almost 4 hours, and in 2000, the number soared to 20 hours.Obviously computers are becoming more and more popular. There are several reasons for this.First, computers facilitate us in more aspects of life. Moreover, the fast development of the Internet enlarges our demands for using computers. We can easily contact friends in remote places through the Internet. Besides, the prices of computers are getting lower and lower, which enables more students to purchase them.However, there still exist some problems, such as, out-of-date designs and so on. And how to balance the time between using computers and studying is also a serious problem.On the whole, we will benefit a lot from computers as long as we use them properly.常用句型一.表示说明的常用句型1.As we can see from the chart/graph/table 2.The chart/graph/table shows/displays that 3.As shown in/According to the chart/graph/table 4.The figures/statistics in the chart reflect/show/reveal5.The chart/graph/table illustrates/describes 6.It is clear/apparent from the chart/graph/tablethat二.表示数据的常用句式1.…had the largest percentage/proportion of…2.…account for /take up 10%3.Compared with A, B has a higher percentage. 4.On the top of the list is…, which accounts for 60%5.At the bottom is…, which takes up 20%6. A is second to B.7. A is ranked/rated first, followed by B at 30% and C at 25%.三.表示数据变化的常用句式(一)表示增加,减少和波动的常用结构1.There was a boom in the number of (private cars) from… to …2.The number of ( private cars ) increased/rose steadily/gradually from… to…3.There was a slight/slow increase/rise in the number of( private cars) from…to…(二)表示变化不大或没有变化的常用结构1.The number of (private cars) remained steady/stable/constant between …and …2.There was little/hardly any changes in the number of (private cars) between… and…(三)表示最高点或最低点的常用结构1.The situation/figures reached a peak/a high at …% in…2.The number soared to a record high of (四)表示倍数的常用结构1. A is twice/three times what it was in…2. A is twice/three times the amount in3.The figure was roughly doubled/tripled/quintupled between… and…。
写作技法指导如何写图表作文【写作要求】根据所给图表, 写一篇题为“电影与电视”的短文。
短文须包括以下要求:A. 电影观众人数呈逐年下降趋势;B. 电视观众人数越来越多(原因:方便、经济、选择范围);C. 然而还是有人喜欢看电影(原因:气氛、娱乐)。
参考词汇:【审题谋篇】1. 本文要求写一篇图表说明文,对图表的分析要条理清晰,言简意赅。
2. 时态:一般现在时。
3. 文章结构:①现象②通过分析图表加以说明③分析原因 【写作要点】(1) 电影观众人数呈逐年下降趋势。
① Film goers are becoming fewer and fewer year by year. ② Film tends to become fewer and fewer year by year. ③ Film is giving way to TV. (2)相反,看电视的人却越来越多。
① On the contrary, more and more people enjoy watching TV . ② But on the other hand, more and more people enjoy watching TV . ③ But at the same time, more and more people enjoy watching TV .(3) 1995年,看电视的人还不到10,000,而2005年却达到了近1,000,000.In 1995, there were less than 10 thousand TV watchers while in 2005, we had about 1 million. (4)人们喜欢看电视是因为它方便又便宜。
① People enjoy watching TV because it is convenient and cheap. ② It is because it is convenient and cheap that people enjoy watching TV . ③ The reason why people enjoy watching TV is that it is convenient and cheap. (5) 人们喜欢看电影不仅是电影院里的节目还有那儿的气氛。
图表作文的写作要领(1) 观察图表,确定主题句观察图表是为了准确地理解图表所传递的信息。
观察图表首先要看清楚图表的文字说明,然后仔细研究图表以发现数据的主要特征和变化趋势,以此来确定主题句。
(2) 选择典型材料仔细观察表中数据的变化,并加以比较和归纳,选出差距变化最大、最有意义、最能说明主题的信息。
避免过分详细,逐一罗列。
换句话说,并不是图表中的任何一个数字都要进行描述。
(3) 分类确定全文的时态图表有两类,一类是有时间参照的,另一类是无时间参照的。
有时间参照的图表一般在描写时用现在时,有时间参照的可有两种情况:①如果参照的时间在过去就用一般过去时态。
②虽有过去时间参照,但叙述的是经常出现的情况,这种情况整篇文章总的时态仍用现在时态。
(4) 熟练掌握常用套句和短语由于图表包含丰富的信息和各种各样的数据,要清楚有效地把它们呈现出来并不是一件容易的事情,尤其是数据以及发展趋势的变化。
考生应该熟练掌握常用套句和短语。
如果考生能够熟练运用这些套句和短语,自然会信心倍增,对图表作文的恐惧也就消失了。
写作流程第一段:描述图表反映的总情况。
(用能充分说明主题的典型数据描述图表)第二段:分析原因。
(仔细分析比较数字,归纳出增减速率并找出产生变化的原因)第三段:结论。
(得出结论或展望、预测发展趋势)范文与评析(1)---表格(table)作文Directions: You are required to write an essay with the topic “C hanges in the W ays P eople S pent T heir H oliday s. You should base your essay on the information from the table.Changes in the Ways People Spent Their Holidays From the table we could know that the ways people spent their holidays have changed greatly. In 2003, 40% people spent their holidays at home, but their number dropped to 10% in 2013. It was no doubt that people were becoming more and more mobile, and they wanted to get entertainment outside their homes.Seaside still had its attraction to people, though its rate dropped slightly from 40% in 2003 to 30% in 2013, and there might be a further decrease in the future because of the marine pollution. The table shows that a great number of people spent their holidays traveling abroad. The rate in 2013 doubled as compared with 2003. With the increase of their income, more and more people could afford their holidays abroad.The table also indicates another tendency: the rate of camping was rising from 10% in 2003 to 40% in 2013. The reason may be that the real beauty of nature was being rediscovered, and people were getting more and more interested in natural scenery. Based on the above analysis we could draw the conclusion that great changes have taken place in the ways people spent their holidays in the past ten years.范文与评析(2)--- 饼状图(pie chart)作文Popular Desserts in a University CafeteriaDirections: The above pie chart shows the percentage of popular desserts selected in a university cafeteria. Write an essay on the topic “Popular Desserts in a University Cafeteria”. You should base your essay on the information in the chart.Popular Desserts in a University CafeteriaThis pie chart shows the relative popularity of desserts served in a university cafeteria.I ce cream is the favorite among the dessert selections,accounting for 35% of all choices.Pie is the next most popular choice with 25%of all choices. These two items exceeded theremaining four selections in popularity. D oughnut is not so popular with only 10% of all choices, which is the same with pudding in popularity.The only natural fruit choice, the apple, is only a little more popular than the doughnut and is a selection of less than half of percentage in ice-cream.Fruit jelly was last in popularity among all choices.Even pudding proved to be twice as popular as fruit jelly. The relatively high popularity of ice cream and pie may be due in part to the fact that these desserts are not everyday diets in Chinese meals.Fruit jelly,apples, and doughnut are usually served at home.The relatively high standing of the apple in relation to pudding, doughnut,and fruit jelly may be due to parental or school training on nutrition.范文与评析(3)---线状图(line graph)作文Car Accidents in BeijingDirections: You are allowed 30 minutes to write an essay based on the graph. The suggested title is: Car Accidents Declining in Beijing. Remember that your essay must be written according to the following outline:1) Rise and fall of the rate of car accidents as indicated by the graph.2) Possible reason(s) for the decline of car accidents in the city.Car Accidents Declining in BeijingLast year, the rate of car accidents in Beijing reached the highest point 37 in August. After that the rate was steadily declining, and reached the lowest point 14 at the end of the year. The first three months of 2012 showed an increasing trend, and reached 30 in March, and then the rate declined to 26 in June. Then from June to August, the rate was rising from 24 to 37.The highest rate of 37 in August might be due to weather factors. Humidity and high temperature may make drivers become uncomfortable and impatient, which could easily lead to car accidents. The peak point in the first half of 2012 might be also caused by weather conditions. In Beijing, the excessive rain comes at early spring, which makes roads muddy and slippery, and these conditions may result in car accidents.This year the situation is expected to be changed. City government has raised money to improve the road conditions. Two new roads were built at the end of last year, and will soon open to cars. New road regulation stipulates that every car should be air-conditioned in summer. All these precautions account for car accidents declining in Beijing this year.范文与评析(4)---直方图(bar graph)作文Three Major Causes of Fire in ChinaHistogram 1Histogram 2Directions: The above diagram s show three major causes of fire in Guangzhou, these histograms indicate the numbers of fire and the extent of the damage involved, measured in terms of billions of Yuan. Study the two histograms above and draw whatever conclusion(s) you can. T he public interest may be one point to consider. Write an essay stating and supporting your conclusion(s).Three Major Causes of Fire in GuangzhouDespite of all the efforts that mankind has made over the years, fire continues to be a terrible killer in our modern society. From the two histograms above,which describe the leading causes of fires measured in both number of fires and total losses from thefires in Guangzhou, we could see that most fires are caused by smokers, defective insulation and children playing with matches.It is clearly shown in these two histograms that smokers were responsible for totally 10500 of the fires in the last two years, which caused about 5.5 billion Yuan worth of damage. Defective insulation caused more than 4500fires and children playing with matches led to about1000 fires. These results show that smok ers can be considered as the enemies of the whole society, especially when the public interest is taken into consideration.Comparing the figures of these two years, it will be safe to draw a conclusion that, although the number of fires in each category remained nearly the same, the fire losses caused by defective insulation were significantly lower than those in the previous year. O n the contrary, the fire losses in the case of children’s playing with matches were significantly higher than those in the previous year, even though there were fewer fires. T he average losses of a fire caused by smokers remained more or less the same, only showing a slightly increasing trend.Based on the brief analysis above, it can be concluded that, although smokers are the leading cause of fires, we still need to improve the insulation devices and educate our children on the dangers of playing with matches.常用表达句型:1)描述图标的句式(1) T he table shows the changes in the number of...over the period from...to...该表格描述了在...年到...年间...数量的变化。