
05_Intel_VTune_Session_07
- 格式:ppt
- 大小:1.05 MB
- 文档页数:15

Get Started with Energy AnalysisGet Started with Energy AnalysisContentsChapter 1: Get Started with Energy Analysis 2Get Started with Energy Analysis 1Energy Analysis with Intel® SoC WatchUse Intel® SoC Watch to perform energy analysis on a Linux*, Windows*, or Android* system running on Intel® architecture. Study power consumption in the system and identify behaviors that waste energy. Intel SoC Watch generates a summary text report or you can import results into Intel® VTune™ Profiler.Get the ToolsIntel® SoC Watch is available in VTune Profiler, which you can download with the Intel® oneAPI Base Toolkit.WorkflowsYou perform energy analysis by examining a summary report of data collected on the target system. See if the system is using energy-efficient, low power states. If results are not optimal, you may need additional examination of the data on a timeline as well as correlating metrics to determine a cause.There are two workflows for energy analysis:The next few sections describe the steps involved in Option 1 to perform data collection on a target system using Intel SoC Watch.Step 1: Install Intel SoC Watch on Target SystemThe Installation section of the Intel SoC Watch Release Notes (for your preferred target operating system) contains detailed instructions for instruction and configuration (if necessary).Download Intel® oneAPI Base Toolkit and install Intel® VTune™ Profiler, which contains Intel SoC Watch.The Installation section of the Intel SoC Watch Release Notes (for your preferred target operating system) contains detailed instructions for instruction and configuration (if necessary).3•Intel SoC Watch for Windows Release Notes •Intel SoC Watch for Linux Release Notes •Intel SoC Watch for Android Release NotesFind release notes and an OS-specific user guide in the documentation\en\socwatch directory after you install Intel ® VTune ™ Profiler.Step 2: Collect Data1.Open a command prompt with administrative/root privileges on the target system where Intel SoC Watch was installed.2.Enter the command below to capture CPU time in low power states over a 60-second period.socwatch -t 60 -f cpu-cstate -m -o results/testStep 3: View ResultsWhen collection completes, a message appears with the location of the result files. In this example, the summary report is located in the current directory in the results/test.csv file.1.Open the test.csv file using a spreadsheet viewer (such as Microsoft Excel*) or a text viewer (such as vi/vim or Microsoft Wordpad*).NOTESome text viewers give better column alignment than others.2.Review the tables in the report file. A partial set of tables is shown in the example report below.Example report:Example report interpretation : When reading C-State tables, a higher C-State number means lowerpower consumption. C0 indicates high energy consumption and C7 or C10 is the lowest energy consumption.Looking at the table in the example report, the system spent 93.65% of the collection time in the package-level C2 state while the cores were in C7, their lowest state. An area for further exploration would be what prevented the package from going into its lowest energy state.1Get Started with Energy Analysis4Get Started with Energy Analysis 1 Next StepsAfter running a basic collection on a target system, consider one of these steps:•Learn about additional data that you can collect on the target system. Run the help command: socwatch -h. The Intel SoC Watch User's Guide has a list of all provided metrics. Some metrics may not besupported on your platform.•Define a scenario you want to analyze for energy use. For example:•System idle scenario, where the system is not in use during the collection time and is expected to drop its energy use to the lowest possible. Use a longer collection period (several minutes) to give thesystem time to transition to deep sleep or hibernation.•Active workload, such as video or audio playback. Start both an activity and collection for a predetermined time or let the collection run until manually stopped. Use the help command to learn about Intel SoC Watch options that allow launching a workload, delaying a collection start, and running for indefinite time.•Generate a trace file (*.pwr) to import and view in Intel® VTune™ Profiler. Add the -r vtune option to the command line. For more information, see https:///en-us/energy-analysis-user-guide-intel-energy-analysis.Additional ResourcesLegal InformationIntel, the Intel logo, Intel Atom, Intel Core, Intel Xeon Phi, VTune and Xeon are trademarks of Intel Corporation in the U.S. and/or other countries.*Other names and brands may be claimed as the property of others.Microsoft, Windows, and the Windows logo are trademarks, or registered trademarks of Microsoft Corporation in the United States and/or other countries.51 Get Started with Energy AnalysisCopyright © Intel Corporation.This software and the related documents are Intel copyrighted materials, and your use of them is governed by the express license under which they were provided to you (License). Unless the License provides otherwise, you may not use, modify, copy, publish, distribute, disclose or transmit this software or the related documents without Intel's prior written permission.This software and the related documents are provided as is, with no express or implied warranties, other than those that are expressly stated in the License.6。

intel vtune profiler 用法**一、简介**Intel VTune Profiler是一款强大的性能分析工具,可以帮助开发人员深入了解应用程序的性能瓶颈,优化代码性能,提高系统整体性能。
本指南将详细介绍如何使用VTune Profiler进行性能分析。
**二、安装与配置**1. 首先,确保你的计算机上已经安装了支持的Intel VTune版本。
VTune Profiler支持多种操作系统,包括Windows和Linux。
2. 下载并安装VTune Profiler,按照安装向导的提示进行操作。
3. 配置VTune Profiler的采集参数。
这些参数包括要采集的性能数据的范围、采样频率等。
根据需要选择合适的参数。
**三、使用方法**1. 打开需要分析的应用程序,并启动VTune Profiler。
2. 将应用程序与VTune Profiler进行连接,以便能够捕获应用程序的性能数据。
3. 启动性能分析,等待应用程序运行完毕。
4. 分析捕获到的性能数据。
VTune Profiler提供了丰富的图表和统计信息,帮助你了解应用程序的瓶颈和优化点。
5. 定位性能瓶颈。
通过查看数据,可以找到CPU占用率高、等待时间长的函数或代码段,这些通常是性能瓶颈所在。
6. 优化代码。
根据分析结果,对瓶颈代码进行优化,例如改进算法、减少不必要的循环、优化内存使用等。
7. 重复步骤3-6,直到应用程序的性能得到显著提升。
**四、高级功能**VTune Profiler还提供了许多高级功能,帮助你更深入地分析性能数据:1. 多线程采样:支持同时捕获多个线程的性能数据,适用于分析复杂的多线程应用程序。
2. 事件跟踪:可以设置特定事件的发生条件,以便在发生特定操作时收集性能数据。
3. 内存分析工具:VTune Profiler提供了内存泄漏检测、内存分配分析等功能,帮助开发人员解决内存相关问题。
4. 报告生成:VTune Profiler可以生成多种格式的报告,包括Excel、PDF等,方便用户分析和分享性能数据。

vtune命令行使用方法VTune是一款性能分析工具,可以帮助开发人员找出应用程序的性能瓶颈。
VTune提供了图形用户界面和命令行界面两种使用方式。
本文将介绍如何使用VTune命令行界面进行性能分析。
1. 安装VTune首先需要安装VTune,可以从Intel官网下载安装包,然后按照提示进行安装。
2. 创建项目使用VTune命令行界面需要先创建一个项目。
可以使用以下命令创建一个名为“myproject”的项目:```amplxe-cl -project-dir myproject -create-project myproject```3. 配置分析类型VTune支持多种分析类型,如CPU性能分析、内存分析、线程分析等。
可以使用以下命令配置分析类型:```amplxe-cl -project-dir myproject -r cpu-hotspots -collect hotspots```上述命令将配置CPU性能分析,并选择hotspots分析类型。
4. 运行分析配置好分析类型后,可以使用以下命令运行分析:```amplxe-cl -project-dir myproject -r cpu-hotspots -collect hotspots -- ./myapp```上述命令将运行CPU性能分析,选择hotspots分析类型,并指定要分析的应用程序为“myapp”。
5. 查看分析结果分析完成后,可以使用以下命令查看分析结果:```amplxe-cl -report hotspots -r r001hs -format text -report-output result.txt```上述命令将生成一个名为“result.txt”的文本文件,其中包含了CPU 性能分析的结果。
除了hotspots分析类型外,VTune还支持多种其他分析类型,如memory-access、threading等。
可以根据需要选择不同的分析类型进行性能分析。
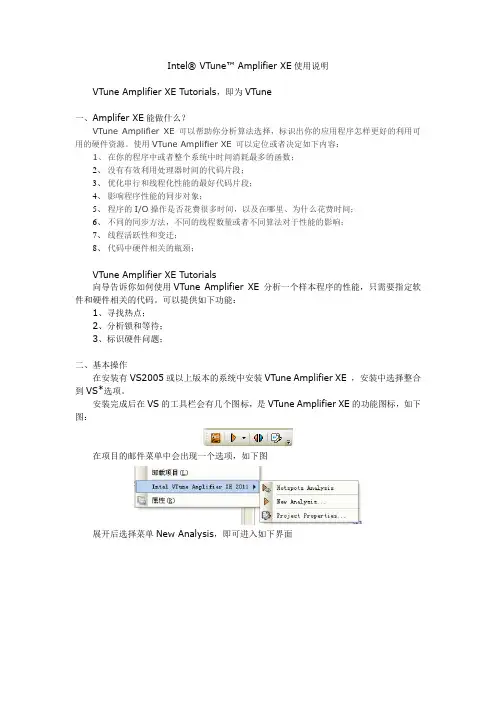
Intel® VTune™ Amplifier XE使用说明VTune Amplifier XE Tutorials,即为VTune一、Amplifer XE能做什么?VTune Amplifier XE 可以帮助你分析算法选择,标识出你的应用程序怎样更好的利用可用的硬件资源。
使用VTune Amplifier XE 可以定位或者决定如下内容:1、在你的程序中或者整个系统中时间消耗最多的函数;2、没有有效利用处理器时间的代码片段;3、优化串行和线程化性能的最好代码片段;4、影响程序性能的同步对象;5、程序的I/O操作是否花费很多时间,以及在哪里、为什么花费时间;6、不同的同步方法,不同的线程数量或者不同算法对于性能的影响;7、线程活跃性和变迁;8、代码中硬件相关的瓶颈;VTune Amplifier XE Tutorials向导告诉你如何使用VTune Amplifier XE 分析一个样本程序的性能,只需要指定软件和硬件相关的代码。
可以提供如下功能:1、寻找热点;2、分析锁和等待;3、标识硬件问题;二、基本操作在安装有VS2005或以上版本的系统中安装VTune Amplifier XE ,安装中选择整合到VS*选项。
安装完成后在VS的工具栏会有几个图标,是VTune Amplifier XE的功能图标,如下图:在项目的邮件菜单中会出现一个选项,如下图展开后选择菜单New Analysis,即可进入如下界面选择一个分析类型,这里选择热点分析(Hotspots)点击Start即可开始。
开始后,会自动生成前面选择的工程,启动程序,开始收集数据,收集过程中可以点击右侧的Stop 按钮,停止收集工作,否则将会一直进行运行直到程序退出。
停止收集后,将会自动进行分析。
分析完毕就可以看到结果了。
如下图三、算法分析功能说明轻量级热点分析(Lightweight Hotspots)确定最消耗时间的代码。