软件Ucinet 和Netdraw使用说明书----Software Resource - Ucinet A Brief Guide to Using Netdraw
- 格式:pdf
- 大小:395.72 KB
- 文档页数:13

u c i n e t软件快速入门上手网络分析软件(总7页)-CAL-FENGHAI.-(YICAI)-Company One1-CAL-本页仅作为文档封面,使用请直接删除本指南提供了一种快速介绍UCINET的使用说明。
假定软件已经和数据安装在C:\Program Files\AnalyticTechnologies\Ucinet 6\DataFiles的文件夹中,被留作为默认目录。
这个子菜单按钮涉及到UCINET所有程序,它们被分为文件,数据、转换、工具、网络、视图、选择和帮助。
值得注意的是,这个按钮的下方,都是在子菜单中的这些调用程序的快捷键。
在底部出现的默认目录是用于UCINET收集任何数据和存储任何文件(除非另外说明),目录可以通过点击向右这个按钮被修改。
运行的一种程序为了运行UCINET程序,我们通常需要指定一个UCINET数据集,给出一些参数。
在可能的情况下,UCINET选用一些默认参数,用户可以修改 (如果需要)。
注意UCINET伴随着大量的标准数据集,而这些将会放置在默认值目录。
当一个程序被运行,有一些文本输出,它们会出现在屏幕上,而且通常UCINET的数据文件包含数据结果,这些结果又将会被储存在默认目录中。
我们将运行度的权重的程序来计算在一个称为TARO的标准UCINET数据集的全体参与者的权重。
首先我们强调网络>权重>度,再点击如果你点击了帮助按钮,,一个帮助界面就会在屏幕上打开,看起来像这样。
帮助文件给出了一个程序的详细介绍,会解释参数并描述在记录文件和屏幕上显示出来的输出信息。
关闭帮助文件,或者通过点击pickfile按钮或者输入名称选择TARO分析数据,如下。
现在点击OK运行程序验证。
这是一个文本文件给出的程序结果。
注意你可以向下滚动看到更多的文件。
这个文件可以保存或复制、粘贴到一个word处理包中。
当UCINET被关闭时,这个文件将会被删除。
关闭此文件。
注意,当这个程序运行时,我们也创建了一个名为FreemanDegree的新的UCINET 文档。

ucinet的netdraw简介Ucinet是一款用于分析和可视化复杂网络数据的软件,而NetDraw则是Ucinet软件包中的一个关键模块,用于绘制和呈现网络图表。
NetDraw结合了强大的网络分析和可视化功能,使用户能够更好地理解和解释复杂的网络数据。
NetDraw具有直观的用户界面,可以让用户轻松地导入和编辑网络数据,并以各种方式呈现网络图表。
用户可以通过拖拽和放大缩小操作,自由地调整网络图表的布局和外观,以便更清晰地观察和分析网络结构。
同时,NetDraw还支持多种图表类型,包括节点-连边图、多重边图和多模态图等,以满足不同类型网络数据的可视化需求。
在网络图表的呈现方面,NetDraw支持丰富的自定义选项,包括节点大小、颜色、标签和连边样式等,用户可以根据自己的需求对网络图表进行个性化定制。
此外,NetDraw还可以根据网络数据的属性进行着色和标签,帮助用户更好地理解网络结构和特征。
除了支持静态网络图表的绘制,NetDraw还提供了动态网络图表的呈现功能。
用户可以通过时间轴来观察网络的演化过程,了解网络在不同时期的结构和特征变化,从而更好地理解网络数据的动态性和演化规律。
NetDraw还支持与Ucinet软件包中其他模块的无缝集成,用户可以借助Ucinet中的网络分析功能,对网络数据进行深入的定量分析,并将分析结果直接呈现在NetDraw中,帮助用户更好地理解分析结果和发现潜在的规律和模式。
总的来说,NetDraw作为Ucinet软件包中的一个重要组成部分,提供了强大的网络数据可视化功能,帮助用户更好地理解和分析复杂的网络结构。
其直观的用户界面、丰富的图表类型和自定义选项,以及与Ucinet其他模块的紧密集成,使其成为研究者和分析师分析复杂网络数据的重要工具,有助于发现网络的潜在模式和规律,为决策提供科学依据。

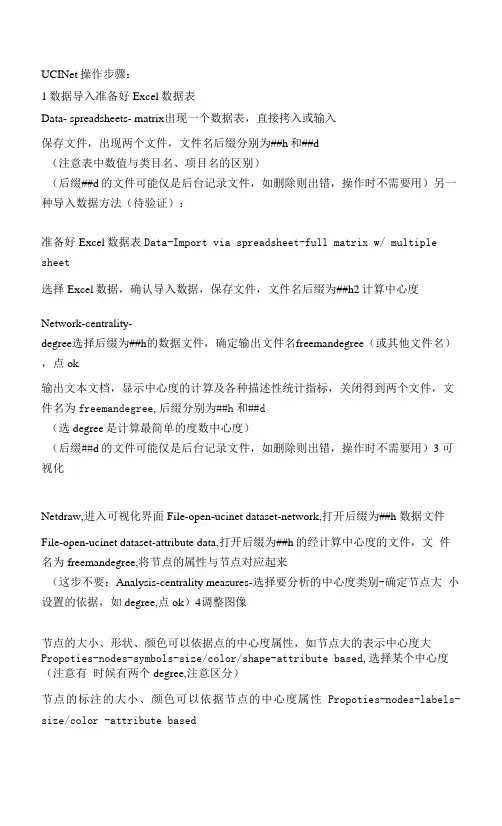
UCINet操作步骤:1数据导入准备好Excel数据表Data- spreadsheets- matrix出现一个数据表,直接拷入或输入保存文件,出现两个文件,文件名后缀分别为##h和##d(注意表中数值与类目名、项目名的区别)(后缀##d的文件可能仅是后台记录文件,如删除则出错,操作时不需要用)另一种导入数据方法(待验证):准备好Excel数据表Data-Import via spreadsheet-full matrix w/ multiple sheet选择Excel数据,确认导入数据,保存文件,文件名后缀为##h2计算中心度Network-centrality-degree选择后缀为##h的数据文件,确定输出文件名freemandegree(或其他文件名),点 ok输出文本文档,显示中心度的计算及各种描述性统计指标,关闭得到两个文件,文件名为freemandegree,后缀分别为##h和##d(选degree是计算最简单的度数中心度)(后缀##d的文件可能仅是后台记录文件,如删除则出错,操作时不需要用)3可视化Netdraw,进入可视化界面File-open-ucinet dataset-network,打开后缀为##h 数据文件File-open-ucinet dataset-attribute data,打开后缀为##h的经计算中心度的文件,文件名为freemandegree,将节点的属性与节点对应起来(这步不要:Analysis-centrality measures-选择要分析的中心度类别-确定节点大小设置的依据,如degree,点ok)4调整图像节点的大小、形状、颜色可以依据点的中心度属性,如节点大的表示中心度大Propoties-nodes-symbols-size/color/shape-attribute based,选择某个中心度(注意有时候有两个degree,注意区分)节点的标注的大小、颜色可以依据节点的中心度属性Propoties-nodes-labels-size/color -attribute based线表示节点之间的联系,在最简单的度数中心度中表示二者间的合作次数线的粗细、颜色可以依据合作次数显示,线的显示也可以在某一阈值之上的显示, 阈值之下(合作次数低)的不显示右下角设置连线显示阈值设置线宽:Propotics-lincs-sizc-tic strength,设置最小线宽和最大线宽设置线的颜色:右下角阈值设为0■颜色为黑-dn,阈值为20-颜色褐-dn,阈值30- 颜色绿-dn, ......最后阈值为(),全部显示,则有不同根据联系强度(合作次数)设置的颜色5保存出图保存图:file-save diagram as-选择不同图的格式保存以后能打开的图文件:file-save data as-vna-complete-选择不同保存范围,选择保存全部节点和关系,如果不保存全部节点和关系,那么下次打开就只有保存时显示的部分再次打开图文件:file-open-vna text file-complete-ok微生物农药研究发文量前50国家的合作网络图图1节点大小代表度数中心度,就是根据合作次数计算的中心度的大小,连线数量代表合 作次数Porti *Pdk^t anKorea,N orway•ranc i CsraeiPotend1i ■CzechRepubfcTunisiaJusso •Mahys anbndle w ZeaiaCotocnbe图3棕色连线代表合作次数大于大于30次。


本指南提供了一种快速介绍UCINET勺使用说明假定软件已经和数据安装在C:\Program Files\Analytic Technologies\Ucinet 6\DataFiles 勺文件夹中,被留作为默认目录。
这个子菜单按钮涉及到UCINET所有程序,它们被分为文件,数据、转换、工具、网络、视图、选择和帮助。
值得注意勺是, 这个按钮勺下方,都是在子菜单中勺这些调用程序勺快捷键。
在底部出现的默认目录是用于UCINET攵集任何数据和存储任何文件(除非另外说明),目录可以通过点击向右这个按钮被修改。
运行的一种程序为了运行UCINET程序,我们通常需要指定一个UCINET数据集,给出一些参数。
在可能的情况下,UCINET选用一些默认参数,用户可以修改(如果需要)。
注意UCINET伴随着大量的标准数据集,而这些将会放置在默认值目录。
当一个程序被运行,有一些文本输出, 它们会出现在屏幕上,而且通常UCINET的数据文件包含数据结果,这些结果又将会被储存在默认目录中。
我们将运行度的权重的程序来计算在一个称为TARO的标准UCINET数据集的全体参与者的权重。
首先我们强调网络>权重>度, 再点击如果你点击了帮助按钮,,一个帮助界面就会在屏幕上打开,看起来像这样。
帮助文件给出了一个程序的详细介绍, 会解释参数并描述在记录文件和屏幕上显示出来的输出信息。
关闭帮助文件,或者通过点击pickfile 按钮或者输入名称选择TARO分析数据,如下。
现在点击OK运行程序验证。
这是一个文本文件给出的程序结果。
注意你可以向下滚动看到更多的文件这个文件可以保存或复制、粘贴到一个word处理包中。
当UCINET被关闭时,这个文件将会被删除。
关闭此文件。
注意,当这个程序运行时,我们也创建了一个名为FreemanDegree的新的UCINET文档。
我们可以使用Display /dataset按钮查看新的UCINET文件。
这是D按钮,只出现在下面的工具子菜单里(见第一个图)。
北京环中睿驰科技有限公司Ucinet软件操作指南安装、激活、使用方法QQ:971307775 Email: ss@欢迎交流联系沈帅5/2/2012主要介绍UCINET软件的安装方法、激活方法、用途特点介绍以及一个完整的建模实例。
1Ucinet软件操作指南1.1安装步骤1.1.1步骤一安装软件●Ucinet 6 Windows版本安装软件包名称为:UcinetSetup.exe,点击该软件安装包,然后弹出下边界面之后点击允许运行:图一●然后弹出如下界面,选择安装目录:图二●然后点击Next,选择安装文件夹名称:图三●点击Next,开始进行软件配置,完成安装。
图四点击next,完成Ucinet的安装,然后点击finish即可启动软件:图五1.1.2软件激活方法:●点击Install之后,在Help页面中选择Register注册按钮,然后输入购买时使用的UserID和RegistrationCode,具体如下:图六●激活成功之后,会提示激活成功。
1.2软件介绍1.2.1用途UCINET软件是由加州大学欧文(Irvine)分校的一群网络分析者编写的。
现在对该软件进行扩展的团队是由斯蒂芬·博加提(Stephen Borgatti)、马丁·埃弗里特(Martin·Everett)和林顿·弗里曼(Linton Freeman)组成的。
UCINET网络分析集成软件包括一维与二维数据分析的NetDraw,还有正在发展应用的三维展示分析软件Mage等,同时集成了Pajek用于大型网络分析的Free应用软件程序。
利用UCINET软件可以读取文本文件、KrackPlot、Pajek、Negopy、VNA等格式的文件。
它能处理32 767个网络节点。
当然, 从实际操作来看,当节点数在5000~10000之间时,一些程序的运行就会很慢。
社会网络分析法包括中心性分析、子群分析、角色分析和基于置换的统计分析等。
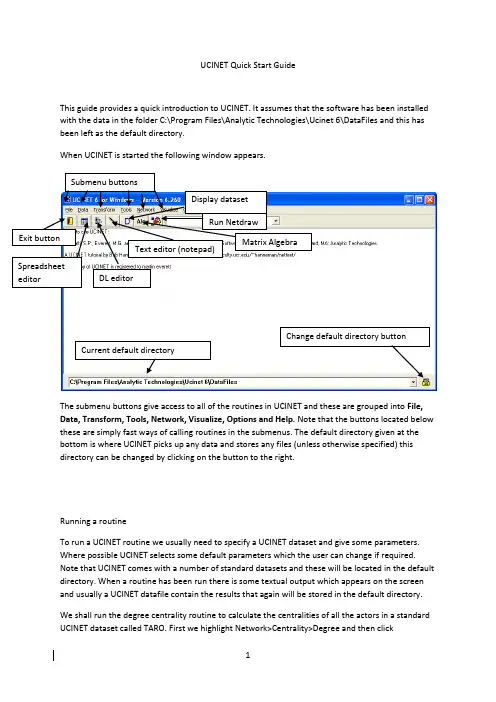
UCINET Quick Start GuideThis guide provides a quick introduction to UCINET. It assumes that the software has been installed with the data in the folder C:\Program Files\Analytic Technologies\Ucinet 6\DataFiles and this has been left as the default directory.When UCINET is started the following window appears.Change default directory button Current default directoryThe submenu buttons give access to all of the routines in UCINET and these are grouped into File, Data, Transform, Tools, Network, Visualize, Options and Help. Note that the buttons located below these are simply fast ways of calling routines in the submenus. The default directory given at the bottom is where UCINET picks up any data and stores any files (unless otherwise specified) this directory can be changed by clicking on the button to the right.Running a routineTo run a UCINET routine we usually need to specify a UCINET dataset and give some parameters. Where possible UCINET selects some default parameters which the user can change if required. Note that UCINET comes with a number of standard datasets and these will be located in the default directory. When a routine has been run there is some textual output which appears on the screen and usually a UCINET datafile contain the results that again will be stored in the default directory.We shall run the degree centrality routine to calculate the centralities of all the actors in a standard UCINET dataset called TARO. First we highlight Network>Centrality>Degree and then clickThis will bring up a box as followsIf you click on the help button then a help screen will open which looks like this. The help file gives a detailed description of the routine, explains the parameters and describes the output that will appear in the log file and on the screen.Close the help file and either by clicking on the pickfile button or by typing the name select the TARO data for analysis as follows.Now click OK to run the routine to obtain the following.This is a text file giving the results of the routine. Note you can scroll down to see more of the file. This file can be saved or copied and pasted into a word processing package. When UCINET is closed this file will be deleted. Close this file.Note when the program was run we also created a new UCINET file called FreemanDegree. We can look at the new UCINET file using the Display dataset button. This is the D button that appears just below the Tools submenu (see the first diagram). Clicking on the D goes straight to the open file menu and bypasses some of the display options that are available if you used Data>Display. Click on display and select FreemanDegree. You should get the followingNote that this file has all the measures of centrality (but not sorted as in the text output) but does not have the descriptive statistics produced in the log file.Using the spreadsheet editorThe spreadsheet editor can be used to amend any data or enter new data. It is also very useful for transferring UCINET data (such as centrality scores) to Microsoft Excel or SPSS. Note that the dl format provides a more sophisticated and flexible way of entering data and this is not covered in this introductory guide. If you click the spreadsheet button or under data run the data editors and click on matrix editor you will open up the spreadsheet editor and obtain the following. Note we have annotated the important buttons and areas of the editor below.To see what a dataset looks like in the editor click file then open and select PADGETT. This is a non-symmetric binary data set with two relations and labels. Once open it will look like this. Symmetric mode copies cell values into other half Set the network or matrix size hereWe see the two relations PADGM and PADGB in the bottom left, clicking on the tabs changes sheet and we are viewing different relations. The labels are repeated along the rows and columns and are in the shaded area. We see the data has 16 actors as shown by the dimensions box on the right. This data can be edited and saved from the spreadsheet.Running NetdrawClick on the Netdraw button to launch Netdraw. This results in a new window which looks likeTo use Netdraw it is important to load in a network first. We shall load in a standard UCINET dataset collected by Dave Krackhardt. Click on the load a file button and type or select the file Krack-High-TecThen click OK and you should see something like this. Click on the Rels tab indicated here.You will now see this data has three relations Advice, Friendship and Reports to. If a relation is ticked then the edges relating to it are displayed. We shall now bring in an attribute file associated with this data called High-Tec-Attributes. Click on the load a file button again load the file but also click the radio button for node attributes under Type of Data so you haveNote you can also click the button just to the right of the load button (with an A) and this will open up the same box but with the attribute button selected. Click on Transform> Node attribute editor and you will see the node attribute editor open up as follows.You can use this editor to change or add in new attributes.We are going to size the nodes by age, colour them by department and shape them according to level. Close the attribute editor and click on the colour node button. This will open the color box click the select attribute button and select department as followsThis will give 5 colours for the five departments. Now click on the change shape of nodes button and go through the same process but selecting level and clicking on the tick at the bottom of the box. This will produce three shapes. To size the nodes according to age you need to selectProperties>Nodes>Symbols>Size>Attribute-Based and then select Age leaving the other values as defaults. This should result in the following.To export the diagram for use in a publication or to read into a word processing package useFile>Save Diagram As>Metafile. To save the diagram as a file you can see again in Netdraw you need to use File>Save Data As>Vna.Using the dl editor in UCINETThe UCINET spreadsheet editor is useful for making changes or for constructing small networks but is not well suited for importing larger datasets in which the data is not typically arranged in an adjacency matrix format. UCINET supports a variety of data formats that are accessed through an editor called the dl editor which is launched by pressing the button to the right of the spreadsheet editor in UCINET which looks like thisLaunch dl editorby clicking thisbutton10When the editor is launched it will contain a small help screen this relates to the info tab. You should click the data tab to obtain the following.Click the data tab to revealthe spreadsheetData format selectionThere are a number of data formats supported but we will just look at two. The data formats can be selected from a pull down list by clicking the arrow to the right of the data format selection box. The full matrix is the same as using the normal spreadsheet editor. Our first format is called nodelist (1mode), this format lists each node followed by the nodes it is adjacent to. The following is an example note we have clicked the force symmetry box in the output options.The first number in each row gives the starting node of an edge the numbers that follow in the same row are a list of end nodes. Hence the first row 1 3 4 5 states that actor 1 is connected to actors 3, 4 and 5. The second row states that actor 5 is connected to actor 6 and so on. Note that there is no order amongst the rows nor within the rows. Actor 2 has no end nodes listed and hence is an isolate. The network corresponding to this linked list is given below.Note that the entries in the spreadsheet are labels and so we can use names rather than numbers. If the data is directed then the arc goes from the start node to the end node. The following is an example showing a directed network with labels.If the data is valued then we cannot use the nodelist (1 mode) format; an alternative is the edgelist (1-mode) format. This format has three entries per line and is of the form start node, end node , value. The following is an example.In this example we see that Martin has a connection to Steve with a value of 5. It should be noted that the data in the spreadsheet cannot be saved except as a UCINET file and hence it is a good ideato construct these in an excel spreadsheet and copy and paste or import them. Once the entry is complete the file can be saved in UCINET by clicking the File button and selecting Save UCINETdataset. To clear the spreadsheet click the on the top left hand side.There are many features of UCINET and Netdraw that we have not mentioned but hopefully this guide will get you started.。
安装完之后是这么个东西
点开ucinet这个软件
然后点这个标识,出现的是
然后打开之前做的矩阵的EXCEL表格,把数据复制然后点击EDIT 这个标识,点击PASTE
完成粘贴,点击这个保存,保存类型是什么UCINET4-6那个,然后就形成##h的那个文件了,然后在回到UCINET的最开始的页面,也就是第一个图的页面上,点击
这个标识,进入到下面页面,也就是NETDRAW页面了
然后点FILE 点open—ucinet dataset—network,得到下面页面
点那个…那个标识,然后打开刚才保存的##h得文件,然后ok就得到那个可视化的图了
这是我自己瞎点吧出来的,我也不确定这么整对不对,就是神奇般的出现了可视化的图了,然后我就觉得挺对,分享给你们,你们看看要是不对的话咱在改。
ucinet使用方法UCINET是一款网络分析集成软件,可以用于一维与二维数据分析的NetDraw,以及三维展示分析软件Mage等。
使用UCINET可以读取多种格式的文件,如文本文件、KrackPlot、Pajek、Negopy、VNA等。
以下是UCINET的使用方法:1. 下载UCINET软件。
您可以从官网下载最新版本,或者从软件下载的网页上下载汉化版。
2. 导入Excel数据。
您需要将Excel数据转换为UCINET软件支持的格式,例如.txt或.csv文件。
3. 打开UCINET软件,选择导入的数据文件。
在UCINET软件中,您可以通过菜单栏选择“文件”>“打开”,然后选择要导入的数据文件。
4. 绘制网络图。
在UCINET软件中,您可以通过绘制节点和链接来创建网络图。
您可以使用菜单栏中的“网络”>“绘制网络图”来创建新的网络图。
5. 分析网络数据。
UCINET软件提供了多种网络分析工具,例如中心性分析、社群检测、模块度分析等。
您可以使用这些工具来分析网络数据,并获取有价值的见解。
6. 可视化网络数据。
UCINET软件支持多种可视化效果,例如节点大小、颜色、形状等。
您可以使用这些效果来更好地展示网络数据。
7. 导出网络数据。
您可以将UCINET软件中的网络数据导出为多种格式,例如.csv、.txt、.pdf等。
在菜单栏中选择“文件”>“导出”即可导出数据。
总之,UCINET软件是一个强大的网络分析工具,可以帮助您更好地理解和分析网络数据。
如果您对UCINET的使用有任何疑问,可以参考官方文档或寻求专业人士的帮助。
本指南提供了一种快速介绍UCINET得使用说明。
假定软件已经与数据安装在C:\Program Files\Analytic Technologies\Ucinet 6\DataFiles得文件夹中,被留作为默认目录。
这个子菜单按钮涉及到UCINET所有程序,它们被分为文件,数据、转换、工具、网络、视图、选择与帮助。
值得注意得就是,这个按钮得下方,都就是在子菜单中得这些调用程序得快捷键。
在底部出现得默认目录就是用于UCINET收集任何数据与存储任何文件(除非另外说明),目录可以通过点击向右这个按钮被修改。
运行得一种程序为了运行UCINET程序,我们通常需要指定一个UCINET数据集,给出一些参数。
在可能得情况下,UCINET选用一些默认参数,用户可以修改(如果需要)。
注意UCINET伴随着大量得标准数据集,而这些将会放置在默认值目录。
当一个程序被运行,有一些文本输出,它们会出现在屏幕上,而且通常UCINET得数据文件包含数据结果,这些结果又将会被储存在默认目录中。
我们将运行度得权重得程序来计算在一个称为TARO得标准UCINET数据集得全体参与者得权重。
首先我们强调网络>权重>度,再点击如果您点击了帮助按钮,,一个帮助界面就会在屏幕上打开,瞧起来像这样。
帮助文件给出了一个程序得详细介绍,会解释参数并描述在记录文件与屏幕上显示出来得输出信息。
关闭帮助文件,或者通过点击pickfile按钮或者输入名称选择TARO分析数据,如下。
现在点击OK运行程序验证。
这就是一个文本文件给出得程序结果。
注意您可以向下滚动瞧到更多得文件。
这个文件可以保存或复制、粘贴到一个word处理包中。
当UCINET被关闭时,这个文件将会被删除。
关闭此文件。
注意,当这个程序运行时,我们也创建了一个名为FreemanDegree得新得UCINET文档。
我们可以使用Display /dataset按钮查瞧新得UCINET文件。
一、绘制社会网络图1.表“农资数据1”中的数据转换成关系矩阵。
(1)从表“农资数据1”中找出要处理的地区的数据,把所需信息(如姓名,文化程度,耕种经验,JB30-1......)单独找出来放在一个表格中。
(2)构建关系矩阵注意交流次数,1代表1~4 ,2代表5~8,3代表9~12,...... (具体内容可参考调研问卷)操作时,1替换成4,2替换成8,3替换成12......2.把关系矩阵导入到Ucinet软件中(1)打开Ucinet软件,点击Spreadsheet(图1中标记的按钮)图1(2)出现下图,把在Excel中处理好的关系矩阵复制到Spreadsheet中,把关系矩阵转换成Ucinet软件能够识别的格式。
如图2所示。
点击保存按钮。
图23.点击NetDraw按钮(图3中标记的按钮),出现图4所示的界面。
图3图44.按如图5 所示点击,即File——>Open——>Ucinet dataset——>Network,出现如图6所示的界面,点击图6中标记的按钮,选择上述2(2)中处理好的Ucinet能够识别的关系矩阵。
点击OK按钮。
图5图65.出现如图7所示的社会网络图。
(可以按图中标记的按钮,调整图形的形状)图76.对于一些散点(如图7中的李翠花,钱德轩......),小网络中的节点(赵国荣,吕国逢......)和未调研节点(可与表格农资数据1中的调研数据进行对比),本研究不进行分析,因此需把他们删掉。
删除有两种方式。
(建议使用第2种方式)(1)直接在Ucinet软件中删除。
把鼠标放在节点上,点击右键,会出现delete按钮,点击delete便可删除。
删掉后可进行保存。
保存方法如图8所示,即依次点击File——>Save Data As——>Vna,出现如图9所示的界面,点击图9中标记的按钮,选择保存位置,以及对文件进行命名。
图8图9(2)在关系矩阵表中删除。
打开步骤1中做好的Excel表格,对照着Ucinet中画出的社会网络图,把散点,未调研节点和小网络中的节点数据删除。
A Brief Guide to Using NetDraw1NetDraw is a program for drawing social networks.Overview of FeaturesMultiple Relations. You can read in multiple relations on the same nodes, and switch between them (or combine them) easily.Valued Relations. If you read in valued data, you can sequentially “step” through different levels of dichotomization, effectively selecting only strong ties, only weak ties, etc. In addition, you have the option of letting the thickness of lines correspond to strength of ties.Node Attributes. The program makes it convenient to read in multiple node attributes for use in setting colors and sizes of nodes (as well as rims, labels, etc.). In addition, the program makes it easy to turn on and off groups of nodes defined by a variable, such as males or members of a given organization. If the attributes are read in using the VNA data format (see below), they can be textual in addition to numeric. This means that instead of coding location as numeric codes 1, 2, 3, etc, you can simply write Boston, New York, Tokyo …Analysis. A limited set of analytical procedures are included, such as the identification of isolates, components, k-cores, cut-points and bi-components (blocks).2-Mode Data. NetDraw can read 2-mode data, such as the Davis, Gardner and Gardner data and automatically create a bipartite representation of it.Data Formats. The program reads Ucinet datasets (the ##h and ##d files), Ucinet DL text files, Pajek files (net, clu and vec), and the program’s own VNA text file format, which allows the user to combine node attributes with tie information.Saving Data. Using the VNA file format, the program can save a network along with its spatial configuration, node colors, shapes, etc. so that the next time you open the file, the network looks exactly like it looked before. The program can also save data as Pajek net and clu files, and Ucinet datasets (both networks and attributes).Saving Pictures. Network diagrams can be saved as bitmaps (.bmp), jpegs (.jpg), windows metafiles (.wmf) and enhanced metafiles (.emf). In addition, the program exports to Pajek and Mage.1 Downloaded from: /downloadnd.htm, February 18, 2011.Printing. There is a Print button. This is very good for creating publication-quality diagrams because the results utilize the full resolution of the printer. (When you save an image like a bitmap to disk and insert into a document and then print that, the image resolution is no better than your screen’s.)Appearance Options. A full range of options is implemented, including the ability to change sizes and colors of nodes, node-rims, labels, lines and background. Different node shapes are not yet implemented. You can also rotate, flip, shift, resize and zoom configurations.Layout. Two basic kinds of layouts are implemented at present: a circle and an MDS/ spring embedding based on geodesic distance. The MDS includes options for exaggerating clustering, biasing toward equal-length edges, and turning on/off node-repulsion.Getting StartedSuppose you have a network currently stored as a Ucinet dataset. To draw it in network, just press the Open File button on the toolbar and select the file. The rest is automatic. Here is an example of drawing a file called campnet:Now suppose you have some information about each person that you would like to use to in the display. You might enter the information in a text file called CampAttribs.txt (e.g., enter it in Excel and Save As text file) in the following format:*node dataid gender role betweennessHOLLY female participant 78.33333588BRAZEY female participant 0CAROL female participant 1.333333373PAM female participant 32.5PAT female participant 39.5JENNIE female participant 6.333333492PAULINE female participant 12.5ANN female participant 0.5MICHAEL male participant 58.83333206BILL male participant 0LEE male participant 5DON male participant 16.33333397JOHN male participant 0HARRY male participant 2.333333254GERY male instructor 54.66666794STEVE male instructor 16.83333397BERT male instructor 13.66666698RUSS male instructor 47.33333206Note that the values do not need to be numeric. They should be separated from each other by a comma, space or tab (and values that contain spaces should be enclosed in quotes as in “Bill Smith”).To read this file, go to File|Open|VNA|Attributes and select the file. This will read the file and open the Node Selector window, which looks like this:Using this window you can select an attribute (ID is selected by default), and then use that click on and off nodes with specific properties, such as females or instructors.Now suppose you want to change the colors of nodes to reflect a node attribute, such as wanting to paint men blue and women red. Go to Properties|Nodes|Colors|By Attribute. A dialogue box will open which lets you choose the attribute (gender) and then choose the color of each gender. The dialogue box looks like this:You might also want to change the shape of the nodes to reflect the role that person plays in the group (as indicated by the Role variable). To do this, go toProperties|Nodes|Shape|by attribute, which opens a dialogue box very similar to the color box, except instead of colors, there are shapes. Something similar can be done with the size of nodes.After setting each gender to the desired color, each role to desired shape, and making theVNA Data FormatThe VNA data format allows the user to store not only network data but also attributes of the nodes, along with information about how to display them (color, size, etc.). A key feature of VNA attribute data is that textual data is permitted. In other words, instead of using numeric codes, the gender variable can have values like “male” and “female”.Here is a short example of a vna file:*node dataID name gender agej101 joe male 56w067 wendy female 23b303 bill male 48*tie datafrom to friends advicej101 w067 1 3w067 j101 0 1j101 b303 1 2w067 b303 0 6VNA files are ordinary text files. They consist of sections called “star sections”. Not every file has to have every possible star section, and sections can be in any order. At the moment, there are 3 possible star sections (soon to be 6). They are:*node data*node properties*tie dataA description of each follows. At the end of this document is a complete VNA file.Node Data SectionThe Node Data section contains variables that describe the actors in a network. Here is an example:*node dataid gender role betweennessHOLLY female participant 78.33333588BRAZEY female participant 0CAROL female participant 1.333333373PAM female participant 32.5PAT female participant 39.5JENNIE female participant 6.333333492PAULINE female participant 12.5ANN female participant 0.5MICHAEL male participant 58.83333206BILL male participant 0LEE male participant 5DON male participant 16.33333397JOHN male participant 0HARRY male participant 2.333333254GERY male instructor 54.66666794STEVE male instructor 16.83333397BERT male instructor 13.66666698RUSS male instructor 47.33333206The first line (“*node data”) identifies the section as containing node data.The line following “*node data” is a list of variable names. The first variable is assumed to be a unique identifier. It can be numeric or text, as long as each node has a distinct value. If any value (for any variable) contains spaces or other extraneous punctuation, it should be enclosed in full quotes, as in:“John Barrymore”Following the line of variable names is the actual data corresponding to those variables. All following lines are assumed to be node data until a new star command is read or the end of the file is reached.Node Properties SectionThe node properties section is very similar to the node data section, except that the variables all refer to display characteristics of the nodes, such as size, color, and shape. Here is an example:*Node propertiesID x y color shape size"HOLLY" 1094 415 255 1 10"BRAZEY" 84 742 255 1 10"CAROL" 1224 996 255 1 10"PAM" 1249 722 255 1 10"PAT" 1291 551 255 1 10"JENNIE" 1518 686 255 1 10"PAULINE" 1051 928 255 1 10"ANN" 1330 876 255 1 10"MICHAEL" 791 365 255 1 10"BILL" 785 52 255 1 10"LEE" 80 619 255 1 10"DON" 994 195 255 1 10"JOHN" 776 894 255 1 10"HARRY" 945 214 255 1 10"GERY" 600 578 255 1 10"STEVE" 338 636 255 1 10"BERT" 282 897 255 1 10"RUSS" 543 814 255 1 10As before, the first line (“*node properties”) identifies the section as containing node properties. The line following “*node properties” is a list of variable names. Aside from the first variable, which must be ID, all the other variables can be in any order, and none of them have to be there at all. But if they are present, they must be named exactly as shown in the example. Variable “X” is the horizontal coordinate of a node. Variable “Y” is the vertical coordinate (the 0,0 point is the top left corner of the drawing area). Variable “Color” is the color of the node (in hexadecimal). Variable “Shape” is the shape of the node (circle, square, up-triangle, etc.). Variable “Size” is the size of the nodes in points. Finally, (not shown in the example), the variable “Shortlabel” gives the label for each node (if not given, the program uses the ID code).Following the line of variable names is the actual data corresponding to those variables. Tie DataThe Tie Data section contains dyadic data – the presence/absence or strength of tie among pairs of nodes on one or more relations. Here is an example:*Tie datafrom to talk strengthHOLLY PAM 1 1HOLLY PAT 1 3HOLLY DON 1 2BRAZEY LEE 1 1BRAZEY STEVE 1 2BRAZEY BERT 1 3CAROL PAM 1 1CAROL PAT 1 2CAROL PAULINE 1 3PAM JENNIE 1 3PAM PAULINE 1 1…The second line contains the list of dyadic variables (relations), except that the first two variables are necessarily called “from” and “to” and identify the nodes that are tied. In this example, there are two relations (called “talk” and “strength”).Following the variable names are the actual ties. A data line such as “Holly Pam 1 1” indicates that Holly talks to Pam and their relationship has strength 1. Values of zero are assumed to indicate the absence of a tie on a given relation.Putting it all togetherNot all possible sections need to be in a given file – just one will do. Here is an example of a file with all sections:*Node dataID, gender, role, betweennessHOLLY female participant 78.33333588BRAZEY female participant 0CAROL female participant 1.333333373PAM female participant 32.5PAT female participant 39.5JENNIE female participant 6.333333492PAULINE female participant 12.5ANN female participant 0.5MICHAEL male participant 58.83333206BILL male participant 0LEE male participant 5DON male participant 16.33333397JOHN male participant 0HARRY male participant 2.333333254GERY male instructor 54.66666794STEVE male instructor 16.83333397BERT male instructor 13.66666698RUSS male instructor 47.33333206*Node propertiesID x y color shape size shortlabelHOLLY 1160 271 255 1 10 HOLLYBRAZEY 1214 577 255 1 10 BRAZEYCAROL 671 612 255 1 10 CAROLPAM 985 127 255 1 10 PAMPAT 802 402 255 1 10 PATJENNIE 729 187 255 1 10 JENNIEPAULINE 69 590 255 1 10 PAULINEANN 877 818 255 1 10 ANNMICHAEL 182 224 255 1 10 MICHAELBILL 380 137 255 1 10 BILLLEE 617 44 255 1 10 LEEDON 281 656 255 1 10 DONJOHN 617 839 255 1 10 JOHNHARRY 382 410 255 1 10 HARRYGERY 1051 706 255 1 10 GERYSTEVE 64 394 255 1 10 STEVEBERT 348 812 255 1 10 BERTRUSS 1176 426 255 1 10 RUSS*Tie datafrom to friends strengthHOLLY PAM 1 1PAT HOLLY 1 2PAULINE PAT 1 2JOHN RUSS 1 3HARRY HOLLY 1 2HARRY MICHAEL 1 1BERT RUSS 1 3RUSS GERY 1 1RUSS STEVE 1 3RUSS BERT 1 2HOLLY BRAZEY 0 7 HOLLY CAROL 0 17 BRAZEY PAULINE 0 7 BRAZEY ANN 0 6 BRAZEY MICHAEL 0 15 PAM MICHAEL 0 9 PAM BILL 0 16PAM LEE 0 13 JENNIE BRAZEY 0 8 PAULINE JENNIE 0 5 PAULINE ANN 0 4 ANN PAT 0 7ANN MICHAEL 0 9 BILL LEE 0 10DON ANN 0 12DL Data FormatThe DL protocol is a flexible language for describing data and itself encompasses a number of different formats. Three of these formats – nodelist, edgelist and fullmatrix – are described here.A sample nodelist file called borg4cent.txt is provided with the program.Nodelist FormatThis is usually the most efficient format. Just create a text file using any word processor (make sure to remember to save as text). Enter the data in the following format:dln = 50format = nodelistdata:1 7 8 23 19 21 49 62 6…The "DL" at the top is required and identifies the type of file. The "n=50" tells program to expect up to 50 distinct nodes. The "format = nodelist" tells the program to expect the node list format (as opposed to edge list and full matrix). The word "data:" (don't forget the colon) marks the end of information about the data and the beginning of the data itself.The first line of the data ("1 7 8 2") says that person 1 has ties to three people, who are 7, 8 and 2. The ordering of the people is arbitrary and makes no difference. The second line, "3 19 21 49 6" says that person 3 has ties to four people, who are 19, 21, 49 and 6.Important note: each value is separated by a space (or tab). Each value is a "sequential" ID number. By "sequential" I mean that the numbers run from 1 to n. You can't have arbitrary ID numbers like "1001" or non-numeric IDs like "BOS007" or "Steve" unless you add the words "Labels embedded" some time before the "data:" statement, as follows:dln = 50labels embeddedformat = nodelistdata:binlad geobus tonblai kenskibilste jeabar stebor judcla jandoekenski jandoe…These names or labels must be less than 20 characters long and should not contain spaces or punctuation (as in "osama bin laden") unless they are enclosed in full quotes.A sample data file called borg4cent.txt using nodelist format is provided with the program.Edgelist FormatThis format requires more typing but is convenient when entering data as one encounters it, such as when pulling links between people from newspaper articles. Again, create a text file using any word processor (make sure to remember to save as text). Enter the data in the following format: dln = 50format = edgelistdata:1 71 81 23 19…Note that "nodelist" has been replaced by "edgelist" in the format statement. Then, after "data:", the data are in pairs, separated by spaces or tabs. The first line ("1 7") says that persons 1 and 7 have a tie. The second line says that persons 1 and 8 have a tie. The ordering of nodes within in a pair, and of pairs within the file, is immaterial.As with the nodelist format, you can also use non-sequential, non-numeric IDs as long as you add the words "Labels embedded" some time before the "data:" statement, as follows:dln = 50labels embeddedformat = edgelistdata:binlad geobusbinlad tonblaibinlad kenskibilste jeabar…FullMatrix FormatThis format works well for small datasets that contain a lot of ties. Again, create a text file using any word processor or with Excel (making sure to remember to save as text). Enter the data in the following format:dln = 5format = fullmatrixdata:0 0 1 0 00 0 0 1 11 0 0 1 00 1 1 0 00 1 0 0 0Here, the format statement reads "format=fullmatrix". Then, after "data:", the data are in the form of a person-by-person table. Since n=5, there are 5 rows and 5 columns. The first row has values0, 0, 1, 0, 0, indicating that person one has ties only with the third person. In contrast, the second row of the table shows that person 2 has ties with person 4 and person 5.Note that this format does not have id codes at all: people are identified by their position in the table. The third row corresponds to the third person. The fourth column corresponds to the fourth person, and so on.However, non-numeric labels can be added with "labels embedded" statement as follows:dln = 5labels embeddedformat = fullmatrixdata:Bill Jan Jim Sue ZoeBill 0 0 1 0 0Jan 0 0 0 1 1Jim 1 0 0 1 0Sue 0 1 1 0 0Zoe 0 1 0 0 0Typing the data is the hardest part. Once you do that, the rest is easy.Technical SupportFeel free to contact me (steve@; +1 978 456 7372) for help or to report bugs or to make suggestions for improvements.。