MODIS土地覆盖分类方法
- 格式:ppt
- 大小:10.01 MB
- 文档页数:69

MODIS土地覆盖分类1. 简介MODIS(Moderate Resolution Imaging Spectroradiometer)是美国国家航空航天局(NASA)和美国地球观测卫星数据与信息中心(LP DAAC)联合研发的一种被动遥感传感器。
MODIS传感器可以获取全球范围内的高分辨率、高频次的多光谱遥感影像数据。
其中,MODIS土地覆盖分类是利用MODIS传感器获取的遥感影像数据进行土地类型分类和监测。
2. MODIS土地覆盖分类原理MODIS土地覆盖分类主要基于遥感影像数据的光谱信息和纹理特征进行分析和判别。
具体步骤如下:2.1 数据预处理首先,对获取的MODIS遥感影像数据进行预处理。
预处理包括辐射校正、大气校正、几何校正等,以消除不同时间、不同空间条件下影像的差异性。
2.2 特征提取接下来,从预处理后的遥感影像中提取特征。
常用的特征包括光谱特征和纹理特征。
•光谱特征:通过计算遥感影像中各个波段的反射率或辐射亮度,得到每个像元的光谱特征。
这些特征可以反映不同土地类型在不同波段上的表现差异。
•纹理特征:通过计算遥感影像中像元间的灰度差异、空间关系等信息,得到每个像元的纹理特征。
这些特征可以反映土地覆盖类型的空间分布和结构。
2.3 分类算法基于提取到的特征,使用分类算法对遥感影像进行分类。
常用的分类算法包括支持向量机(SVM)、随机森林(Random Forest)等。
这些算法可以根据已知土地类型的样本数据进行训练,并将训练得到的模型应用于未知土地类型的遥感影像数据。
2.4 精度评价最后,对分类结果进行精度评价。
通常采用混淆矩阵、Kappa系数等指标来评估分类结果与实际情况之间的一致性和准确性。
3. MODIS土地覆盖分类应用MODIS土地覆盖分类在环境监测、资源管理、城市规划等领域具有广泛应用。
3.1 环境监测MODIS土地覆盖分类可以用于监测和评估生态环境的变化。
通过对不同时间段的遥感影像数据进行分类,可以获得土地覆盖类型的时空变化信息。
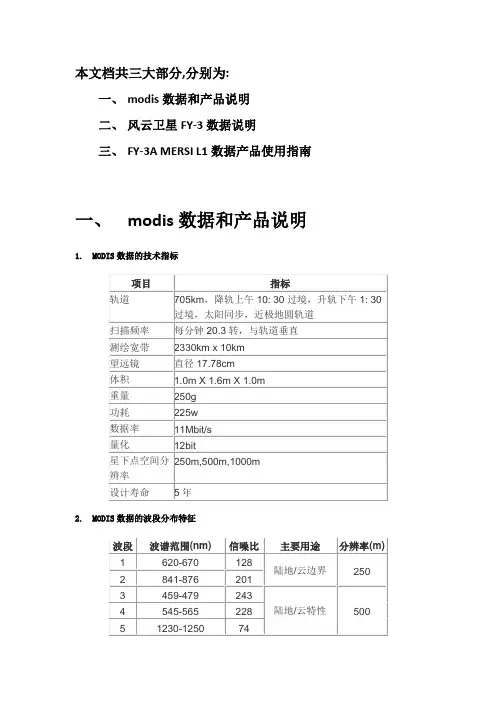
本文档共三大部分,分别为:一、modis数据和产品说明二、风云卫星FY-3数据说明三、FY-3A MERSI L1数据产品使用指南一、modis数据和产品说明1.MODIS数据的技术指标2.MODIS数据的波段分布特征3.Modis 命名规则MODIS 文件名的命名遵循一定的规则,通过文件名,可以获得很多关于此文件的详细信息,比如:文件名MOD09A1.A2006001.h08v05.005.2006012234657.hdfMOD09A1 –产品缩写A2006001 –数据获得时间(A-YYYYDDD)h08v05 –分片标示( 水平XX ,垂直YY)005 –数据集版本号2006012234567 –产品生产时间(YYYYDDDHHMMSS) hdf –数据格式(HDF-EOS)Terra卫星数据产品MODIS土地覆盖类型产品包括从每年Terra星数据中提取的土地覆盖特征不同分类方案的数据分类产品。
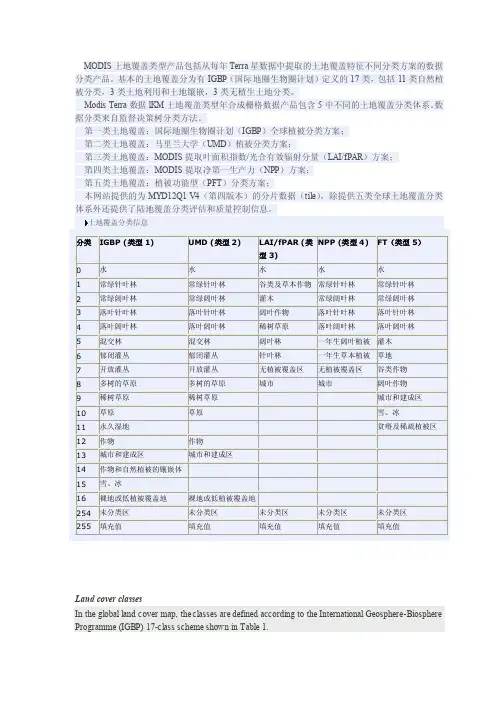
基本的土地覆盖分为有IGBP(国际地圈生物圈计划)定义的17类,包括11类自然植被分类,3类土地利用和土地镶嵌,3类无植生土地分类。
Modis Terra数据lKM土地覆盖类型年合成栅格数据产品包含5中不同的土地覆盖分类体系。
数据分类来自监督决策树分类方法。
第一类土地覆盖:国际地圈生物圈计划(IGBP)全球植被分类方案;第二类土地覆盖:马里兰大学(UMD)植被分类方案;第三类土地覆盖:MODIS提取叶面积指数/光合有效辐射分量(LAI/fPAR)方案;第四类土地覆盖:MODIS提取净第一生产力(NPP)方案;第五类土地覆盖:植被功能型(PFT)分类方案;本网站提供的为MYD12Q1 V4(第四版本)的分片数据(tile),除提供五类全球土地覆盖分类体系外还提供了陆地覆盖分类评估和质量控制信息。
4.Modis数据级别分类0级产品:指由进机板进入计算机的数据包,也称原始数据(Raw Data);1级产品:指L1A数据,己经被赋予定标参数;2级产品:指L1B级数据,经过定标定位后数据,本系统产品是国际标准的EOS-HDF格式。

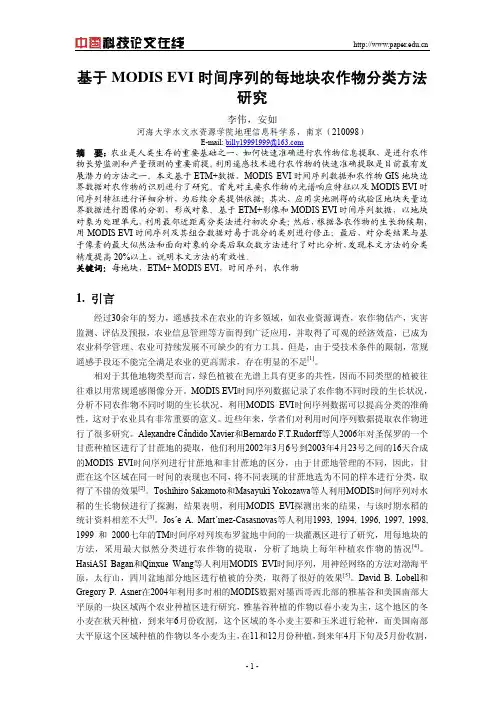
地理学报ACTAGEOGRAPHICASINICA第62卷第6期2007年6月Vol.62,No.6June,2007基于MODIS数据的长江三角洲地区土地覆盖分类徐永明1,刘勇洪2,魏鸣1,吕晶晶1(1.南京信息工程大学遥感学院中美合作遥感中心,南京210044;2.北京市气象局气候中心,北京100089)摘要:长江三角洲地区是我国经济最发达的地区之一,人类活动对自然环境产生了很大影响。
为了研究该地区人类活动与生态环境的相互作用,利用250m分辨率MODIS数据进行土地覆盖制图研究,采用的主要数据为增强型植被指数EVI数据、反射率数据和DEM数据。
通过基于时间序列的滤波方法消除EVI的噪声,通过PCA变换压缩数据量,并计算均质度来表征空间维的纹理信息,构造了一个综合性的分类数据矩阵,依据高分辨率影像选取了训练区,采用最大似然法进行分类,并采用缓冲区分析技术进行分类修正,得到长江三角洲地区的土地覆盖分类结果。
利用高分辨率影像解译信息对分类结果进行了精度评价,并将分类结果与MODIS土地覆盖产品进行了对比,精度分析表明分类结果很好的反映了研究区的土地覆盖信息,显示了本研究分类方法与技术处理在实践中的可行性及250m分辨率EVI时间序列数据在区域尺度土地覆盖分类方面的优势与潜力。
关键词:MODIS;EVI时间序列;长江三角洲;土地覆盖1引言近年来,全球变化已成为当今社会关注的研究热点,而人类对土地的开发利用以及引起的土地覆盖变化被认为是全球环境变化的重要组成部分和主要原因[1]。
土地覆盖直接反映了引起全球变化的主导因子—人类活动,其变化导致了地表反照率、植被覆盖、温室气体等地表与大气特性的变化,影响地—气相互作用,进而改变气候与水循环过程[2]。
可见,土地覆盖类型是地—气物质能量传输模型、陆地生态系统过程及机制研究的关键输入参数,同时也是可持续发展和人类对全球变化影响的主要因素[3]。
土地覆盖研究对于从不同尺度上分析人类活动对于生态环境的作用及自然界的反馈作用具有重要的意义。
esri 10m land cover和modis土地利用分类Esri 10m Land Cover ClassificationEsri 10m Land Cover Classification is a dataset that provides detailed information about the land cover classes present in a geographic area. This dataset is widely used in various fields including urban planning, environmental management, and natural resource analysis. The classification scheme used in Esri 10m Land Cover Classification includes the following classes:1.Water:–Category: Water bodies such as oceans, lakes,rivers, and reservoirs.–Purpose: Identifying and analyzing water resources, hydrology, and aquatic ecosystem management.2.Forest:–Category: Areas covered with trees and densevegetation.–Purpose: Studying forest ecosystems, biodiversity, and monitoring deforestation.3.Agricultural land:–Category: Land used for cultivating crops, raising livestock, and other agricultural purposes.–Purpose: Analyzing agricultural practices, crop yield estimation, and land management strategies. 4.Grassland:–Category: Areas dominated by grass or herbaceous vegetation.–Purpose: Monitoring changes in grassland ecosystems, grazing patterns, and wildlife habitat analysis.5.Urban areas:–Category: Areas characterized by human-madestructures and infrastructure.–Purpose: Urban planning, land use change analysis, and understanding the impacts of urbanization.6.Wetland:–Category: Land that is permanently or temporarily covered with water.–Purpose: Wetland conservation, studying waterresource management, and habitat assessment.7.Barren land:–Category: Areas devoid of vegetation or with sparse vegetation cover.–Purpose: Studying desertification, land degradation, and identifying areas suitable for afforestation. 8.Snow and ice:–Category: Areas covered with snow, glaciers, or ice.–Purpose: Monitoring changes in snow cover, glacial retreat, and analyzing the impacts of climatechange.MODIS Land Use ClassificationMODIS (Moderate Resolution Imaging Spectroradiometer) Land Use Classification is another widely used dataset that provides information about the various land use classes in a specific region. This dataset has a coarser resolution compared to Esri 10m Land Cover Classification but covers a larger area. The land use classes in MODIS Land Use Classification include the following:1.Cropland:–Category: Land used for agricultural purposes, including cultivation of crops.–Purpose: Monitoring agricultural practices,analyzing crop patterns, and estimating cropproductivity.2.Grassland:–Category: Land predominantly covered with grasses or herbaceous vegetation.–Purpose: Evaluating grazing practices, studying grassland dynamics, and wildlife habitat analysis.3.Urban and built-up:–Category: Areas characterized by human-madestructures, urban development, and infrastructure.–Purpose: Urban planning, understanding urban expansion patterns, and analyzing the impacts ofurbanization.4.Forest and woodland:–Category: Areas covered with trees and forests.–Purpose: Studying forest ecosystems, monitoring deforestation, and assessing biodiversity.5.Water bodies:–Category: Lakes, rivers, oceans, and other water bodies.–Purpose: Analyzing water resources, hydrological processes, and aquatic ecosystem management.6.Shrubland:–Category: Land covered with shrubs or low-lying vegetation.–Purpose: Studying shrubland ecology, wildlifehabitat analysis, and land management strategies. 7.Desert:–Category: Barren land or areas with sparsevegetation cover.–Purpose: Understanding desertification, landdegradation, and identifying suitable areas forvegetation restoration.8.Snow and ice:–Category: Areas covered with snow, glaciers, or ice.–Purpose: Monitoring changes in snow cover,analyzing glacial retreat, and studying the impactsof climate change.These are just a few examples of the land cover and land use classifications provided by Esri 10m Land Cover and MODIS datasets. Both datasets offer valuable insights into the composition and distribution of land cover classes, allowing researchers, policymakers, and planners to make informed decisions for sustainable land management.Sure, here are more classifications from Esri 10m Land Cover and MODIS Land Use datasets:Esri 10m Land Cover Classification9.Shrubland:–Category: Land covered with shrubs or low-lying vegetation.–Purpose: Studying shrubland ecology, wildlifehabitat analysis, and land management strategies.10.Mangroves:–Category: Coastal wetlands dominated by salt-tolerant trees or shrubs.–Purpose: Monitoring and conservation of mangrove ecosystems, coastal management.11.Swamp/Marshes:–Category: Wetlands characterized by saturated soil and emergent vegetation.–Purpose: Studying wetland biodiversity, water quality, and carbon storage.12.Bare Ground:–Category: Areas devoid of vegetation or withminimal vegetation cover.–Purpose: Monitoring land degradation, erosion, and assessing soil health.13.Rock and Scree:–Category: Areas predominantly covered by rocks, stones, or loose debris.–Purpose: Studying geomorphology, landscapeevolution, and land stability analysis.MODIS Land Use Classification9.Wetland:–Category: Areas of marsh, peatland, or other wetland environments.–Purpose: Wetland conservation, water resource management, and habitat assessment.10.Plantations:–Category: Extensively managed areas with single-species plantations, such as tree plantations.–Purpose: Monitoring and managing plantation resources, evaluating land use change.11.Open Space:–Category: Land used for recreational purposes, public parks, or open areas.–Purpose: Urban planning, urban green spaces analysis, and promoting outdoor activities.12.Mining:–Category: Areas used for extraction of minerals, including open-pit mines and quarries.–Purpose: Monitoring mining activities, assessing environmental impacts, and land reclamation. 13.Built-up/Paved:–Category: Areas covered with impervious surfaces, such as buildings, roads, and parking lots.–Purpose: Urban planning, analyzing urban heatisland effect, and assessing land use changes.These additional classifications provide a more comprehensive understanding of the land cover and land use patterns in a given area. Detailed analysis of these datasets enables researchers and decision-makers to address various environmental, social, and economic challenges.。
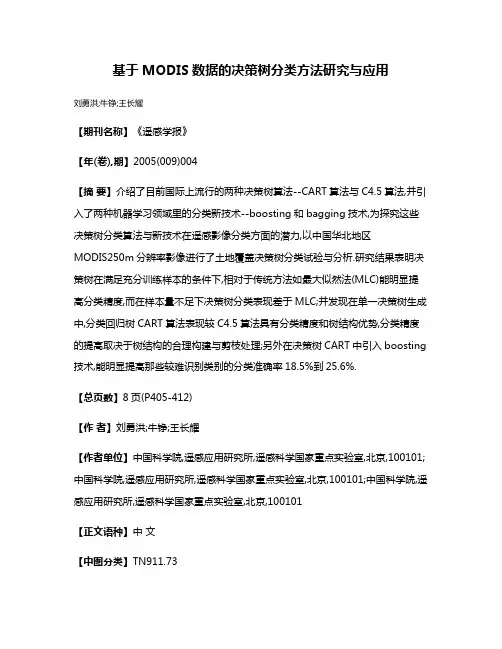
基于MODIS数据的决策树分类方法研究与应用刘勇洪;牛铮;王长耀【期刊名称】《遥感学报》【年(卷),期】2005(009)004【摘要】介绍了目前国际上流行的两种决策树算法--CART算法与C4.5算法,并引入了两种机器学习领域里的分类新技术--boosting和bagging技术,为探究这些决策树分类算法与新技术在遥感影像分类方面的潜力,以中国华北地区MODIS250m分辨率影像进行了土地覆盖决策树分类试验与分析.研究结果表明决策树在满足充分训练样本的条件下,相对于传统方法如最大似然法(MLC)能明显提高分类精度,而在样本量不足下决策树分类表现差于MLC;并发现在单一决策树生成中,分类回归树CART算法表现较C4.5算法具有分类精度和树结构优势,分类精度的提高取决于树结构的合理构建与剪枝处理;另外在决策树CART中引入boosting 技术,能明显提高那些较难识别类别的分类准确率18.5%到25.6%.【总页数】8页(P405-412)【作者】刘勇洪;牛铮;王长耀【作者单位】中国科学院,遥感应用研究所,遥感科学国家重点实验室,北京,100101;中国科学院,遥感应用研究所,遥感科学国家重点实验室,北京,100101;中国科学院,遥感应用研究所,遥感科学国家重点实验室,北京,100101【正文语种】中文【中图分类】TN911.73【相关文献】1.基于MODIS影像的森林类型决策树分类方法研究 [J], 吴梓尚;林辉;孙华;林欣2.基于MERSI和MODIS数据的2种监督分类方法比较研究 [J], 王馨凝;李国春3.基于 CART 决策树方法的 MODIS 数据海冰反演 [J], 张娜;张庆河4.基于MODIS时序数据的Landsat8影像选取及面向对象分类方法的农作物分类[J], 刘明月;王宗明;满卫东;毛德华;贾明明;张柏;张淼5.基于MODIS时序数据的Landsat8影像选取及面向对象分类方法的农作物分类[J], 刘明月;王宗明;满卫东;毛德华;贾明明;张柏;张淼;;;;;;;;;因版权原因,仅展示原文概要,查看原文内容请购买。

MODIS产品介绍及下载流程1.数据获取1)MODIS 发射背景及综述为了加强对地球大气、海洋和陆地的综合观测研究,美国国家宇航局(NASA)于1991年发起了一个综合性项目,称为地球科学事业(ESE),其主要目的是通过卫星及其它工具对地球进行更深入的研究。
ESE包括三个主要部分:一是地球观测卫星系列(EOS);二是先进的数据系统(EOSDIS);三是进行资料分析研究的科学队伍。
重点观测研究领域包括水与能量循环、海洋、大气化学、陆地表层系统、水和生态系统过程、冰川和极地冰盖以及固体地球。
EOS将在近地轨道提供至少18年系统连续的卫星观测数据用于定量研究地球系统的变化。
Terra作为EOS观测计划中的第一颗卫星,在美国(国家宇航局)、日本(国际贸易与工业厅)、加拿大(空间局、多伦多大学)的共同合作下于1999年12月18日成功发射,Terra的字源是拉丁语“地球、土地”,由于Terra卫星每天上午从北向南通过赤道,因此又被称为地球观测第一颗上午星(EOS-AM1)。
NASA的EOS第二颗星命名为Aqua,是美国、巴西和日本共同合作研制的,其拉丁语意为“水”,于2002年5月4日发射成功,为了与Terra卫星在数据采集时间上相互配合,Aqua卫星每天下午从南向北通过赤道,因此被称为地球观测第一颗下午星(EOS-PM1)。
两颗星均为太阳同步极轨卫星。
此外,美国对地观测系统计划还将陆续发射用于不同观测内容的卫星系列,如以观测大气化学成分为主的AULA卫星(EOS-CHEM)、以观测冰雪、云层和地面高程为主的ICESAT卫星、以观测太阳辐射及其对气候影响为主的SORCE卫星和以观测陆地为主的LANDSAT-7卫星(1999年已发射成功)等。
中分辨率成像光谱仪(MODerate-resolution Imaging Spectroradiometer) -MODIS是Terra和Aqua卫星上搭载的主要传感器之一,两颗星相互配合每1-2天可重复观测整个地球表面,得到36个波段的观测数据,这些数据将有助于我们深入理解全球陆地、海洋和低层大气内的动态变化过程,因此,MODIS在发展有效的、全球性的用于预测全球变化的地球系统相互作用模型中起着重要的作用,其精确的预测将有助于决策者制定与环境保护相关的重大决策。
MODIS土地覆盖类型产品包括从每年Terra星数据中提取的土地覆盖特征不同分类方案的数据分类产品。
基本的土地覆盖分为有IGBP(国际地圈生物圈计划)定义的17类,包括11类自然植被分类,3类土地利用和土地镶嵌,3类无植生土地分类。
Modis Terra数据lKM土地覆盖类型年合成栅格数据产品包含5中不同的土地覆盖分类体系。
数据分类来自监督决策树分类方法。
第一类土地覆盖:国际地圈生物圈计划(IGBP)全球植被分类方案;第二类土地覆盖:马里兰大学(UMD)植被分类方案;第三类土地覆盖:MODIS提取叶面积指数/光合有效辐射分量(LAI/fPAR)方案;第四类土地覆盖:MODIS提取净第一生产力(NPP)方案;第五类土地覆盖:植被功能型(PFT)分类方案;本网站提供的为MYD12Q1 V4(第四版本)的分片数据(tile),除提供五类全球土地覆盖分类体系外还提供了陆地覆盖分类评估和质量控制信息。
土地覆盖分类信息NPP (类型4)FT(类型5)分类IGBP (类型1)UMD (类型2)LAI/fPAR (类型3)0 水水水水水1 常绿针叶林常绿针叶林谷类及草本作物常绿针叶林常绿针叶林2 常绿阔叶林常绿阔叶林灌木常绿阔叶林常绿阔叶林3 落叶针叶林落叶针叶林阔叶作物落叶针叶林落叶针叶林4 落叶阔叶林落叶阔叶林稀树草原落叶阔叶林落叶阔叶林5 混交林混交林阔叶林一年生阔叶植被灌木6 郁闭灌丛郁闭灌丛针叶林一年生草本植被草地7 开放灌丛开放灌丛无植被覆盖区无植被覆盖区谷类作物8 多树的草原多树的草原城市城市阔叶作物9 稀树草原稀树草原城市和建成区10 草原草原雪、冰11 永久湿地贫瘠及稀疏植被区12 作物作物13 城市和建成区城市和建成区14 作物和自然植被的镶嵌体15 雪、冰16 裸地或低植被覆盖地裸地或低植被覆盖地254 未分类区未分类区未分类区未分类区未分类区255 填充值填充值填充值填充值填充值Land cover classesIn the global land cover map, the classes are defined according to the International Geosphere-Biosphere Programme (IGBP) 17-class scheme shown in Table 1.No.Class name Description1 EvergreenNeedleleaf Forest Lands dominated by woody vegetation with a percent cover > 60% and height exceeding 2 meters. Almost all trees remain green all year. Canopy is never without green foliage.2 EvergreenBroadleaf Forest Lands dominated by woody vegetation with a percent cover > 60% and height exceeding 2 meters. Almost all trees remain green year round. Canopy is never without green foliage.3 DeciduousNeedleleaf Forest Lands dominated by woody vegetation with a percent cover > 60% and height exceeding 2 meters. Trees shed their leaves during the dry season; e.g. Siberian Larix.4 DeciduousBroadleaf Forest Lands dominated by woody vegetation with a percent cover > 60% and height exceeding 2 meters. Consists of broadleaf trees with an annual cycle ofleaf-on and leaf-off periods.5 Mixed Forests Lands dominated by woody vegetation with a percent cover > 60% and heightexceeding 2 meters. Consists of mixtures of either broadleaf or needleleaftrees and in which neither component exceeds 60% of landscape.6 ClosedShrublands Lands with woody vegetation with a height less than 2 meters. The total percent cover, including the herbaceous understory, exceeds 60%. The shrub foliage can be either evergreen or deciduous.7 Open Shrublands Lands with woody vegetation with a height less than 2 meters, and sparseherbaceous understory. Total percent cover is less than 60%. The shrubfoliage can be either evergreen or deciduous.8 Woody Savannas Lands with and herbaceous understory, typically graminoids, and with treeand shrub cover between 30-60%. The tree and shrub cover height exceeds 2meters.9 Savannas Lands with an herbaceous understory, typically graminoids, and with tree andshrub cover between 10-30%. The tree and shrub cover height exceeds 2meters.10 Grasslands Lands with herbaceous types of cover, typically graminoids. Tree and shrubcover is less than 10%.11 PermanentWetlands Lands with a permanent mosaic of water and herbaceous or woody vegetation. The vegetation can be present in either salt, brackish, or fresh water. Only wetlands covering extensive areas (i.e., more than 500 km2) will be mapped (e.g., Sud, Okavanga, Everglades).12 Croplands Lands where crops comprise > 60% of the total land cover.13 Urban Areas See (a) above.14 Cropland -NaturalVegetationMosaic Lands with mosaics of crops and other land cover types in which no component comprises more than 60% of the landscape.15 Snow and Ice Lands under snow/ice cover for most of the year.16 Barren orSparselyVegetated Lands with exposed soil, sand or rocks and has less than 10% vegetated cover during any time of the year.17 Water Bodies Oceans, seas, lakes, reservoirs, and rivers. Can be either fresh or salt waterbodies. Coded as 0 in the MODIS-based maps.Note: The number column refers to the digital number value in the raster dataset.。

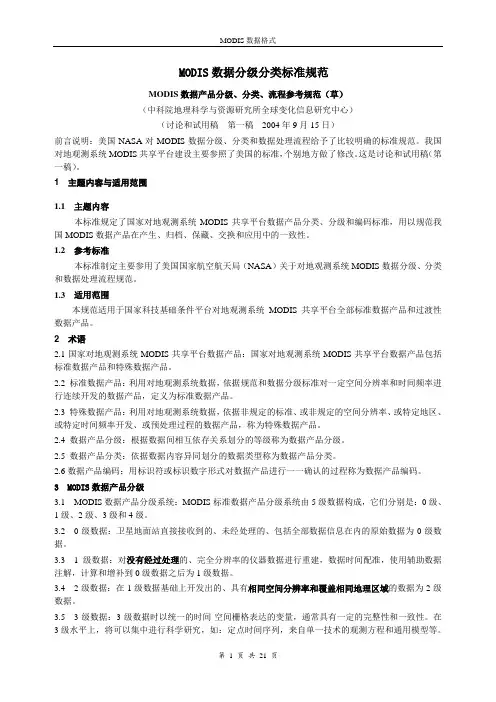
MODIS数据分级分类标准规范MODIS数据产品分级、分类、流程参考规范(草)(中科院地理科学与资源研究所全球变化信息研究中心)(讨论和试用稿第一稿2004年9月15日)前言说明:美国NASA对MODIS数据分级、分类和数据处理流程给予了比较明确的标准规范。
我国对地观测系统MODIS共享平台建设主要参照了美国的标准,个别地方做了修改。
这是讨论和试用稿(第一稿)。
1主题内容与适用范围1.1主题内容本标准规定了国家对地观测系统MODIS共享平台数据产品分类、分级和编码标准,用以规范我国MODIS数据产品在产生、归档、保藏、交换和应用中的一致性。
1.2参考标准本标准制定主要参用了美国国家航空航天局(NASA)关于对地观测系统MODIS数据分级、分类和数据处理流程规范。
1.3适用范围本规范适用于国家科技基础条件平台对地观测系统MODIS共享平台全部标准数据产品和过渡性数据产品。
2术语2.1国家对地观测系统MODIS共享平台数据产品:国家对地观测系统MODIS共享平台数据产品包括标准数据产品和特殊数据产品。
2.2 标准数据产品:利用对地观测系统数据,依据规范和数据分级标准对一定空间分辨率和时间频率进行连续开发的数据产品,定义为标准数据产品。
2.3 特殊数据产品:利用对地观测系统数据,依据非规定的标准、或非规定的空间分辨率、或特定地区、或特定时间频率开发、或预处理过程的数据产品,称为特殊数据产品。
2.4 数据产品分级:根据数据间相互依存关系划分的等级称为数据产品分级。
2.5 数据产品分类:依据数据内容异同划分的数据类型称为数据产品分类。
2.6数据产品编码:用标识符或标识数字形式对数据产品进行一一确认的过程称为数据产品编码。
3 MODIS数据产品分级3.1MODIS数据产品分级系统:MODIS标准数据产品分级系统由5级数据构成,它们分别是:0级、1级、2级、3级和4级。
3.20级数据:卫星地面站直接接收到的、未经处理的、包括全部数据信息在内的原始数据为0级数据。
收稿日期:2009-06-26;修订日期:2009-11-08基金项目:国家自然科学基金(40771147)、科技部863项目(2006AA10Z213)资助。
作者简介:张 景(1985-),女,宁夏银川人,硕士研究生,研究方向为生态环境遥感与气候变化。
E-mail:zjztxfx@yahoo.com.cn通讯作者:姚凤梅,副教授,主要研究方向为全球变化。
E-mail:yaofm@gucas.ac.cn基于MODIS的土地覆盖遥感分类特征的评价与比较张 景1,姚凤梅1,徐永明2,张佳华3(1.中国科学院研究生院地球动力学实验室,北京100049;2.南京信息工程大学中美合作遥感中心,江苏南京210044;3.中国气象科学研究院,北京100081)摘要:选取华北地区为研究区,利用MODIS遥感数据多光谱、多时相优势进行分类特征提取,依据土地覆盖分类特征如地表反射率、植被指数、纹理特征等,并对这些分类特征分别从光谱维、时间维、空间维三个角度进行阐述,结合DEM数据,使用最大似然法进行土地覆盖遥感分类特征的评价与比较。
结果表明,不同分类特征对分类精度影响不同,将多种分类特征结合能够有效提高区域尺度土地覆盖分类精度,但分类特征的加入不一定能提高某些类别的分类精度。
关 键 词:土地覆盖;MODIS;分类特征;精度评价中图分类号:S127 文献标识码:A 文章编号:1000-0690(2010)02-0248-06 土地覆盖及分布格局对地球生态系统过程的物质和能量交换起着重要的作用[1~3]。
土地覆盖类型识别作为土地覆盖和利用变化研究的核心内容,它是地气物质、能量传输模型,陆地生态系统过程及机制研究的关键输入参数[4]。
准确地从遥感影像通过分类方法获取全球及区域范围的土地覆盖信息具有重要意义[5]。
近年来遥感技术不断发展,遥感分辨率已有很大提高,出现了适应于不同研究尺度的遥感数据。
研究表明,中空间分辨率、高时间分辨率的MODIS数据为大尺度的土地资源调查提供了更好的数据源[6]。
基于MERSI和MODIS数据的2种监督分类方法比较研究作者:王馨凝李国春来源:《现代农业科技》2009年第07期摘要在VC++6.0环境下实现2种监督分类方法,即最小距离法和最大似然法对250m MERSI和MODIS数据进行分类,并对分类结果进行分析。
通过分析可看出,将250m分辨率数据增加到5通道的MERSI数据在2种分类方法下分类效果都要好于MODIS数据。
关键词 MERSI数据a;MODIS数据;分类;精度检验中图分类号 P412.27 文献标识码 A 文章编号 1007-5739(2009)07-0266-03风云三号气象卫星是我国首颗新一代极轨气象卫星,它在获取地球大气环境方面具有三维、全球、全天候、定量、高精度资料等特点。
其携带的中分辨率成像光谱仪MERSI具有20个通道,其中19个处于可见光、近红外和短波红外波段,它的通道设置基本上与美国EOS中装载的MODIS一致,所不同的是减掉了1.240μm、1.375μm两个通道,增加了1个0.94μm水汽吸收通道。
MERSI星下点分辨率为250m,通道增加到5个通道,其余通道为1 000m,而MODIS 250m空间分辨率只有两通道数据[1]。
目前对于MERSI数据的分类研究较少,针对MODIS进行了一些分类研究。
例如,徐晓桃等选取3种方法即最大似然法、人工神经网络法和决策树法对7通道MODIS数据进行分类,得出决策树分类精度最高达82.13%的结论[2]。
刘勇洪等人使用最大似然法、Parzen窗、CART决策树等5种方法,使用MODIS数据对华北地区土地覆盖类型进行分类,并通过不同训练样本数量的选取对各方法之间的差异进行了很好的比较[3]。
本试验设置2种监督分类方法即最小距离法和最大似然法对MERSI 5通道250m分辨率数据进行分类,将分类结果与MODIS 250m通道数据在2种分类方法下得到的分类结果进行比较,测试在相同条件下两者在不同分类方法下的分类效果。
一、Modis数据资源总体介绍1999年2月18日,美国成功地发射了地球观测系统(EOS)的第一颗先进的极地轨道环境遥感卫星Terra。
它的主要目标是实现从单系列极轨空间平台上对太阳辐射、大气、海洋和陆地进行综合观测,获取有关海洋、陆地、冰雪圈和太阳动力系统等信息,进行土地利用和土地覆盖研究、气候季节和年际变化研究、自然灾害监测和分析研究、长期气候变率的变化以及大气臭氧变化研究等,进而实现对大气和地球环境变化的长期观测和研究的总体(战略)目标。
2002年5月4日成功发射Aqua星后,每天可以接收两颗星的资料。
搭载在Terra和Aqua两颗卫星上的中分辨率成像光谱仪(MODIS)是美国地球观测系统(EOS)计划中用于观测全球生物和物理过程的重要仪器。
它具有36个中等分辨率水平(0.25um~1um)的光谱波段,每1-2天对地球表面观测一次。
获取陆地和海洋温度、初级生产率、陆地表面覆盖、云、汽溶胶、水汽和火情等目标的图像。
本网站提供的MODIS陆地标准产品来自NASA的陆地过程分布式数据档案中心(The Land Processes Distributed Active Archive Center,LP DAAC/NASA)。
包括:基于Terra星和Aqua星数据的地表反射率(250m,daily;500m,daily;250m,8days;500m,8day)、地表温度(1000m,daily;1000m,8days;5600m,daily)、地表覆盖(500m,96days;1000m,yearly)、植被指数NDVI&EVI (250m,16daily;500m,16days;1000m,16days;1000m,monthly;、温度异常/火产品(1000m,daily;1000m,8days)、叶面积指数LAI/光合有效辐射分量FPAR(1000m,8days)、总初级生产力GPP(1000m,8days)。
MODIS土地覆盖分类1. 简介MODIS(Moderate Resolution Imaging Spectroradiometer)是美国国家航空航天局(NASA)和美国地球观测系统科学研究所(ESE)合作开发的一种遥感传感器。
它可以获取地球表面的高分辨率、中红外波段的遥感数据。
MODIS数据在环境监测、气候变化、生态系统研究等领域具有重要的应用价值。
土地覆盖分类是利用遥感技术对地表进行分类,将不同类型的土地覆盖进行识别和划分。
MODIS土地覆盖分类是利用MODIS数据进行土地覆盖分类的方法和技术。
本文将介绍MODIS土地覆盖分类的原理、流程以及在环境监测、气候变化和生态系统研究等方面的应用。
2. 原理MODIS传感器可以获取到多个波段的遥感数据,包括可见光、近红外和中红外等波段。
这些波段对不同类型的土地覆盖具有不同的反射特性,通过分析这些反射特性可以实现土地覆盖分类。
MODIS土地覆盖分类的原理主要包括以下几个方面:2.1 反射率特征不同类型的土地覆盖在不同波段的反射率特征是不同的。
例如,植被在可见光波段下具有较高的反射率,而水体则具有较低的反射率。
利用这些反射率特征可以将不同类型的土地覆盖进行分类。
2.2 光谱指数光谱指数是利用遥感数据中不同波段之间的比值或差值计算出来的指标。
常见的光谱指数包括归一化植被指数(NDVI)、归一化差异水体指数(NDWI)等。
这些光谱指数可以帮助区分不同类型的土地覆盖。
2.3 分类算法MODIS土地覆盖分类使用各种分类算法对遥感数据进行处理和分析,从而实现土地覆盖的分类。
常见的分类算法包括支持向量机(SVM)、随机森林(Random Forest)等。
3. 流程MODIS土地覆盖分类的流程主要包括以下几个步骤:3.1 数据获取和预处理首先需要获取MODIS传感器获取到的遥感数据,包括不同波段的反射率数据。
获取到的数据需要进行预处理,包括辐射校正、大气校正等,以提高数据的质量。
本文档共三大部分,分别为:一、modis数据和产品说明二、风云卫星FY-3数据说明三、FY-3A MERSI L1数据产品使用指南一、modis数据和产品说明1.MODIS数据的技术指标2.MODIS数据的波段分布特征3.Modis 命名规则MODIS 文件名的命名遵循一定的规则,通过文件名,可以获得很多关于此文件的详细信息,比如:文件名MOD09A1.A2006001.h08v05.005.2006012234657.hdfMOD09A1 –产品缩写A2006001 –数据获得时间(A-YYYYDDD)h08v05 –分片标示( 水平XX ,垂直YY)005 –数据集版本号2006012234567 –产品生产时间(YYYYDDDHHMMSS) hdf –数据格式(HDF-EOS)Terra卫星数据产品MODIS土地覆盖类型产品包括从每年Terra星数据中提取的土地覆盖特征不同分类方案的数据分类产品。
基本的土地覆盖分为有IGBP(国际地圈生物圈计划)定义的17类,包括11类自然植被分类,3类土地利用和土地镶嵌,3类无植生土地分类。
Modis Terra数据lKM土地覆盖类型年合成栅格数据产品包含5中不同的土地覆盖分类体系。
数据分类来自监督决策树分类方法。
第一类土地覆盖:国际地圈生物圈计划(IGBP)全球植被分类方案;第二类土地覆盖:马里兰大学(UMD)植被分类方案;第三类土地覆盖:MODIS提取叶面积指数/光合有效辐射分量(LAI/fPAR)方案;第四类土地覆盖:MODIS提取净第一生产力(NPP)方案;第五类土地覆盖:植被功能型(PFT)分类方案;本网站提供的为MYD12Q1 V4(第四版本)的分片数据(tile),除提供五类全球土地覆盖分类体系外还提供了陆地覆盖分类评估和质量控制信息。
4.Modis数据级别分类0级产品:指由进机板进入计算机的数据包,也称原始数据(Raw Data);1级产品:指L1A数据,己经被赋予定标参数;2级产品:指L1B级数据,经过定标定位后数据,本系统产品是国际标准的EOS-HDF格式。
如何使用卫星影像进行土地覆盖分类和变化监测如何利用卫星影像进行土地覆盖分类和变化监测随着卫星遥感技术的不断发展和进步,卫星影像在土地覆盖分类和变化监测中起着越来越重要的作用。
本文将探讨如何利用卫星影像进行土地覆盖分类和变化监测的方法和技术,并针对其中的一些实际案例进行分析。
首先,进行土地覆盖分类和变化监测需要获取高质量的卫星影像数据。
目前,有多种卫星可供选择,如LANDSAT、MODIS、Sentinel等。
这些卫星具有不同的分辨率和波段,适用于不同的研究目的。
在选择卫星影像时,需要考虑目标区域的大小和复杂程度,以及研究的时间尺度等因素。
其次,进行土地覆盖分类和变化监测需要对卫星影像进行预处理。
预处理包括大气校正、几何校正和辐射校正等步骤。
大气校正是指校正大气影响,提取地表反射率。
几何校正是指校正几何畸变,使影像与地面准确对应。
辐射校正是指校正辐射影响,得到地表辐射强度。
通过预处理,可以得到准确的地表反射率和辐射强度数据,为后续的分类和监测分析提供基础。
接下来,进行土地覆盖分类和变化监测需要选择合适的分类方法。
常见的分类方法包括基于像素的分类、基于对象的分类和混合分类等。
基于像素的分类是指将每个像素都视为一个独立的单位进行分类。
基于对象的分类是指以图像中的对象为单位进行分类。
混合分类是指将基于像素的分类和基于对象的分类相结合,充分利用两种方法的优势。
选择分类方法时,需要考虑研究目的、数据特点和计算资源等因素。
然后,进行土地覆盖分类和变化监测需要进行训练和验证。
通过选择一些代表性的样本点,进行分类器的训练和验证。
训练数据是指已知类别的样本数据,用于构建分类器模型。
验证数据是指未知类别的样本数据,用于测试分类器模型的准确性。
通过训练和验证,可以评估分类器的精度和稳定性,为后续的应用提供可靠的分类结果。
最后,进行土地覆盖分类和变化监测需要进行后处理和结果分析。
后处理包括去除分类中的噪声和错误,提取土地覆盖和变化信息。