暖通毕业设计外文翻译
- 格式:doc
- 大小:194.50 KB
- 文档页数:16

Heat load patterns in district heatingsubstationsHenrik Gadd ⇑,Sven WernerSchool of Business and Engineering,Halmstad University,P.O.Box 823,SE-30118Halmstad,Swedenh i g h l i g h t s"Heat load patterns vary with applied control strategy,season and customer category."Time clock operation of ventilation is the most important factor of daily variations."It is possible to identify outliers by only using two descriptive parameters."A resolution of 1h in heat meter value analysis is enough.a r t i c l e i n f o Article history:Received 26August 2012Received in revised form 28January 2013Accepted 24February 2013Keywords:District heating Heat load variationAutomatic meter reading Heat load pattern Smart heat grids Smart energy gridsa b s t r a c tFuture smart energy grids will require more information exchange between interfaces in the energy sys-tem.One interface where dearth of information exists is in district heating substations,being the inter-faces between the distribution network and the customer building heating systems.Previously,manual meter readings were collected once or a few times a year.Today,automatic meter readings are available resulting in low cost hourly meter reading data.In a district heating system,errors and deviations in cus-tomer substations propagates through the network to the heat supply plants.In order to reduce future customer and heat supplier costs,a demand appears for smart functions identifying errors and deviations in the substations.Hereby,also a research demand appears for defining normal and abnormal heat load patterns in customer substations.The main purpose with this article is to perform an introductory anal-ysis of several high resolution measurements in order to provide valuable information about substations for creating future applications in smart heat grids.One year of hourly heat meter readings from 141sub-stations in two district heating networks were analysed.The connected customer buildings were classi-fied into five different customer categories and four typical heat load patterns were identified.Two descriptive parameters,annual relative daily variation and annual relative seasonal variation,were defined from each 1year sequence for identifying normal and abnormal heat load patterns.The three major conclusions are associated both with the method used and the objects analysed.First,normal heat load patterns vary with applied control strategy,season,and customer category.Second,it is possible to identify obvious outliers compared to normal heat loads with the two descriptive parameters used in this initial analysis.Third,the developed method can probably be enhanced by redefining the customer cat-egories by their indoor activities.Ó2013Elsevier Ltd.All rights reserved.1.IntroductionFuture smart energy grids will require more information about the energy flows in various interfaces in the energy system accord-ing to [1].This information is not always available today for most interfaces.One interface where dearth of information exists is sub-stations in district heating systems.These substations constitute the interface between the distribution network and the customer building heating systems.This existing dearth of information can be explained by the previous lack of measurements,since large amount of data required to perform these analysis have not,by reasonable cost,been possible to collect.Previously,manual meter readings were collected once or a few times a year.However,auto-matic meter reading systems are now being installed which makes hourly meter readings available at low cost.The main purpose with this article is to perform an introductory analysis of high resolution measurements in order to provide valu-able information about district heating substations for creating fu-ture applications in smart heat grids.This is a novel area of research with a very low availability of articles in international sci-entific energy journals.In the past,efforts have been performed to optimise the operation of heat supply plants and district heating networks and0306-2619/$-see front matter Ó2013Elsevier Ltd.All rights reserved./10.1016/j.apenergy.2013.02.062Corresponding author.Tel.:+4635167757.E-mail address:henrik.gadd@hh.se (H.Gadd).to discover and eliminate corresponding errors and deviations. Heat load patterns from customer substations have often been taken for granted,both in design and in operation.However,the heat load in a district heating system is the aggre-gated heat load from all customer substations connected to the network and the heat losses from the network.Errors and devia-tions in customer substations and internal heating systems in buildings will propagate through the district heating network to the heat supply plants.In order to reduce future customer and heat supplier costs,a demand has appeared for more intelligent func-tions identifying errors and deviations in customer substations and heat supply systems in connected buildings.Hereby,a research demand appears for defining normal and abnormal heat load patterns in customer substations.The operation of the heating and ventilation systems in a build-ing is shifting depending on the activity in the building.In schools, where no or few people are present during nights and at weekends, no or little ventilation is necessary at these times.During school holidays,the indoor temperature can be reduced.But multi-dwell-ing buildings need to be heated and ventilated24h a day,7days a week,all year round.Hence,the heat load pattern is different from building to building depending on what kind of activity that takes place in the building.The best would of course be to make sure that the customers’facilities are working well,but with hundreds or thousands of customer substations,it has until now been economically impossi-ble to monitor all customer substations.Today,with automatic meter reading systems installed in most district heating systems in Sweden,new opportunities arise to systematically identify errors in the heat supply or control settings at the customers.If an error in a customer substation can be identified and eliminated, it may of course lead to less heat being sold,but the risk is that if it is not eliminated,the company may lose the total heat sales to the customer depending on the fact that other heating alternatives can be more competitive.Very few studies have been performed concerning horizontal analyses of the heat load pattern in a large number of substations. The reason is that before the large amount of data required to perform these analysis have not,by reasonable cost,been possible to collect.Automatic meter reading systems now installed makes hour meter readings available at low cost.One work where heat load patterns have been analysed for50 buildings is[2],where the main aim was to estimate heat load capacities for billing purposes.In order to increase energy efficiency in multi-dwelling buildings,heat loads has been moni-tored and evaluated in[3].There are works about indoor comfort like[4]were thermal inertia in a building is evaluated,which indi-rect is about heat load patterns.Characteristic for[2–4]is that expensive specific equipment had to be installed in the substations in order to collect hourly measurements.A method of error detection in district heating substations by using information from billing systems is presented in[5].There are studies performed in order to optimise the substation, often with the goal to decrease the primary return temperature as in[6–9].There is also a study to identify faults in substations where a method to identify temperature sensor fault is described [10].In that study,there is also a method described for separating hot water use from space heating,which from a heat load pattern point of view is very interesting.By using multi-agent systems, where the substations and the heat plant can communicate with one another,a possibility to control each part of the system, including the substations,and optimise the whole system would be possible[11,12].This introduction forms a background to answer three research questions in afield of research which in many ways is a white spot on the district heating knowledge map:How do heat load patterns vary in substations?Can heat load patterns be simplified to identify outliers by using heat meter readings?In what plausible directions can this early research on substa-tion heat load be enhanced?2.MethodHeat load patterns are not the same in all buildings.It depends on the building properties,but also of the type of activity that takes place in the buildings.To be able to evaluate if a heat load in a building is normal or not,it is necessary to know what heat load pattern is to be expected.From the customer records at two district heating systems,141buildings have been selected to be analysed. In the company customer records,seven customer categories are available of whichfive are used in this study.Two descriptive parameters and four heat load patterns are identified for each data set and plotted in diagrams presented in the results section.2.1.Gathered dataThe collected data sets are meter readings from141buildings connected to the district heating systems in Helsingborg and Ängelholm in the south-west of Sweden.In total,there are about 13,000buildings connected to the two district heating systems from which about10,000are one-and two-dwelling buildings. The data sets are hourly measured1-year series from1st of January to31st of December,i.e.8760values annually for each building.All data sets are from the year2010.The metering data sets come from databases in the automatic meter reading systems.In a few cases,single unreasonable 1-h-values appear in the data sets.They have been corrected by interpolation from the surrounding values.The unit of the values from the meter reading system is kWh/h.The values are often called heat powers,but it is actually delivered heat during1h.They could also be referred to as hourly average heat loads.2.2.Customer categoriesIn the company customer records,the customer buildings are split into different types of customer categories depending on the activity in the buildings.The subdivision is made due to govern-mental demands to report statistical data that is collected each year.The national categories for customer categories in the national district heating statistics are:Manufacturing industries, one-and two-dwelling buildings,multi-dwelling buildings,ground heating,public administration,and others.In this study one-and two-dwelling buildings and ground heating have been excluded.The reason for excluding one-and two-dwelling buildings is that they use less heat per building.It takes the same effort to eliminate a fault in a small building as in a large building,but there is probably less to gain.Ground heating deliveries differ from other usage of district heating since it is the heat in the return pipe that is used in the application and only less than0.5%of the district heating deliveries in Sweden are supplied for ground heating purposes[13].In the company customer records for the used heat meter data, the subdivision in different categories has in some cases a higher resolution.The main part of the buildings in the group‘‘Others’’in the national statistics is in the company customer records sorted under the category Commercial buildings.Public administration from the national statistics is split into Public administration and Health and Social Services.In this study,the analysis is split into the following five different customer categories:H.Gadd,S.Werner/Applied Energy108(2013)176–183177Multi-dwelling buildings.Industrial demands.Health and Social Services buildings.Commercial buildings.Public administration buildings.2.3.Two descriptive parametersIn this paper,two descriptive parameters determined from heat energy metering values will be evaluated for different customer categories:Annual relative daily variation and annual relative sea-sonal variation.Annual relative daily variation is a variation in the heat load compared to the daily mean heat load and is defined and described in[14].Annual relative daily variations occur mainly because of so-cial heat loads such as domestic hot water preparation and time clock operation control of ventilation,but also some physical heat loads that generate daily variation such as wind,solar incident radiation and daily temperature variations between night and day.Annual relative seasonal variation is the consequence of large variations in outdoor temperature between winter and summer, while the indoor temperatures are expected to be constant.Thefirst descriptive parameter,annual relative daily variation, is defined as:G a¼12P8760;365i¼1;j¼1P h;iÀP d;jP aÁ8760Á100½% ð1Þwhere P h is the hourly average heat load(W),P d is the daily average heat load(W),P a is the annual average heat load(W).The annual relative daily variation is the accumulated positive difference between the hourly average heat loads and the daily average heat load during a year divided by the annual average heat load and the number of hours during1year.The division with the annual average heat load is introduced in order to get a measure independent of building size.The second descriptive parameter,annual relative seasonal variation,is defined as:W¼24Á12P365j¼1j P d;jÀP a jP aÁ8760Á100½% ð2ÞThe annual relative seasonal variation is the accumulated positive difference between the daily average heat loads and the annual average heat load during a year multiplied by the number of hours in1day and divided by the annual average heat load and the number of hours during1year.As for annual relative daily variation,the division with the annual average heat load is intro-duced in order to get a measure independent of the magnitude of each heat demand.2.4.Heat load patternsDifferent types of buildings have different heat load patterns depending on the activity in the building,but the heat load pattern is also changing because of outer temperature and impact of solar incident radiation.For this reason,each1year sequence meter data set is split into four different season periods:Winter:December,January,February(average hourly values from12or13week-hour values).Early spring,late autumn:March,April,October,November.(Average hourly values from17or18week-hour values).Late spring,early autumn:May,September.(Average hourly values from8or9week-hour values).Summer:June,July,August.(Average hourly values from13or 14week-hour values).For each period the average value is for every hour during a week,where Monday00.00–01.00is thefirst hour and Sunday 23.00–24.00is the last in each week,plotted in a diagram.One diagram for each building has been plotted.The result is a weekly heat load pattern.Since it is an average value for between8and18 values only recurrent heat load behaviours will appear.From the heat load pattern diagrams four different heat load patterns have been manually identified:Continuous operation control,Night set-back control,Time clock operation control5days a week and Time clock operation control7days a week,which are described below.The reason to use weekly heat load patterns is because the heat load pattern at a large extent is social heat loads,i.e.are dependent in the social behaviour of people inside the buildings.Since the society in most cases are organised weekly,the social part of the heat load pattern can be expected to recurrent weekly.Time clock operation of ventilation settings is what most affects heat load patterns.This is the reason why the defined heat load patterns are most characteristic during the winter period.When the outdoor temperature is low,the ventilation air needs more heat.In spring and autumn,the heat load peaks in daytime is less but one can also observe a decreased heat demand after noon due to solar incident radiation.In the summer,domestic hot water is the main part of the heat demand,and no or very small difference in heat load pattern can be observed.These heat load patterns presented below have not been veri-fied by substation visits or inspections of heat control settings. 2.4.1.Continuous operation controlNo additional control is applied other than keeping the indoor temperature at the set point in the building heating control system. For a well-insulated and not too small building,it will mainly be domestic hot water preparation that causes the heat load varia-tions in the hourly time scale.Ventilation is in operation24h a day.This is the typical control situation for residential buildings and some Health and Social Services buildings.A typical heat load pattern for continuous operation control can be observed in Fig.1.Small differences in heat load appear espe-cially in winter and summer.In autumn and spring,reduced day-time heat loads can be observed.These are the results of additional heat contributions from solar incident radiation to space heating.2.4.2.Night setback controlNight set back control is when the set point for the indoor temperature is lowered during the night.The traditional thought behind this control strategy is to get a lower indoor temperature during nights and thereby decrease the total heat demand.But most buildings have nowadays high time constants,giving a slow reduction of the indoor temperature due to appropriate insulation and airtight building envelopes.The indoor temperature will not decrease so much that a noticeable heat demand reduction will oc-cur.The only result of night set back applied to energy efficient buildings is to move some heat load from nights to mornings. Hence,night setback control is only suitable and profitable for buildings with high specific demands and short time constants due to bad insulation and non-airtight building envelopes.A typical heat load pattern for night setback control can be ob-served in Fig.2.Lower heat loads during nights are followed by high peak heat loads in the mornings,but these peaks vanish quite fast.The peaks are the results of the reheating of the cooled off heating system during the preceding nights.2.4.3.Time clock operation control5days a weekVentilation in a building does not necessarily have to be in oper-ation24h a day7days a week.Schools,for example,only have178H.Gadd,S.Werner/Applied Energy108(2013)176–183daytime activities from Mondays to Fridays.At nights and weekends,no or few people are in the buildings and no or reduced ventilation will be appropriate.Full operation of the ventilation systems just increases the amount of used heat energy for the customer.For working days activities only,time clock operation control can be applied 5days a week.A typical heat load pattern for time clock operation control 5days a week can be observed in Fig.3.Note that the heat load during nights and weekends is the same.During these periods the ventilation is turned off or reduced and the radiator system is supplying heat to keep the indoor temperature at a desirable level.2.4.4.Time clock operation control 7days a weekSome buildings have a daytime use 7days a week.One example is a shopping mall that is open 7days a week in daytime.Still the ventilation can be shut off during the night since no or few people are inside the building at these times.A typical heat load pattern for time clock operation control 7days a week can be observed in Fig.4.The pattern is similar totime clock operation control 5days a week ,but the ventilation is also in operation at the weekends as well and not only during working days.3.ResultsThe relative seasonal variation for heat loads in buildings is most dependent on customer category,and the type of activity in the buildings.Industrial,commercial,and public administration buildings have a relative seasonal variation of around 30–40%,independent of the annual relative daily variation.Health and Social Services buildings have around 30%and multi-dwelling buildings have the lowest relative seasonal variation between 20%and 30%.The annual relative daily variation has a large range in industrial,commercial and public administration buildings.Since most of these buildings should have time clock operation control of ventila-tion,they should also have large annual relative daily variations.The results in Figs.5–9indicate that time clock operation control of ventilation generates high annual relative daily variations.Still,H.Gadd,S.Werner /Applied Energy 108(2013)176–183179there are in every group of building types some that seem to have too low or too high annual relative daily variation.Notable are the outliers that deviate from what seems to be a normal heat loadpattern.180H.Gadd,S.Werner /Applied Energy 108(2013)176–1833.1.Multi-dwelling buildingsMulti-dwelling buildings are relatively homogeneous types of buildings with respect to heat load patterns.They are in use 24ha day all year around and domestic hot water share of the heat load is relatively high,about 20%of the annual heat demand according to [15].Multi-dwelling buildings are characterised by low annual relative daily variation.As can be seen in Fig.5,most of the multi-dwelling buildings have heat load patterns from continuous operation control.Only a few buildings seem to have some kind of night setback.Typical values for annual relative daily variation are between 4%and 8%.The relative seasonal variation is in the upper range compared to the other types of buildings in this study.The multi-dwelling buildings have an annual relative seasonal varia-tion in the range of 22–32%.Most of the buildings are well gath-ered in the diagram,but there are 4outliers.Most notable is the building with night setback heat load pattern with 24%annual relative daily variation but also the buildings with low annual rel-ative seasonal variations are notable.It indicates a low correlation between heat load and outdoor temperature.3.2.Health and Social Services buildingsHealth and Social Services buildings can be anything from a hos-pital to an office for the administrators and are thereby a very het-erogeneous group.Some buildings like hospitals have a heat load pattern close to multi-dwelling buildings with 24h activity every day.Other buildings have just daytime activities and have heat load patterns close to traditional office buildings with time clock opera-tion control of ventilation and low domestic hot water use.Remarks in Fig.6are as follows:one building with a heat load pattern from continuous operation control and an annual relative daily variation of 13%,and one building with a heat load pattern from time clock operation control 7days a week,but only 10%of annual relative daily variation.3.3.Industrial demandsThe definition of industrial buildings is that they are used for the manufacture of materials or products.Their heat demands are more diversified than multi-dwelling buildings.There can be between one-to five-shift operations and thereby everything between 8and 24h per day of activity.Heat demands can appear for both space heating and industrial processes.Some industries have excess heat and can thereby decrease their external heat demands partly.In most industrial buildings,there is no or less activity during nights and weekends which is why time clock oper-ation control of ventilation is appropriate.Domestic hot water use is normally low compared to multi-dwelling buildings,i.e.summer heat load when no space heating is required ought to be low.As can be observed in Fig.7fewer than half of the industrial customers seem to have time clock operation control of ventila-tion.A large portion of continuous heat load pattern indicates that the ventilation or other heat demands are running 24h a day in lots of industrial buildings.Most notable is the building with 4%annual relative seasonal variation and 2%annual relative variation.It is a more or less constant heat load over the mercial buildingsFew commercial buildings are in operation at night.This is con-firmed by the fact that most commercial buildings have heat load patterns from time clock operation control during 5or 7days a week.Still,there are some customers with a heat load pattern from continuous operation control.Commercial buildings consist of trading companies,restaurants,hotels,service companies,amusement and recreational services.These are buildings where activities take place mainly during the daytime 5–7days a week.These buildings should have timeclockH.Gadd,S.Werner /Applied Energy 108(2013)176–183181operation control of ventilation.The use of domestic hot water is low.An exception is hotels that have a heat load pattern close to multi-dwelling buildings with24h operation and a rather high share of domestic hot water of the heat load.Notable buildings in Fig.8are three buildings with a heat load pattern of continuous operation control,but with relatively high annual relative daily variations.There are also three buildings with heat load patterns of time clock operation control during7days a week with notably low annual relative daily variation.3.5.Public administration buildingsTypical public administration buildings are schools and munici-pal administration buildings that are mainly in use during office hours5days a week,gymnasiums,public baths,that are also used at weekends,but alsofire stations and police stations with a24h operation.In Fig.9this is confirmed by heat load patterns from Continuous operation control,Time clock operation control5days a week and Time clock operation control7days a week.The use of domestic hot water is shifting,but it is low compared to multi-dwelling buildings.Three buildings are noteworthy with low annual relative seasonal variation.Also one building with a continuous heat load pattern of15%annual relative daily variation is notable.3.6.Cross-cutting resultsThe different types of buildings can be divided into three differ-ent larger groups depending on variation in annual relative daily variation.Low annual relative daily variations:Multi-dwelling buildings. Intermediate annual relative daily variations:Health and Social Services buildings.High annual relative daily variations:Commercial,Industrial, and Public administration customers.The most important cause for high annual relative daily variation is time clock operation control of ventilation.In buildings with activity only parts of the day or week,ventilation is reduced or shut off when no indoor activities take place.In an office, normally no or very few people are in the building at nights and weekends.In a multi-dwelling building though,tenants are using heat24h a day all year around.Another setting that increases annual relative daily variation is night setback control.Even though,night setback control does not have an influence on heat demand reduction,it is still not unusual that night setback controls are applied.A heavy building with a thermal time constant of at least100h,which is the case with all the buildings in this study,will not cool off during a few night hours.The only results are large heat load peaks when the set point for the indoor temperature changes.The only thing that cools off is the ventilation and heating system,and in the morning,when the set point changes,a high heat load peak is a consequence to warm up the heating and ventilation system.To enhance the method in this paper,an inventory of the build-ings to confirm the settings for Continuous operation control,Time clock operation control5days a week,Time clock operation control 7days a week and Night setback control should be performed.This inventory together with a more suitable subdivision of customer categories that merge with an expected heat load pattern would increase the resolution of the method.It could either be afiner sub-division of the existing customer categories or an entirely new sub-division.In this work,heat load patterns were identified manually. In practice use,the heat load patterns must be identified automat-ically e.g.by using some kind of clustering data mining method.3.7.Methodology use in practiceThe method presented in this paper is used to analyse the heat load pattern for141buildings.For this method to be usable, expected heat load pattern for each building must be determined. For some buildings,this is easy such as for multi-dwelling build-ings and school buildings.For others buildings,a more explicit knowledge of the activity in respectively building can be necessary. In city centres for instance,shops,offices and dwellings can occur within the same building.Well working multi-dwelling buildings should have a continu-ous heat load pattern resulting in low daily heat load variations.A brief study of the analysed buildings shows that in some multi-dwelling buildings fast heat loadfluctuations occur with high daily variations as a result.I.e.high daily variations in build-ings with continuous heat load pattern,indicates bad performance of the substation.In school buildings,time clock operation is expected since there is activity in the building daytime,working days,only.Ventilation should be shut off during nights and week-ends resulting in high daily heat load variations.If the daily varia-tions are relatively low,one could expect that the ventilation is only reduced to a small extent or only shut off in parts of the school.Hence,schools should have time clock operation5days a week heat load pattern and high daily variations.Low seasonal heat load variations indicate low correlation between outdoor temperature and heat demand.For a building with mainly space heating heat demand,low seasonal heat load variations could indi-cate that heating is turned on even when it is not needed.The two variables annual relative daily variation and annual relative seasonal variation in combination with existing and desir-able heat load pattern could be used in order to identify heat load demands that are disadvantageous for the heat customers.The re-sult could be used as an input to develop a method to automati-cally identify district heating customers with a non-correct or a disadvantageous heat demand pattern.4.ConclusionsThe three major conclusions are associated both to the method used and the objects analysed.First,normal heat load patterns vary with applied control strat-egy,season,and customer category.High annual relative daily var-iation in a multi-dwelling building would indicate that something is wrong,but on the contrary,on commercial premises and in industries there is something wrong,if there is not a high annual relative daily variation.But as can be observed in the results sec-tion,it is not an unambiguous result.A large variation of heat load patterns among various buildings implies that a standard heat load pattern for customer substations does not exist.Second,it is possible to identify obvious outliers compared to normal heat loads with the two descriptive parameters used in this initial analysis.This makes it easy to systemize the identification of customers with a disadvantageous heat load pattern for both the customers and the district heating companies.Third,the developed method can probably be enhanced by redefining the customer categories by their indoor activities.The best example is Health and Social Services buildings that should be split into groups depending on the activity and the duration of activity in the buildings.AcknowledgementsThis analysis was performed by thefinancial support from Fjärrsyn,the Swedish district heating research programme,and Öresundskraft,which also provided the time series for the analyses.182H.Gadd,S.Werner/Applied Energy108(2013)176–183。

Refrigeration System Performance using Liquid-Suction Heat ExchangersS. A. Klein, D. T. Reindl, and K. BroWnellCollege of EngineeringUniversity of Wisconsin - MadisonAbstractHeat transfer devices are provided in many refrigeration systems to exchange energy betWeen the cool gaseous refrigerant leaving the evaporator and Warm liquid refrigerant exiting the condenser. These liquid-suction or suction-line heat exchangers can, in some cases, yield improved system performance While in other cases they degrade system performance. Although previous researchers have investigated performance of liquid-suction heat exchangers, this study can be distinguished from the previous studies in three Ways. First, this paper identifies a neW dimensionless group to correlate performance impacts attributable to liquid-suction heat exchangers. Second, the paper extends previous analyses to include neW refrigerants. Third, the analysis includes the impact of pressure drops through the liquid-suction heat exchanger on system performance. It is shoWn that reliance on simplified analysis techniques can lead to inaccurate conclusions regarding the impact of liquid-suction heat exchangers on refrigeration system performance. From detailed analyses, it can be concluded that liquid-suction heat exchangers that have a minimal pressure loss on the loW pressure side are useful for systems using R507A, R134a, R12, R404A, R290, R407C, R600, and R410A. The liquid-suction heat exchanger is detrimental to system performance in systems using R22, R32, and R717.IntroductionLiquid-suction heat exchangers are commonly installed in refrigeration systems With the intent of ensuring proper system operation and increasing system performance.Specifically, ASHRAE(1998) states that liquid-suction heat exchangers are effective in:1) increasing the system performance2) subcooling liquid refrigerant to prevent flash gas formation at inlets to expansion devices3) fully evaporating any residual liquid that may remain in the liquid-suction prior to reaching the compressor(s)Figure 1 illustrates a simple direct-expansion vapor compression refrigeration system utilizing a liquid-suction heat exchanger. In this configuration, high temperature liquid leaving the heat rejection device (an evaporative condenser in this case) is subcooled prior to being throttled to the evaporator pressure by an expansion device such as a thermostatic expansion valve. The sink for subcoolingthe liquid is loW temperature refrigerant vapor leaving the evaporator. Thus, the liquid-suction heat exchanger is an indirect liquid-to-vapor heat transfer device. The vapor-side of the heat exchanger (betWeen the evaporator outlet and the compressor suction) is often configured to serve as an accumulator thereby further minimizing the risk of liquid refrigerant carrying-over to the compressor suction. In cases Where the evaporator alloWs liquid carry-over, the accumulator portion of the heat exchanger Will trap and, over time, vaporize the liquid carryover by absorbing heat during the process of subcooling high-side liquid.BackgroundStoecker and Walukas (1981) focused on the influence of liquid-suction heat exchangers in both single temperature evaporator and dual temperature evaporator systems utilizing refrigerant mixtures. Their analysis indicated that liquid-suction heat exchangers yielded greater performance improvements When nonazeotropic mixtures Were used compared With systems utilizing single component refrigerants or azeoptropic mixtures. McLinden (1990) used the principle of corresponding states to evaluate the anticipated effects of neW refrigerants. He shoWed that the performance of a system using a liquid-suction heat exchanger increases as the ideal gas specific heat (related to the molecular complexity of the refrigerant) increases. Domanski and Didion (1993) evaluated the performance of nine alternatives to R22 including the impact of liquid-suction heat exchangers. Domanski et al. (1994) later extended the analysis by evaluating the influence of liquid-suction heat exchangers installed in vapor compression refrigeration systems considering 29 different refrigerants in a theoretical analysis. Bivens et al. (1994) evaluated a proposed mixture to substitute for R22 in air conditioners and heat pumps. Their analysis indicated a 6-7% improvement for the alternative refrigerant system When system modifications included a liquid-suction heat exchanger and counterfloW system heat exchangers (evaporator and condenser). Bittle et al. (1995a) conducted an experimental evaluation of a liquid-suction heat exchanger applied in a domestic refrigerator using R152a. The authors compared the system performance With that of a traditional R12-based system. Bittle et al. (1995b) also compared the ASHRAE method for predicting capillary tube performance (including the effects of liquid-suction heat exchangers) With experimental data. Predicted capillary tube mass floW rates Were Within 10% of predicted values and subcooling levels Were Within 1.7 C (3F) of actual measurements.This paper analyzes the liquid-suction heat exchanger to quantify its impact on system capacity and performance (expressed in terms of a system coefficient of performance, COP). The influence of liquid-suction heat exchanger size over a range of operating conditions (evaporating and condensing) is illustrated and quantified using a number of alternative refrigerants. Refrigerants included in the present analysis are R507A, R404A, R600, R290,R134a, R407C, R410A, R12, R22, R32, and R717. This paper extends the results presented in previous studies in that it considers neW refrigerants, it specifically considers the effects of the pressure drops,and it presents general relations for estimating the effect of liquid-suction heat exchangers for any refrigerant.Heat Exchanger EffectivenessThe ability of a liquid-suction heat exchanger to transfer energy from the Warm liquid to the cool vapor at steady-state conditions is dependent on the size and configuration of the heat transfer device. The liquid-suction heat exchanger performance, expressed in terms of an effectiveness, is a parameter in the analysis. The effectiveness of the liquid-suction heat exchanger is defined in equation (1):Where the numeric subscripted temperature (T) values correspond to locations depicted in Figure 1. The effectiveness is the ratio of the actual to maximum possible heat transfer rates. It is related to the surface area of the heat exchanger. A zero surface area represents a system Without a liquid-suction heat exchanger Whereas a system having an infinite heat exchanger area corresponds to an effectiveness of unity.The liquid-suction heat exchanger effects the performance of a refrigeration system by in fluencing both the high and loW pressure sides of a system. Figure 2 shoWs the key state points for a vapor compression cycle utilizing an idealized liquid-suction heat exchanger on a pressure-enthalpy diagram. The enthalpy of the refrigerant leaving the condenser (state 3) is decreased prior to entering the expansion device (state 4) by rejecting energy to the vapor refrigerant leaving the evaporator (state 1) prior to entering the compressor (state 2). Pressure losses are not shoWn. The cooling of the condensate that occurs on the high pressure side serves to increase the refrigeration capacity and reduce the likelihood of liquid refrigerant flashing prior to reaching the expansion device. On the loW pressure side, the liquid-suction heat exchanger increases the temperature of the vapor entering the compressor and reduces the refrigerant pressure, both of Which increase the specific volume of the refr igerant and thereby decrease the mass floW rate and capacity. A major benefit of the liquid-suction heat exchanger is that it reduces the possibility of liquid carry-over from the evaporator Which could harm the compressor. Liquid carryover can be readily caused by a number of factors that may include Wide fluctuations in evaporator load and poorly maintained expansiondevices (especially problematic for thermostatic expansion valves used in ammonia service).(翻译)冷却系统利用流体吸热交换器克来因教授,布兰顿教授, , 布朗教授威斯康辛州的大学–麦迪逊摘录加热装置在许多冷却系统中被用到,用以制冷时遗留在蒸发器中的冷却气体和离开冷凝器发热流体之间的能量的热交换.这些流体吸收或吸收热交换器,在一些情形中,他们降低了系统性能, 然而系统的某些地方却得到了改善. 虽然以前研究员已经调查了流体吸热交换器的性能, 但是这项研究可能从早先研究的三种方式被加以区别. 首先,这份研究开辟了一个无限的崭新的与流体吸热交换器有关联的群体.其次,这份研究拓宽了早先的分析包括新型制冷剂。

附录A 英语原文Air-Conditioning Design for Data Centers—Accommodating Current Loads and Planning forthe FutureAbstractToday’s modern enterprise data center must be capable of efficiently operating at current average power densities of 30 to 50 W/ft2 (~320 to 540 W/m2) and, based upon industry trends, support growth in the foreseeable future toward 150 W/ft2 (~1,610 W/m2) and also incorporate provision to possibly support significantly higher power densities in local areas. This paper summarizes the industry trends toward greater power consumption and higher processing speed servers and gives an overview of current and expected techniques for cooling high power consuming cabinets and mainframes. The potential impact of these trends and new techniques on the design of the raised floor cooling system will also be discussed. Additionally, during the installation of new equipment and the migration of equipment from other data centers to the new center, the new data center at start-up is often required to operate with almost no computing equipment load. The start-up conditions can be an operational problem for equipment sized to operate at maximum load. In response to the potentially large range of power density operation and the highcosts of data centerconstruction, the majority of owner operators plan to accommodate this expected power density growth in phases. This paper summarizes the planning to accommodate the various load conditions of the mechanical systems for one recently designed data center, including raised floor cooling, central plants, and pipe distribution.1 INTRODUCTIONThe air-conditioning system in today's modern enterprise data center must be capable of continuously supporting on a 7cays/week, 24 hours/day, 365 days/year basis with current power densities averaging 30 to 50 W/ft2 (~320 to 540 W/m2)and, based on the industry trends of faster processing speed requirements and higher power consuming servers, incorporate provision for growth in the foreseeable future toward 150W/ft2 (~1,610 W/m2). In addition, currently available computing equipment can be configured to require significantly higher power densities in local areas. The modern data center must also be capable of supporting these local higher densities as well.For the purposes of this paper, power density capacity of a data center in W/ft2 is defined to be the total electric power capacity available to the computing equipment in watts divided by the total raised floor area in square feet of the data center’s computer room Power d ensity capacity (W/ft2) = total UPS power (W)/total raised floor area (ft2)The computer room floor of the data center would incorporate all of thecomputing equipment, required access for that equipment, egress paths, air-conditioning equipment, and power distribution units (PDUs). The actual power density is defined as the actual power used by the computing equipment divided by the floor area occupied by the equipment plus any supporting space as described above.Actual power density (W/ft2) = computer power consumption (W)/required computer area (ft2)Empty or “white” space should not be included in the calculation of the actual power density.Computing equipment in the data center is generally composed of legacy rack servers, modern rack servers, blade servers, mainframes, network devices, and storage devices. Within each of these different categories of equipment there are numerous types of computing devices, many having different sizes and different power and cooling requirements.Ultimately, the total power consumption on the raised floor (and therefore the majority of the raised floor cooling load) is the sum of the actual power consumption of the individual computers themselves. Ideally, the air-conditioning system designer would have access to a complete list identifying the make and model of all equipment used, the power and cooling requirements of the equipment, and the client’s preferred equipment arrangement. In many cases, this list and plan are unavailable during the design phase of a project as the information technology (IT) planning for the center isgenerally on a design path parallel to the design of the data center itself.Often during the design phase, the project designers are asked to plan for any of the computing equipment placed anywhere on the raised floor. Within defined guidelines, the design criterion is often that the supporting mechanical and electrical systems must be able to support dense groups of IT cabinets containing blade and rack servers consuming significantly more power and requiring significantly more cooling than the average specified cooling requirement. In the end, air-conditioning design success is often judged on the ability to cool these dense groups of high power consuming computers and the mainframe equipment.Complicating things further, storage equipment and mainframe computers have very specific requirements from a cooling standpoint (locations of intake and exhaust as well as airflow and temperature) that generally require a different cooling approach to the cooling of servers. Additionally, from the IT planner’s standpoint, future generations of computers could require substantial reprogramming of the raised floor and substantially different cooling distribution systems. The infrastructure system should accommodate at least five changes in technology, with technology changes occurring approximately every three years.2 DATA CENTER POWER REQUIREMENTSAs indicated previously, data center power consumption and cooling requirements are a function of the types and quantities of computing equipmentto be installed. In general, the new blade and rack servers consume the most power on a unit area footprint basis followed, respectively, by the tape storage devices and mainframes/large partitioned servers and tape storage devices. Data centers primarily supporting older legacy servers and tape storage/retrieval processes can operate at power densities as low as 30 W/ft2 (~320 W/m2). Data centers primarily performing processing operations using new servers typically operate in the 60 to 100 W/ft2 (~645 to 1,075 W/m2) range. Standard 2.2 meter (86 inch) IT cabinets are subdivided into 42U’s of available computing equipment installation, with the “U” being the incremental unit height of computing equipment.3 DATA CENTER PLANNING GENERALThe majority of new corporate data center projects begin with both the migration of existing equipment and the installation of new equipment. This generally puts the initial design loads in the 40 to 60 W/ft2 range (~430 - 645 w/m2), although the power requirements at start-up are often much less, due to the fact that installation of equipment can be relatively slow but the data center must become operational upon installation of the first piece of hardware. Multi-year IT plans are developed identifying phased-in equipment and projected loads. These IT loads can then be translated to a phased-in plan for growth of the power and cooling systems.The most significant factors affecting construction cost of the data center are the design power density and the level of reliability. At a 75 W/ft2 (810W/m2) design power density, the construction cost can range from $1000 to $1500/ft2 ($10,750 to $16,130/m2) of raised floor, depending upon the required level of reliability. Given the high costs of data center construction, there is little reason to construct mechanical and electrical infrastructure that might see little use for a number of years. Developing phased plans for the installation of mechanical and electrical equipment, matching cooling and electrical infrastructure to IT requirements, makes cost-effective sense, requiring infrastructure costs only to be expended when required.In large data centers the mechanical and electrical infra-structure space requirements to support the power and cooling needs are significant relative to the size of the raised floor. At 75 W/ft2 (~810 W/m2) over 100,000 ft2 (~9,300 m2), the infra-structure space requirement can equal the size of the raised floor. Ultimately though, the maximum power requirement will set the physical size of the infrastructure and the ultimate delivery capability of the cooling systems and incoming electrical systems. Once the maximum capabilities of the infra-structure and the required growth stages have been set, the sizes and numbers of chillers, pumps, air handlers, and other support equipment can be determined and then the corresponding sizes of the mechanical and electrical rooms set.Due to the nature of the constant electric load that occurs in the data center, the use of “green” or energy-saving mechanical systems has been limited. Research into the use of more energy-efficient air-conditioning solutions isongoing [2]. However, when outdoor air temperatures permit, “free cooling” can be utilized as long as relative humidity control can be maintained.Decisions to increase power and cooling capabilities beyond the initial design levels will likely require invasive infrastructure expansion or even building additions. We there-fore believe it is critical to project power and square footage requirements as far forward as possible and also to consider a contingency for unexpected growth.Generally, the schematic design of a data center includes general arrangements and one-line drawings showing the initial and phased growth of all supporting infrastructure. Mechanical and electrical infrastructure should be in alignment from a power and cooling capability standpoint. Excess capability of either plant generally cannot be taken advantage of and is usually a poor investment. Once the specific infra-structure systems and the initial build density have been deter-mined, future increments of growth should be planned for using modules of the initially selected equipment and installed without interruption of any of the operating infrastructure.4 HUMIDIFICATION AND PRESSURIZATIONControl of humidity within the data center is essential to ensuring proper operation of the IT equipment. Humidity levels that are too low can cause a static electric discharge. Humidity levels that are too high can cause media failures in tape devices and other types of equipment failures. CRAH units, which perform relative humidity control using built-in reheat and humidificationequipment, can work against each other (some units in heating and others in cooling) when control set points are not identical and control tolerances are too small. This scenario can also occur even with all units operating with similar set points and dead-bands when control sensors are out of calibration or different areas of the data center operate under significantly different electrical power demands.To eliminate the possibility of this potentially energy-wasting scenario, the subject data center eliminated the electric reheat coils and humidification from the CRAH units and incorporated central station air handlers (AHUs) that served to provide humidification to the data center and a minimum reheat capability. The AHUs also served to introduce outdoor air as necessary to ventilate and pressurize the data center. Positive pressurization of the data center minimizes air infiltration along with potential pollutants that could negatively affect the computing equipment. To further minimize effects of the outdoor environment, the subject data center was constructed completely internal to the building (no common exterior wall), with vapor barriers provided on the data center walls as well as the entire building perimeter. Air locks were also provided at all entrances to the corridors that surrounded the data center.At 319.8 MBH (93.7 kW) of capacity, the cooling coils of the CRAH units operate with virtually no latent cooling. Based on this, the data center will operate with minimal requirement for humidification until a high-density requirement causes a number of the units to operate at full load. An analysis ofthe IT plan showed that a significant portion of the load (1875 kW) could be high-density cabinets, ultimately requiring a minimum of 17 units operating at full load (397 MBH (116.5 kW) sensible cooling and 24 MBH (7.0 kW) latent cooling. This corresponds to a total latent load of 408 MBH (119.6 kW) (17 units × 24 MBH [~7.0 kW] each), whichrequired a maximum of 384 #/h (2.9 kg/s) of steam. To meet this maximum requirement, each of the AHUs was furnished with ultrasonic humidifiers, each capable of meeting this load. To control humidity within the data center, the return air relative humidity and temperature in the return air to the AHUs was measured and converted to an absolute humidity, in grains of moisture per pound of dry air. Humidification is then enabled as necessary to ensure that the data center remains within an acceptable range of absolute humidity.5 SUPPORTING MECHANICAL INFRASTRUCTUREThe subject data center was initially planned for three phases of overall growth: phase 1 – 50,000 ft2 (4,650 m2) at 50 W/ft2 (~540 W/m2), phase 2 –100,000 ft2 (9,300 m2) at 50 W/ft2 (~540 W/m2), and phase 3 –100,000 ft2 (9,300 m2) at 75 W/ft2 (~810 W/m2). Although the largest component of the air-conditioning load is the electrical power that powers the IT equipment, there are numerous other components to the load that significantly increase the load over that required to directly support the IT equipment. An accurate summary of all components of the load through all phases of growth isnecessary to ensure that all air-conditioning requirements can be met both at start-up and throughout all phases of the growth. Additionally, the infrastructure is normally planned such that mechanical and electrical equipment is added as the load grows. As well as design loads, the air-conditioning system needs to be able to operate at start-up with minimal IT equipment in the data center. This requires an accurate analysis of the loads at start-up to ensure that the equipment selected can also operate properly at the minimum load.Many of the individual loads that compose the total air- conditioning load of a data center are typical of those found in office or institutional buildings, but there are also a number of other loads that are either unique to the data center or significantly larger. Typical to the conventional building are skin, lighting, and personal ventilation loads. These loads are generally less than those found in other buildings, as data center functions require no windows, overall lower lighting, and minimal personal ventilation due to the minimum staffing requirements to operate a center. Loads unique or significantly larger than those found in a commercial building include uninterruptible power supplies (UPS), battery room ventilation, and transformers. The modern data center contains numerousseparate electrical transformers that serve to step down voltage from the utility to the emergency power generation level, the UPS equipment, the mechanical, and the computing equipment itself. Load bank transformers are normally data center requirements as well to permit testing of the UPSequipment.To provide a Tier 4 (system plus system, dual path) mechanical and electrical infrastructure system that can provide 75 W/ft2 (~810 W/m2) of power over 100,000 ft2 (9,300 m2), the subject data center required about 100,000 ft2 (9,300 m2) of supporting infrastructure space. This space included UPS and battery rooms, numerous electrical rooms, and indoor centrifugal chiller and emergency generator power plants. Typically, the total square footage of the facility is built at day one and the building lit and air-conditioned. The combined lighting and skin loads in the subject data center vary from 4 to 6 W/ft2 (~43 to 65 W/m2) over the 200,000 ft2 (18,600 m2) facility (depending upon location in the facility) and are minimal when compared to the full growth load of 75 W/ft2 (~810 W/m2) over the 100,000 ft2 (9,300 m2). These loads are only slightly more significant when compared to the stage 1 load of 50 W/ft2 (~540 W/m2) over 50,000 ft2 (4,650 m2). If minimal IT load is available at start-up, the skin and lighting loads will compose the majority of the air-conditioning load. Air-conditioning equipment sized for operation at the maximum design loads is significantly oversized for cool-ing without an IT load and possibly not capable of operation at all without some IT load. Generally, data centers are constructed with an office component that adds to the initial required air-conditioning load.A thorough analysis of both the maximum and minimum loads is therefore required during design to ensure that the selected equipment is suitable for operation over its total expected operating range.When the operating loads meet the design loads, the majority of the air-conditioning requirement is to support the electrical loads. In addition to providing the design air-conditioning requirement on the raised floor, the air-conditioning system must also cool a number of electrical devices, the most significant of these being the UPS. The UPS converts the incoming AC power to DC and back to AC for the purposes of power cleaning and in the process rejects up to 8% of the incoming electrical power as a heat load. Additionally, numerous transformers step down power from the incoming voltage to the 208 or 120 volts used by the IT equipment. Transformers stepping down the voltage to the voltage used by the UPS (normally 480 volt) are often located in the UPS rooms them-selves. The transformers stepping down from the UPS voltage to the voltage used by the IT equipment (208 or 120 volts) are often located on the raised floor itself. Transformers generally reject up to 2% of the stepped down energy as heat.Additional electrical transformers also step down the voltage to that used by the mechanical equipment and other non-IT loads. For the subject data center, these transformers were located in separate mechanical substations, sized at 1.2 times the UPS power requirement. Additional transformers (in this case located outside) were also provided to step down the voltage from the utility supply voltage to that used by the emergency generators.Additionally, 480 volt load banks were provided for test-ing of the UPS system. These load banks are provided with dedicated transformers and arenormally sized to support the capacity of one UPS plant. This load is a relatively small percentage of the total load in a large center, since it occurs only during testing, but if this transformer is installed indoors, it is important to provide adequate cooling to prevent local overheating of the room during UPS testing.Aside from the ventilation to support the data center operating personnel, there are a number of ventilation requirements that can add to the requirements of a central cooling plant. These include the ventilation required to maintain the data center, UPS, and other electrical rooms at pressures slightly positive to the adjacent spaces. Also, the majority of building codes require battery room ventilation at the rate of 1 cfm/ft2 (5 L/s per m2) of battery room floor area. The subject data center incorporated six battery rooms at a minimum continuous ventilation rate of 2,250 cfm (~1060 L/s) each.Table 2 summarizes the maximum air-conditioning requirements for the subject facility. The data center loads include CRAH latent and fan heat added to the chilled water plant and therefore cause these loads to be slightly higher than the direct UPS power to the raised floor. As well as trans-former losses, the electrical losses also include motor inefficiencies in the chiller rooms, which were air-conditioned. The subject project incorporated open-drive motors on the chillers and therefore created a significant heat load in the chiller room itself. Skin and lighting loads are identified for the entire facility, and the ventilation load is tabulated separately.With chilled water from two central plants in a 2N configuration (to meet afault-tolerant design criteria), 1200 tons (4,219.2 kW) was determined to be the initial maximum load for phase 1, as well as the preferred chiller size for future installations. The initial maximum summertime load without IT equipment was determined to be no more than 270 tons (949.3 kW).Interfacing the chilled water central plant to the raised-floor cooling system is the piping system. To be able to quickly support the addition of air-conditioners as the data center load grows, it is standard practice to initially install the piping systems fully capable of meeting the maximum design load. Two approaches are available to provide a fault-tolerant piping system. The first is to provide dual chilled water supply and return to all air-conditioners and the second is to install chilled water supply and return piping loops around all of the air-conditioners. The first approach makes available completely redundant supply and return piping systems to all equipment in the event of failure or a planned maintenance outage of one of the two paths. The second approach utilizes isolation valves within the piping loop to permit all equipment to be fed from either direction of the loop in the event that one portion of the loop fails or has to undergo a planned outage.The subject data center, utilizing the looped approach, also had to accommodate any portions of the data center at operation of approximately 130 W/ft2 (~1,400 W/m2). Unfortunately, during the design the location of the high-density equipment was unknown; consequently, the majority of the data center’s piping loop was designed and then installed in phase 1 to be able toaccommodate a 130 W/ft2 (~1,400 W/m2) load.Ideally, the areas of high density would be known during design, allowing the pipe system to be designed and then balanced to accommodate the varying power densities. In the case of the subject data center, the initial water balance will evenly distribute water among all the units. Ultimately, rebalancing will be required to accommodate the high-density environment. As flow to the air-conditioning units during normal operation is from two directions, care must be taken when sizing the system to ensure that the ASHRAE-recommended minimum pipe velocities can be maintained during normal operation. Pipe sizes in both the looped and four-pipe systemsare generally smaller than those found in conventional two-pipe systems.6 SUMMARYPlanning and design of the air-conditioning system for a data center requires a thorough understanding of the types of computing equipment to be cooled, the initial and expected power densities, and any requirements to support locally higher power densities. These criteria are then used to design the raised floor cooling system, central plant, and piping systems. The raised floor cooling system itself should take into account that distribution cabinets of servers, mainframe computers, and storage application devices each have different cooling requirements that need to be separately addressed. Additionally, areas of high-density equipment could require significantly more air than other areas of the data center or possibly alternative cooling technologies just nowcoming to market or not as yet developed. The design must be flexible enough to accommodate several technology changes during the life of the facility. In some cases the initial start-up and first year of operation of the data center could require the mechanical systems to operate with little or no computing equipment load. Successful central or cooling plant design must be able to accommodate this low partial-load operation if required.7 REFERENCES[1].The Uptime Institute. 2000. Heat Density Trends in Data Processing Computer Systems and Telecommunications Equipment[2].Lawrence Berkeley National Laboratory.[3].ITileFlow version 1.7. Innovative Research, Plymouth[4].Flovent version 4.1. Flometrics.[5].Thermal Guidelines for Data Processing Environments. Atlanta: American Society of Heating, Refrigerating and Air-Conditioning Engineers, Inc. [6].Sullivan, R. 2002. Alternating Cold and Hot Aisles Pro-vide More Reliable Cooling for Server Farms.附录B 中文翻译数据中心空调系统设计,适应当前的负载和对未来的规划摘要:今天的现代企业数据中心必须能够有效地操作目前的平均功率密度30到50 W / ft2(~ 320 - 540 W / m2),根据行业趋势,支持经济增长在可预见的未来对150 W / ft2(~ 1610 W / m2),也将提供在当地地区可能支持更高的功率密度。

外文翻译(1)Refrigeration System Performance using Liquid-Suction Heat ExchangersS. A. Klein, D. T. Reindl, and K. BroWnellCollege of EngineeringUniversity of Wisconsin - MadisonAbstractHeat transfer devices are provided in many refrigeration systems to e xchange energy betWeen the cool gaseous refrigerant leaving the evaporator and Warm liquid refrigerant exiting the condenser. These liquid-suction or suction-line heat exchangers can, in some cases, yield improved system performance While in other cases they degrade system performance. Although previous researchers have investigated performance of liquid-suction heat exchangers, this study can be distinguished from the previous studies in three Ways. First, this paper identifies a neW dimensionless group to correlate performance impacts attributable to liquid-suction heat exchangers. Second, the paper extends previous analyses to include neW refrigerants. Third, the analysis includes the impact of pressure drops through the liquid-suction heat exchanger on system performance. It is shoWn that reliance on simplified analysis techniques can lead to inaccurate conclusions regarding the impact of liquid-suction heat exchangers on refrigeration system performance. From detailed analyses, it can be concluded that liquid-suction heat exchangers that have a minimal pressure loss on the loW pressure side are useful for systems using R507A, R134a, R12, R404A, R290, R407C, R600, and R410A. The liquid-suction heat exchanger is detrimental to system performance in systems using R22, R32, and R717.IntroductionLiquid-suction heat exchangers are commonly installed in refrigeration systems With the intent of ensuring proper system operation and increasing system performance.Specifically, ASHRAE(1998) states that liquid-suction heat exchangers are effective in:1) increasing the system performance2) subcooling liquid refrigerant to prevent flash gas formation at inlets to expansion devices3) fully evaporating any residual liquid that may remain in the liquid-suction prior to reaching the compressor(s)Figure 1 illustrates a simple direct-expansion vapor compression refrigeration system utilizing a liquid-suction heat exchanger. In this configuration, high temperature liquid leaving the heat rejection device (an evaporative con denser in this case) is subcooled prior to being throttled to the evaporator pressure by an expansion device such as a thermostatic expansion valve. The sink for subcoolingthe liquid is loW temperature refrigerant vapor leaving the evaporator. Thus, the liquid-suction heat exchanger is an indirect liquid-to-vapor heat transfer device. The vapor-side of the heat exchanger (betWeen the evaporator outlet and the compressor suction) is often configured to serve as an accumulator thereby further minimizing the risk of liquid refrigerant carrying-over to the compressor suction. In cases Where the evaporator alloWs liquid carry-over, the accumulator portion of the heat exchanger Will trap and, over time, vaporize the liquid carryover by absorbing heat during the process of subcooling high-side liquid.BackgroundStoecker and Walukas (1981) focused on the influence of liquid-suction heat exchangers in both single temperature evaporator and dual temperature evaporator systems utilizing refrigerant mixtures. Their analysis indicated that liquid-suction heat exchangers yielded greater performance improvements When nonazeotropic mixtures Were used compared With systems utilizing single component refrigerants or azeoptropic mixtures. McLinden (1990) used the principle of corresponding states to evaluate the anticipated effects of neW refrigerants. He shoWed that the performance of a system using a liquid-suction heat exchanger increases as the ideal gas specific heat (related to the molecular complexity of the refrigerant) increases. Domanski and Didion (1993) evaluated the performance of nine alternatives to R22 including the impact of liquid-suction heat exchangers. Domanski et al. (1994) later extended the analysis by evaluating the influence of liquid-suction heat exchangers installed in vapor compression refrigeration systems considering 29 different refrigerants in a theoretical analysis. Bivens et al. (1994) evaluated a proposed mixture to substitute for R22 in air conditioners and heat pumps. Their analysis indicated a 6-7% improvement for the alternative refrigerant system When system modifications included a liquid-suction heat exchanger and counterfloW system heat exchangers (evaporator and condenser). Bittle et al. (1995a) conducted an experimental evaluation of a liquid-suction heat exchanger applied in a domestic refrigerator using R152a. The authors compared the system performance With that of a traditional R12-based system. Bittle et al. (1995b) also compared the ASHRAE method for predicting capillary tube performance (including the effects of liquid-suction heat exchangers) With experimental data. Predicted capillary tube mass floW rates Were Within 10% of predicted values and subcooling levels Were Within 1.7 C (3F) of actual measurements.This paper analyzes the liquid-suction heat exchanger to quantify its impact on system capacity and performance (expressed in terms of a system coefficient of performance, COP). The influence of liquid-suction heat exchanger size over a range of operating conditions (evaporating and condensing) is illustrated and quantified using a number of alternative refrigerants. Refrigerants included in the present analysis are R507A, R404A, R600, R290,R134a, R407C, R410A, R12, R22, R32, and R717. This paper extends the results presented in previous studies in that it considers neW refrigerants, it specifically considers the effects of the pressure drops,and it presents general relations for estimating the effect of liquid-suction heat exchangers for any refrigerant.Heat Exchanger EffectivenessThe ability of a liquid-suction heat exchanger to transfer energy from the Warm liquid to the cool vapor at steady-state conditions is dependent on the size and configuration of the heat transfer device. The liquid-suction heat exchanger performance, expressed in terms of an effectiveness, is a parameter in the analysis. The effectiveness of the liquid-suction heat exchanger is defined in equation (1):Where the numeric subscripted temperature (T) values correspond to locations depicted in Figure 1. The effectiveness is the ratio of the actual to maximum possible heat transfer rates. It is related to the surface area of the heat exchanger. A zero surface area represents a system Without a liquid-suction heat exchanger Whereas a system having an infinite heat exchanger area corresponds to an effectiveness of unity.The liquid-suction heat exchanger effects the performance of a refrigeration system by in fluencing both the high and loW pressure sides of a system. Figure 2 shoWs the key state points for a vapor compression cycle utilizing an idealized liquid-suction heat exchanger on a pressure-enthalpy diagram. The enthalpy of the refrigerant leaving the condenser (state 3) is decreased prior to entering the expansion device (state 4) by rejecting energy to the vapor refrigerant leaving the evaporator (state 1) prior to entering the compressor (state 2). Pressure losses are not shoWn. The cooling of the condensate that occurs on the high pressure side serves to increase the refrigeration capacity and reduce the likelihood of liquid refrigerant flashing prior to reaching the expansion device. On the loW pressure side, the liquid-suction heat exchanger increases the temperature of the vapor entering the compressor and reduces the refrigerant pressure, both of Which increase the specific volume of the refr igerant and thereby decrease the mass floW rate and capacity. A major benefit of the liquid-suction heat exchanger is that it reduces the possibility of liquid carry-over from the evaporator Which could harm the compressor. Liquid carryover can be readily caused by a number of factors that may include Wide fluctuations in evaporator load and poorly maintained expansiondevices (especially problematic for thermostatic expansion valves used in ammonia service).(翻译)冷却系统利用流体吸热交换器克来因教授,布兰顿教授, , 布朗教授威斯康辛州的大学–麦迪逊摘录加热装置在许多冷却系统中被用到,用以制冷时遗留在蒸发器中的冷却气体和离开冷凝器发热流体之间的能量的热交换.这些流体吸收或吸收热交换器,在一些情形中,他们降低了系统性能, 然而系统的某些地方却得到了改善. 虽然以前研究员已经调查了流体吸热交换器的性能, 但是这项研究可能从早先研究的三种方式被加以区别. 首先,这份研究开辟了一个无限的崭新的与流体吸热交换器有关联的群体.其次,这份研究拓宽了早先的分析包括新型制冷剂。
外文翻译ANALYSIS OF HVAC SYSTEM ENERGYCONSERVATIONIN BUILDINGSABSTRACTE conomic development and people's increasing demand for energy, but the nature of the energy is not inexhaustible. Environment and energy issues become increasingly acute, if no measures are taken, then the energy will limit the rapid economic development of the question.With the improvement of living standard, building energy consumption in the proportion of total energy consumption is increasing. In developed countries, building energy consumption accounts for 40% of total energy consumption of the community, while the country despite the low level of socio-economic development, but the building energy consumption has nearly 30% of total energy consumption, and still rising. Therefore, in western countries or in China, building energy consumption is affecting the socio-economic status of the overall development of the question. In building energy consumption, the energy consumption for HVAC systems has accounted for 30% of building energy consumption -50%, with the extensive application of HVAC, energy consumption for HVAC systems will further increase Great. HVAC systems are often coupled with high-quality electric energy, and our power and relatively tight in some areas, lack of energy supply and demand which is bound to lead to further intensification of contradictions. Therefore, energy-saving heating, higher professional requirements is inevitable across the board.KEYWORDS:energy-saving,HVAC1. Energy saving design measures should be takenRapid changes in science and technology today, area HVAC new technologies emerge, we can achieve a variety of ways of energy saving HVAC systems.1.1 Starting from the design, selecting, designing HVAC systems, so that the efficient state of the economy running.Design is a leading engineering, system design will directly affect its performance. The building load calculation is an important part of the design, a common problem is that the current design of short duration, many designers to save time, wrong use of the design manual for the design or preliminary design estimates of cold, heat load with the unit construction area of cold, heat load index, direct construction design stage as hot and cold load to determine the basis, often making the total load is too large, resulting in heating equipment, air conditioning is too large, higher initial investment, operating costs, increased energy consumption.1.2 using the new energy-saving air-conditioning and heating comfort and healthy mannerAffect human thermal comfort environment of many parameters, different environmental parameters can get the same effect of thermal comfort, but for different heat and moisture parameters of the environment of its energy consumption air conditioning system is not the same.1.3 Actual situation of a reasonable choice of cold and heat sources, seek to achieve diversification of cold and heat sourceWith the extensive application of HVAC systems on non-renewable energy consumption also rose sharply, while the broken part of the ecological environment are becoming increasingly intensified. How to choose a reasonable heating sources, has caused widespread concern of all parties.1.4 to enhance the use of hot and cold recycling of the work, to achieve maximum energyHVAC systems to improve energy efficiency is one of the ways to achieve energy-saving air-conditioning. Heat recovery system installed mainly through energy recovery, with the air from wind energy to deal with new, fresh air can reducethe energy required for processing, reducing the load, to save energy. In the choice of heat recovery, the should be integrated with the local climate Tiao Jian, Jing Ji situation, Gong Cheng actual situation of harmful exhaust gases of the situation in a variety of factors Deng integrated to determine the Xuanyong suitable heat recovery, so as to achieve Hua Jiao Shao's investment, recovery of more heat (cold) the amount of purpose.1.5 focus on development of renewable energy, and actively promoting new energyAs the air-conditioning systems used in high-grade, non-renewable energy resources and environmental problems caused by the increasingly prominent, have to develop some reasonable and effective renewable energy to ease the current tensions. To heat (cold) and solar and other renewable resources used in air conditioning and refrigeration, has certain advantages, but also clean and pollution-free. Ground Source Heat Pump is a use of shallow and deep earth energy, including soil, groundwater, surface water, seawater, sewage, etc. as a cold source in winter and summer heat is not only heating but also a new central air-conditioning system cooling.2. Saving design problemsAchieve energy-saving HVAC systems, now has a lot of mature conditions, but in practical applications there are some problems:2.1 The issue of public awareness of energy conservationThe past is not enough public understanding of energy, and on the air conditioning is also very one-sided view. For a comfort of air conditioning system or heating system, should the human body has a very good comfort. But the prevailing view now is: the colder the better air-conditioning, heating the more heat the better. This is obviously we seek the comfort of air conditioning is contrary to the view. In fact, this not only greatly increase the energy consumption of air conditioning heating, indoor and outdoor temperature and because of the increase, but also to the human body's adaptability to different environmental decline, lowering the body immunity. Therefore, we need to improve advocacy efforts to change public to the traditional understanding of air conditioning and heating, vigorous publicity andpromotion in accordance with building standards and the cold heat energy metering devices to collect tolls, raise public consciousness of energy.2.2 The design concept of the problemReasonable energy-saving design is a prerequisite. At present, some designers due to inadequate attention to design empirical value when applied blindly, resulting in the increase of the initial investment, energy consumption surprising, therefore recommended that the government functions and the energy-saving review body, to increase the monitoring of the HVAC air-conditioning energy saving efforts enhance staff awareness of energy conservation design, so that energy conservation is implemented.2.3 The promotion of new technologies issueNew technology in the HVAC system for energy conservation provides a new direction. Such as ground source heat pump systems, solar cooling and heating system, not only to achieve efficient use of renewable energy, and can bring significant economic benefits, is worth promoting. However, as with any new technology, these new technologies are often high in cost, and the geographical conditions of use have certain limitations, and technically there are still many areas for improvement to improve. Therefore, new energy-efficient technologies, we should be according to local conditions, sum up experience, and actively promote.3. ConclusionHVAC systems saving energy in the building occupies a very important position, should attract enough attention to the designer. Designers should be from a design point of view fully into account the high and strict compliance with energy standards energy saving ideas to run through all aspects of the construction sector. Energy-saving technologies and renewable energy recycling, the Government and other relevant departments should support and vigorously promoted. And the design, construction, supervision, quality supervision, municipal administration and other departments should cooperate closely and pay close attention to implementing a cold, heat metering devices to collect tolls, so people really get benefit from energy efficient building, energy-saving construction and non-heating energy efficientbuilding can not have the same charge standard. At the same time to raise public awareness of energy conservation, and vigorously promote the development of new energy-saving technologies to achieve sustainable development of society.References[1] "residential design standard" DBJ14-037-2006.[2] "Public Buildings Energy Efficiency Design Standards" DBJ14-036-2006.[3] "Technical Specification for radiant heating" JGJ142-2004.析暖通空调系统在建筑中的节能问题摘要经济的发展使人们对能源的需求不断增加,但是自然界的能源并不是取之不尽,用之不竭的。
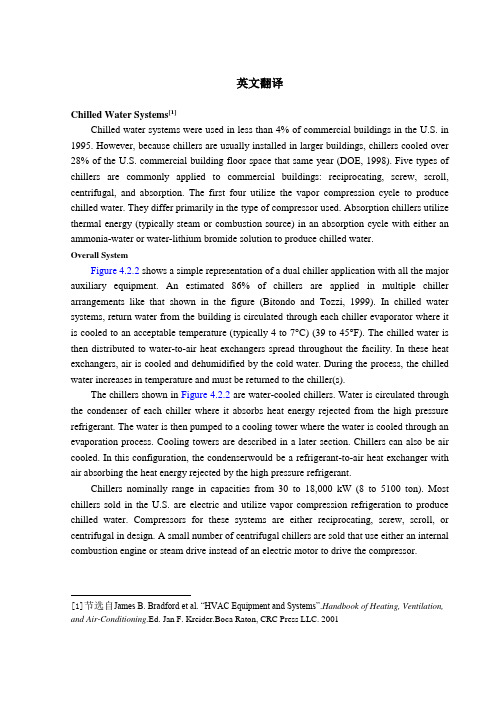
英文翻译Chilled Water Systems[1]Chilled water systems were used in less than 4% of commercial buildings in the U.S. in 1995. However, because chillers are usually installed in larger buildings, chillers cooled over 28% of the U.S. commercial building floor space that same year (DOE, 1998). Five types of chillers are commonly applied to commercial buildings: reciprocating, screw, scroll, centrifugal, and absorption. The first four utilize the vapor compression cycle to produce chilled water. They differ primarily in the type of compressor used. Absorption chillers utilize thermal energy (typically steam or combustion source) in an absorption cycle with either an ammonia-water or water-lithium bromide solution to produce chilled water.Overall SystemFigure 4.2.2 shows a simple representation of a dual chiller application with all the major auxiliary equipment. An estimated 86% of chillers are applied in multiple chiller arrangements like that shown in the figure (Bitondo and Tozzi, 1999). In chilled water systems, return water from the building is circulated through each chiller evaporator where it is cooled to an acceptable temperature (typically 4 to 7°C) (39 to 45°F). The chilled water is then distributed to water-to-air heat exchangers spread throughout the facility. In these heat exchangers, air is cooled and dehumidified by the cold water. During the process, the chilled water increases in temperature and must be returned to the chiller(s).The chillers shown in Figure 4.2.2 are water-cooled chillers. Water is circulated through the condenser of each chiller where it absorbs heat energy rejected from the high pressure refrigerant. The water is then pumped to a cooling tower where the water is cooled through an evaporation process. Cooling towers are described in a later section. Chillers can also be air cooled. In this configuration, the condenserwould be a refrigerant-to-air heat exchanger with air absorbing the heat energy rejected by the high pressure refrigerant.Chillers nominally range in capacities from 30 to 18,000 kW (8 to 5100 ton). Most chillers sold in the U.S. are electric and utilize vapor compression refrigeration to produce chilled water. Compressors for these systems are either reciprocating, screw, scroll, or centrifugal in design. A small number of centrifugal chillers are sold that use either an internal combustion engine or steam drive instead of an electric motor to drive the compressor.[1]节选自James B. Bradford et al. “HVAC Equipment and Systems”.Handbook of Heating, Ventilation, and Air-Conditioning.Ed. Jan F. Kreider.Boca Raton, CRC Press LLC. 2001FIGURE 4.2.2 A dual chiller application with major auxiliary systems (courtesy of Carrier Corporation).The type of chiller used in a building depends on the application. For large office buildings or in chiller plants serving multiple buildings, centrifugal compressors are often used. In applications under 1000 kW (280 tons) cooling capacities, reciprocating or screw chillers may be more appropriate. In smaller applications, below 100 kW (30 tons), reciprocating or scroll chillers are typically used.Vapor Compression ChillersTable 4.2.5 shows the nominal capacity ranges for the four types of electrically driven vapor compression chillers. Each chiller derives its name from the type of compressor used in the chiller. The systems range in capacities from the smallest scroll (30 kW; 8 tons) to the largest centrifugal (18,000 kW; 5000 tons).Chillers can utilize either an HCFC (R-22 andR-123) or HFC (R-134a) refrigerant. The steady state efficiency of chillers is often stated as a ratio of the power input (in kW) to the chilling capacity (in tons). A capacity rating of one ton is equal to 3.52 kW or 12,000 btu/h. With this measure of efficiency, the smaller number is better. As seen in Table 4.2.5, centrifugal chillers are the most efficient; whereas, reciprocating chillers have the worst efficiency of the four types. The efficiency numbers provided in the table are the steady state full-load efficiency determined in accordance to ASHRAE Standard 30 (ASHRAE, 1995). These efficiency numbers do not include the auxiliary equipment, such as pumps and cooling tower fans that can add from 0.06 to 0.31 kW/ton to the numbers shown (Smit et al., 1996).Chillers run at part load capacity most of the time. Only during the highest thermal loadsin the building will a chiller operate near its rated capacity. As a consequence, it is important to know how the efficiency of the chiller varies with part load capacity. Figure 4.2.3 shows a representative data for the efficiency (in kW/ton) as a function of percentage full load capacity for a reciprocating, screw, and scroll chiller plus a centrifugal chiller with inlet vane control and one with variable frequency drive (VFD) for the compressor. The reciprocating chiller increases in efficiency as it operates at a smaller percentage of full load. In contrast, the efficiency of a centrifugal with inlet vane control is relatively constant until theload falls to about 60% of its rated capacity and its kW/ton increases to almost twice its fully loaded value.FIGURE 4.2.3 Chiller efficiency as a function of percentage of full load capacity.In 1998, the Air Conditioning and Refrigeration Institute (ARI) developed a new standard that incorporates into their ratings part load performance of chillers (ARI 1998c). Part load efficiency is expressed by a single number called the integrated part load value (IPLV). The IPLV takes data similar to that in Figure 4.2.3 and weights it at the 25%, 50%,75%, and 100% loads to produce a single integrated efficiency number. The weighting factors at these loads are 0.12, 0.45, 0.42, and 0.01, respectively. The equation to determine IPLV is:Most of the IPLV is determined by the efficiency at the 50% and 75% part load values. Manufacturers will provide, on request, IPLVs as well as part load efficiencies such as those shown in Figure 4.2.3.FIGURE 4.2.4 Volume-pressure relationships for a reciprocating compressor.The four compressors used in vapor compression chillers are each briefly described below. While centrifugal and screw compressors are primarily used in chiller applications, reciprocating and scroll compressors are also used in smaller unitary packaged air conditioners and heat pumps.Reciprocating CompressorsThe reciprocating compressor is a positive displacement compressor. On the intake stroke of the piston, a fixed amount of gas is pulled into the cylinder. On the compressionstroke, the gas is compressed until the discharge valve opens. The quantity of gas compressed on each stroke is equal to the displacement of the cylinder. Compressors used in chillers have multiple cylinders, depending on the capacity of the compressor. Reciprocating compressors use refrigerants with low specific volumes and relatively high pressures. Most reciprocating chillers used in building applications currently employ R-22.Modern high-speed reciprocating compressors are generally limited to a pressure ratio of approximately nine. The reciprocating compressor is basically a constant-volumevariable-head machine. It handles variousdischarge pressures with relatively small changes in inlet-volume flow rate as shown by the heavy line (labeled 16 cylinders) in Figure 4.2.4. Condenser operation in many chillers is related to ambient conditions, for example, through cooling towers, so that on cooler days the condenser pressure can be reduced. When the air conditioning load is lowered, less refrigerant circulation is required. The resulting load characteristic is represented by the solid line that runs from the upper right to lower left of Figure 4.2.4.The compressor must be capable of matching the pressure and flow requirements imposed by the system. The reciprocating compressor matches the imposed discharge pressure at any level up to its limiting pressure ratio. Varying capacity requirements can be met by providing devices that unloadindividual or multiple cylinders. This unloading is accomplished by blocking the suction or discharge valves that open either manually or automatically. Capacity can also be controlled through the use of variable speed or multi-speed motors. When capacity control is implemented on a compressor, other factors at part-load conditions need to considered, such as (a) effect on compressor vibration and sound when unloaders are used, (b) the need for good oil return because of lower refrigerant velocities, and (c) proper functioning of expansion devices at the lower capacities.With most reciprocating compressors, oil is pumped into the refrigeration system from the compressor during normal operation. Systems must be designed carefully to return oil to the compressor crankcase to provide for continuous lubrication and also to avoid contaminating heat-exchanger surfaces.Reciprocating compressors usually are arranged to start unloaded so that normal torque motors are adequate for starting. When gas engines are used for reciprocating compressor drives, careful matching of the torque requirements of the compressor and engine must be considered.FIGURE 4.2.5 Illustration of a twin-screw compressor design (courtesy of CarrierCorporation).Screw CompressorsScrew compressors, first introduced in 1958 (Thevenot, 1979), are positive displacement compressors. They are available in the capacity ranges that overlap with reciprocating compressors and small centrifugal compressors. Both twin-screw and single-screw compressors are used in chillers. The twin-screw compressor is also called the helical rotary compressor. Figure 4.2.5 shows a cutaway of a twin-screw compressor design. There are two main rotors (screws). One is designated male (4 in the figure) and the other female (6 in the figure).The compression process is accomplished by reducing the volume of the refrigerant with the rotary motion of screws. At the low pressure side of the compressor, a void is created when the rotors begin to unmesh. Low pressure gas is drawn into the void between the rotors. As the rotors continue to turn, the gas is progressively compressed as it moves toward the discharge port. Once reaching a predetermined volume ratio, the discharge port is uncovered and the gas is discharged into the high pressure side of the system. At a rotation speed of 3600 rpm, a screw compressor has over 14,000 discharges per minute (ASHRAE, 1996).Fixed suction and discharge ports are used with screw compressors instead of valves, as used in reciprocating compressors. These set the built-in volume ratio — the ratio of the volume of fluid space in the meshing rotors at the beginning of the compression process to the volume in the rotors as the discharge port is first exposed. Associated with the built-in volume ratio is a pressure ratio that depends on the properties of the refrigerant being compressed. Screw compressors have the capability to operate at pressure ratios of above 20:1 (ASHRAE, 1996). Peak efficiency is obtained if the discharge pressure imposed by the system matchesthe pressure developed by the rotors when the discharge port is exposed. If the interlobe pressure in the screws is greater or less than discharge pressure, energy losses occur but no harm is done to the compressor.Capacity modulation is accomplished by slide valves that provide a variable suction bypass or delayed suction port closing, reducing the volume of refrigerant compressed. Continuously variable capacity control is most common, but stepped capacity control is offered in some manufacturers’ machines. Variable discharge porting is available on some machines to allow control of the built-in volume ratio during operation.Oil is used in screw compressors to seal the extensive clearance spaces between the rotors, to cool the machines, to provide lubrication, and to serve as hydraulic fluid for the capacity controls. An oil separator is required for the compressor discharge flow to remove the oil from the high-pressure refrigerant so that performance of system heat exchangers will not be penalized and the oil can be returned for reinjection in the compressor.Screw compressors can be direct driven at two-pole motor speeds (50 or 60 Hz). Their rotary motion makes these machines smooth running and quiet. Reliability is high when the machines are applied properly. Screw compressors are compact so they can be changed out readily for replacement or maintenance. The efficiency of the best screw compressors matches or exceeds that of the best reciprocating compressors at full load. High isentropic and volumetric efficiencies can be achieved with screw compressors because there are no suction or discharge valves and small clearance volumes. Screw compressors for building applications generally use either R-134a or R-22.译文冷水机组1995年,在美国,冷水机组应用在至少4%的商用建筑中。
第五章暖通CHAPTER V HVAC5.1 设计依据Design Basis5.1.1业主提供的设计要求(包括AS320标准)The Design Brief provided by client(e.g. AS320).5.1.2国家现行设计规范、标准和规定:The n ati onal curre nt desig n code, sta ndard and regulati ons:1)《采暖通风与空气调节设计规范》(GB50019-2003)Code for Desig n of Heati ng. Ven tilation and Air Con ditio ning ( GB50019-2003)2)《民用建筑供暖通风与空气调节设计规范》(GB50736-2012)Design code for heating ventilation and air conditioning of civil buildings ( GB50736-2012) 3)《建筑设计防火规范》(GB50016-2006)Code of Design on Building Fire Protection and Prevention ( GB50016-2006)4)上海市《建筑防排烟技术规程》(DGJ08-88-2006)Shanghai《Technical Specification for Building Smoke Control》(DGJ08-88-2006);5)《大气污染物综合排放标准》(GB16297-1996)Complex Discharge Standard for Atmospheric Pollutants ( GB16297-1996)6)《工业企业厂界环境噪声排放标准》(GB12348-2008)Emissio n Sta ndard for In dustrial En terprise Noise At bou ndary( GB12348-2008)7)AS320标准,FM认证,NFBA相关要求;AS320 /FM/NFBA Requireme nts8)各相关专业设计条件Design conditions provided by all disciplines5.2设计计算参数design parameter5.2.1室外气象参数outdoor meteorologic parameterDesig n dry-bulb temperature for summer air con diti oning, outdoor夏季空调室外计算湿球温度27.9 C Desig n wet-bulb temperature for summer air con diti oning, outdoor夏季空调计算日平均温度30.8 C Desig n daily mea n temperature for summer air con diti oning冬季空调计算温度-2.2 C Desig n temperature for win ter air con diti oning冬季空调计算相对湿度75%Relative humidity for wi nter air con diti oning冬季通风计算温度 2.4CDesig n temperature for win ter ven tilati on夏季通风室外计算干球温度31.2 C Desig n dry-bulb temperature for summer ven tilati on, outdoor极端最高温度39.4 C Extreme maximum temperature极端最低温度-10.1 C Extreme minimum temperature室外风速outdoor wind velocity冬季平均 2.6m/s Mea n value for wi nter夏季平均 3.1m/s主导风向及频率prevaili ng wi nd direct ion and freque ncy冬季NW 14%Win ter夏季SE 14%Summer全年SE 10% Whole year室外空气计算参数outdoor air calculation parameters夏季空调室外计算干球温度344C大气压力atmospheric pressure冬季Win ter 1025.4夏季Summer 1005.4 5.2.2室内设计条件in door desig n con diti on5.3设计范围Design Scope生产区域的空调通风系统。
英文文献Air Conditioning SystemsAir conditioning has rapidly grown over the past 50 years, from a luxury to a standard system included in most residential and commercial buildings. In 1970, 36% of residences in the U.S. were either fully air conditioned or utilized a room air conditioner for cooling (Blue, et al., 1979). By 1997, this number had more than doubled to 77%, and that year also marked the first time that over half (50.9%) of residences in the U.S. had central air conditioners (Census Bureau, 1999). An estimated 83% of all newhomes constructed in 1998 had central air conditioners (Census Bureau, 1999). Air conditioning has also grown rapidly in commercial buildings. From 1970 to 1995, the percentage of commercial buildings with air conditioning increased from 54 to 73% (Jackson and Johnson, 1978, and DOE, 1998).Air conditioning in buildings is usually accomplished with the use of mechanical or heat-activated equipment. In most applications, the air conditioner must provide both cooling and dehumidification to maintain comfort in the building. Air conditioning systems are also used in other applications, such as automobiles, trucks, aircraft, ships, and industrial facilities. However, the description of equipment in this chapter is limited to those commonly used in commercial and residential buildings.Commercial buildings range from large high-rise office buildings to the corner convenience store. Because of the range in size and types of buildings in the commercial sector, there is a wide variety of equipment applied in these buildings. For larger buildings, the air conditioning equipment is part of a total system design that includes items such as a piping system, air distribution system, and cooling tower. Proper design of these systems requires a qualified engineer. The residential building sector is dominatedby single family homes and low-rise apartments/condominiums. The cooling equipment applied in these buildings comes in standard “packages” that are often both sized and installed by the air conditioning contractor.The chapter starts with a general discussion of the vapor compression refrigeration cycle then moves to refrigerants and their selection, followed by packaged Chilled Water Systems。
青青AHU =air handling unit 空调箱air conditioning load空调负荷air distribution气流组织air handling unit 空气处理单元air shower 风淋室air-side pressure.drop空气侧压降aluminum accessories in clean room 洁净室安装铝材as-completed drawing 修改竣工图layout 设计图brass stop valve 铜闸阀canvas connection terminal 帆布接头centigrade scale 摄氏温度chiller accessories水冷柜机排水及配料chiller assembly水冷柜机安装工费chiller unit 水冷柜机基础clean bench 净化工作台clean class 洁净度clean room 洁净室无尘室correction factor修正系数DCC=dry coil units 干盘管district cooling 区域供冷direct return system异程式系统displacement ventilation置换通风drawn No.图号elevation立面图entering air temp进风温度entering water temp进水温度Fahrenheit scale 华氏温度fan coil unit 风机盘管FFU=fan filter units 风扇过滤网组final 施工图flow velocity 流速fresh air supply 新风供给fresh air unit 新风处理单元ground source heat pump地源热泵gross weight 毛重heating ventilating and air conditioning 供热通风与空气调节HEPA=high efficiency particulate air 高效过滤网high efficiency particulate air filters高效空气过滤器horizontal series type水平串联式hot water supply system生活热水系统humidity 湿度hydraulic calculation水力计算isometric drawing轴测图leaving air temp 出风温度leaving water temp出水温度lood vacuum pump中央集尘泵NAU=make up air handling unit schedule 外气空调箱natural smoke exhausting自然排烟net weight 净重noise reduction消声nominal diameter 公称直径oil-burning boiler燃油锅炉one way stop return valve 单向止回阀operation energy consumption运行能耗pass box 传递箱particle sizing and counting method 计径计数法Piping accessories 水系统辅材piping assembly 配管工费plan 平面图RAC=recirculation air cabinet unit schedule 循环组合空调单元ratio controller 比例调节器ratio flow control 流量比例控制ratio gear 变速轮ratio meter 比率计rational 合理性的,合法的;有理解能力的rationale (基本)原理;原理的阐述rationality 有理性,合理性rationalization proposal 合理化建义ratio of compression 压缩比ratio of expansion 膨胀比ratio of run-off 径流系数ratio of slope 坡度ratio of specific heat 比热比raw 生的,原状的,粗的;未加工的raw coal 原煤raw cotton 原棉raw crude producer gas 未净化的发生炉煤气raw data 原始数据raw fuel stock 粗燃料油raw gas 未净化的气体real gas 实际气体realignment 重新排列,改组;重新定线realm 区域,范围,领域real work 实际工作ream 铰孔,扩孔rear 后部,背面,后部的rear arch 后拱rear axle 后轴rear-fired boiler 后燃烧锅炉rear pass 后烟道rearrange 调整;重新安排[布置] rearrangement 调整,整顿;重新排列[布置] reason 理由,原因;推理reasonable 合理的,适当的reassembly 重新装配reaumur 列氏温度计reblading 重装叶片,修复叶片recalibration 重新校准[刻度]recapture 重新利用,恢复recarbonation 再碳化作用recast 另算;重作;重铸receiving basin 蓄水池receiving tank 贮槽recentralizing 恢复到中心位置;重定中心;再集中receptacle 插座[孔];容器reception of heat 吸热recessed radiator 壁龛内散热器,暗装散热器recharge well 回灌井reciprocal 倒数;相互的,相反的,住复的reciprocal action 反复作用reciprocal compressor 往复式压缩机reciprocal feed pump 往复式蒸汽机reciprocal grate 往复炉排reciprocal motion 住复式动作reciprocal proportion 反比例reciprocal steam engine 往复式蒸汽机reciprocate 往复(运动),互换reciprocating 往复的,来回的,互相的,交替的reciprocating ( grate ) bar 往复式炉排片reciprocating compressor 往复式压缩机reciprocating condensing unit 往复式冷冻机reciprocating packaged liquid chiller 往复式整体型冷水机组reciprocating piston pump 往复式活塞泵reciprocating pump 往复泵,活塞泵reciprocating refrigerator 往复式制冷机recirculate 再循环recirculated 再循环的recirculated air 再循环空气[由空调场所抽出,然后通过空调装置,再送回该场所的回流空气]recirculated air by pass 循环空气旁路recircilated air intake 循环空气入口recirculated cooling system 再循环冷却系统recirculating 再循环的,回路的recirculating air duct 再循环风道recirculating fan 再循环风机recirculating line 再循环管路recirculating pump 再循环泵recirculation 再循环recirculation cooling water 再循环冷却水recirculation ratio 再循环比recirculation water 再循环水reclaim 再生,回收;翻造,修复reclaimer 回收装置;再生装置reclamation 回收,再生,再利用reclamation of condensate water蒸汽冷凝水回收recombination 再化[结]合,复合,恢复recommended level of illumination 推荐的照度标准reconnaissance 勘察,调查研究record drawing 详图、大样图、接点图d. GENERAL ROOM NAME常用房间名称,,e. ROOFING & CEILING屋面及天棚,,f. W ALL(CLADDING) 墙体(外墙板),,g. FLOOR & TRENCH 地面及地沟,,h. DOORS 、GLASS、WINDOWS & IRONMONGERY(HARDWARE)门、玻璃、窗及五金件,,I. STAIRCASE、LANDING & LIFT(ELEV A TOR)楼梯、休息平台及电梯,,j. BUILDING MA TERIAL WORDS AND PHRASES建筑材料词汇及短语,,【Bricks and Tiles 砖和瓦】,【Lime, Sand and Stone灰、砂和石】,【Cement, Mortar and Concrete水泥、砂浆和混凝土】,【Facing And Plastering Materials,饰面及粉刷材料】,,,,,,【Asphalt (Bitumen) and Asbestos沥青和石棉】,【Timber 木材】,【Metallic Materials 金属材料】,【Non-Ferrous Metal 有色金属】,,【Anti-Corrosion Materials防腐蚀材料】,【Building Hardware 建筑五金】,【Paint 油漆】,,k. OTHER ARCHITECTURAL TERMS 其它建筑术语,,【Discipline 专业】,【Conventional Terms一般通用名词】,【Architectural Physics 建筑物理】,【Name Of Professional role职务名称】,【Drafting 制图】,,2. STRUCTURE 结构专业,,a. LOAD 荷载,,b. GROUND BASE AND FOUNDA TION 地基及基础,,c. REINFORCEMENT CONCRETE STRUCTURE 钢筋混凝土结构,,d. STEEL STRUCTURE 钢结构,,,e. DESIGN FOR ANTISEISMIC抗震设计,,f. GENERAL WORDS FOR DESIGN设计常用词汇,,g. GENERAL WORDS FOR CONSTRUCTION 施工常用词汇,,1. ARCHITECTURE 建筑专业,,a. DESIGN BASIS 设计依据,计划建议书planning proposals,设计任务书design order,标准规范standards and codes,条件图information drawing,设计基础资料basic data for design ,工艺流程图process flowchart,工程地质资料engineering geological data,原始资料original data,设计进度schedule of design,,b. STAGE OF DESIGN 设计阶段,方案scheme, draft,草图sketch,会谈纪要summary of discussion,谈判negotiation,可行性研究feasibility study,初步设计preliminary design,基础设计basic design,详细设计detail design,询价图enquiry drawing,施工图working drawing, construction drawing,竣工图as built drawing,,c. CLIMA TE CONDITION气象条件,日照sunshine,风玫瑰wind rose,主导风向prevailing wind direction ,最大(平均)风速maximum (mean) wind velocity,风荷载wind load,最大(平均)降雨量maximum (mean) rainfall,雷击及闪电thunder and lightning ,飓风hurricane,台风typhoon,旋风cyclone,降雨强度rainfall intensity,年降雨量annual rainfall,湿球温度wet bulb temperature,干球温度dry bulb temperature ,冰冻期frost period,冰冻线frost line冰冻区frost zone ,,室外计算温度calculating outdoor temperature,采暖地区region with heating provision,不采暖地区region without heating provision,绝对大气压absolute atmospheric pressure,相对湿度relative humidity,d. GENERAL ROOM NAME常用房间名称,办公室office,服务用房service room,换班室shift room,休息室rest room (break room),起居室living room,浴室bathroom,淋浴间shower,更衣室locker room,厕所lavatory,门厅lobby,诊室clinic,工作间workshop,电气开关室switchroom,走廊corridor,档案室archive,电梯机房lift motor room,车库garage,清洁间cleaning room,会议室(正式) conference room,会议室meeting room,衣柜间ward robe,暖风间H.V.A.C room,饭店restaurant,餐厅canteen, dining room,厨房kitchen,入口entrance,接待处reception area,会计室accountant room,秘书室secretary room,电气室electrical room,控制室control room,工长室foreman office,开关柜室switch gear,前室antecabinet (Ante.),生产区production area,马达控制中心Mcc,多功能用房utility room,化验室laboratory room,经理室manager room,披屋(阁楼) penthouse,警卫室guard house,e. ROOFING AND CEILING屋面及天棚,,女儿墙parapet,雨蓬canopy,屋脊roof ridge,坡度slope,坡跨比pitch,分水线water-shed,二毡三油2 layers of felt &3 coats of bitumastic ,附加油毡一层extra ply of felt,檐口eave,挑檐overhanging eave,檐沟eave gutter,平屋面flat roof,坡屋面pitched roof,雨水管downspout, rain water pipe)(R.W.P) ,汇水面积catchment area,泛水flashing,内排水interior drainage,外排水exterior drainage,滴水drip,屋面排水roof drainage,找平层leveling course,卷材屋面built-up roofing ,天棚ceiling,檩条purlin,屋面板roofing board,天花板ceiling board,防水层water-proof course,检查孔inspection hole,人孔manhole,吊顶suspended ceiling, false ceiling ,檐板(窗帘盒) cornice,,f. W ALL (CLADDING)墙体(外墙板),,砖墙brick wall,砌块墙block wall,清水砖墙brick wall without plastering ,抹灰墙rendered wall,石膏板墙gypsum board, plaster board ,空心砖墙hollow brick wall,承重墙bearing wall,非承重墙non-bearing wall,纵墙longitudinal wall,横墙transverse wall,外墙external (exterior) wall,内墙internal (interior) wall,填充墙filler wall,防火墙fire wall,窗间墙wall between window,空心墙cavity wall,压顶coping,圈梁gird, girt, girth,玻璃隔断glazed wall,防潮层damp-proof course (D.P.C),遮阳板sunshade,阳台balcony,伸缩缝expansion joint,沉降缝settlement joint,抗震缝seismic joint,复合夹心板sandwich board,压型单板corrugated single steel plate ,外墙板cladding panel,复合板composite panel,轻质隔断light-weight partition,牛腿bracket,砖烟囱brick chimney,勒脚(基座) plinth,,g. FLOOR AND TRENCH,地面及地沟,,地坪grade,地面和楼面ground and floor,素土夯实rammed earth,炉渣夯实tamped cinder,填土filled earth,回填土夯实tamped backfill,垫层bedding course, blinding,面层covering, finish,结合层bonding (binding) course,找平层leveling course,素水泥浆结合层neat cement binding course,混凝土地面concrete floor,水泥地面cement floor,机器磨平混凝土地面machine trowelled concrete floor,水磨石地面terrazzo flooring,马赛克地面mosaic flooring,瓷砖地面ceramic tile flooring,油地毡地面linoleum flooring,预制水磨石地面precast terrazzo flooring ,硬木花地面hard-wood parquet flooring ,搁栅joist,硬木毛地面hard-wood rough flooring,企口板地面tongued and grooved flooring ,防酸地面acid-resistant floor,钢筋混凝土楼板reinforced concrete slab (R.C Slab),乙烯基地面vinyl flooring,水磨石嵌条divider strip for terrazzo,地面做2%坡floor with 2% slope,集水沟gully,集水口gulley,排水沟drainage trench ,沟盖板trench cover,活动盖板removable cover plate,集水坑sump pit,孔翻边hole up stand,电缆沟cable trench,h. DOORS,GLASS,WINDOWS & IRONMONGERY(HARDWARE)门、玻璃、窗及五金件,木(钢)门wooden (steel) door,镶板门panelled door,夹板门plywood door,铝合金门aluminum alloy door,卷帘门roller shutter door,弹簧门swing door,推拉门sliding door,平开门side-hung door,折叠门folding door,旋转门revolving door,玻璃门glazed door,密闭门air-Tight door,保温门thermal insulating door,镀锌铁丝网门galvanized steel wire mesh door,防火门fire door,(大门上的)小门wicket,门框door frame,门扇door leaf,门洞door opening,结构开洞structural opening,单扇门single door,双扇门double door,疏散门emergency door,纱门screen door,门槛door sill,门过梁door lintel,上冒头top rail,下冒头bottom rail,门边木stile,门樘侧料side jumb,槽口notch,木窗wooden window,钢窗steel window,铝合金窗aluminum alloy window,百叶窗(通风为主) sun-bind, louver (louver, shutter, blind),塑钢窗plastic steel window,空腹钢窗hollow steel window,固定窗fixed window,平开窗side-hung window,推拉窗sliding window,气窗transom,上悬窗top-hung window,中悬窗center-pivoted window,下悬窗hopper window,活动百叶窗adjustable louver,天窗skylight,老虎窗dormer window,密封双层玻璃sealed double glazing,钢筋混凝土过梁reinforced concrete lintel ,钢筋砖过梁reinforced brick lintel,窗扇casement sash,窗台window sill,窗台板window board,窗中梃mullion,窗横木mutin,窗边木stile,压缝条cover mould,窗帘盒curtain box,合页(铰链) hinge (butts),转轴pivot,长脚铰链parliament hinge,闭门器door closer,地弹簧floor closer,插销bolt,门锁door lock,拉手pull,链条chain,门钩door hanger,碰球ball latch,窗钩window catch,暗插销insert bolt,电动开关器electric opener,平板玻璃plate glass ,夹丝玻璃wire glass,透明玻璃clear glass,毛玻璃(磨砂玻璃) ground glass (frosted glass),防弹玻璃bullet-proof glass,石英玻璃quartz glass,吸热玻璃heat absorbing glass,磨光玻璃polished glass,着色玻璃pigmented glass,玻璃瓦glass tile,玻璃砖glass block,有机玻璃organic glass,,I. STAIRCASE, LANDING & LIFT (ELEV A TOR)楼梯、休息平台及电梯,楼梯stair,楼梯间staircase,疏散梯emergency stair,旋转梯spiral stair (circular stair),吊车梯crane ladder,直爬梯vertical ladder,踏步step,扇形踏步winder (wheel step),踏步板tread,档步板riser,踏步宽度tread width,防滑条non-slip insert (strips),栏杆railing (balustrade),平台栏杆platform railing,吊装孔栏杆railing around mounting hole,扶手handrail,梯段高度height of flight,防护梯笼protecting cage (safety cage),平台landing (platform),操作平台operating platform,装卸平台platform for loading & unloading ,楼梯平台stair landing,客梯passenger lift,货梯goods lift,客/货两用梯goods/passenger lift,液压电梯hydraulic lift,自动扶梯escalator,观光电梯observation elevator,电梯机房lift mortar room,电梯坑lift pit,电梯井道lift shaft,,j. BUILDING MA TERIAL WORDS AND PHRASES建筑材料词汇及短语,,• Bricks and Tiles 砖和瓦,红砖red brick,粘土砖clay brick,瓷砖glazed brick (ceramic tile),防火砖fire brick,空心砖hollow brick,面砖facing brick,地板砖flooring tile,缸砖clinkery brick,马赛克mosaic,陶粒混凝土ceramsite concrete,琉璃瓦glazed tile,脊瓦ridge tile,石棉瓦asbestos tile (shingle),波形石棉水泥瓦corrugated asbestos cement sheet,,• Lime, Sand and Stone 灰、砂和石,石膏gypsum,大理石marble,汉白玉white marble,花岗岩granite,碎石crushed stone,毛石rubble,蛭石vermiculite,珍珠岩pearlite,水磨石terrazzo,卵石cobble,砾石gravel,粗砂course sand,中砂medium sand ,细砂fine sand,• Cement, Mortar and Concrete水泥、砂浆和混凝土,波特兰水泥(普通硅酸盐水泥)Portland cement,硅酸盐水泥silicate cement,火山灰水泥pozzolana cement,白水泥white cement,水泥砂浆cement mortar,石灰砂浆lime mortar,水泥石灰砂浆(混合砂浆) cement-lime mortar,保温砂浆thermal mortar,防水砂浆water-proof mortar,耐酸砂浆acid-resistant mortar,耐碱砂浆alkaline-resistant mortar,沥青砂浆bituminous mortar,纸筋灰paper strip mixed lime mortar,麻刀灰hemp cut lime mortar,灰缝mortar joint,素混凝土plain concrete,钢筋混凝土reinforced concrete,轻质混凝土lightweight concrete,细石混凝土fine aggregate concrete,沥青混凝土asphalt concrete,泡沫混凝土foamed concrete,炉渣混凝土cinder concrete,,Facing And Plastering Materials 饰面及粉刷材料,水刷石granitic plaster,斩假石artificial stone,刷浆lime wash,可赛银casein,大白浆white wash,麻刀灰打底hemp cuts and lime as base,喷大白浆两道sprayed twice with white wash,分格抹水泥砂浆cement mortar plaster sectioned,板条抹灰lath and plaster,,• Asphalt(Bitumen) and Asbestos 沥青和石棉,沥青卷材asphalt felt,沥青填料asphalt filler,沥青胶泥asphalt grout,冷底子油adhesive bitumen primer,沥青玛啼脂asphaltic mastic,沥青麻丝bitumastic oakum,石棉板asbestos sheet,石棉纤维asbestos fiber,,• Timber 木材裂缝crack透裂split环裂shake干缩shrinkage翘曲warping原木log圆木round timber方木square timber板材plank木条batten板条lath木板board红松red pine白松white pine落叶松deciduous pine云杉spruce柏木cypress白杨white poplar桦木birch冷杉fir栎木oak榴木willow榆木elm杉木cedar柚木teak 樟木camphor wood防腐处理的木材preservative-treated lumber 胶合板plywood三(五)合板3(5)-plywood企口板tongued and grooved board层夹板laminated plank胶合层夹木材glue-laminated lumber纤维板fiber-board竹子bamboo,• Metallic Materials 金属材料,黑色金属ferrous metal,圆钢steelbBar,方钢square steel,扁钢steel atrap,型钢steel section (shape),槽钢channel,角钢angle steel,等边角钢equal-leg angle,不等边角钢unequal-leg angle,工字钢I-beam,宽翼缘工字钢wide flange I-beam,丁( 之)字钢T-bar (Z-bar),冷弯薄壁型钢light gauge cold-formed steel shape,热轧hot-rolled,冷轧cold-rolled,冷拉cold-drawn,冷压cold-pressed,合金钢alloy steel,钛合金titanium alloy,不锈钢stainless steel,竹节钢筋corrugated steel bar,变形钢筋deformed bar,光圆钢筋plain round bar,钢板steel plate,薄钢板thin steel plate,低碳钢low carbon steel,冷弯cold bending,钢管steel pipe (tube),无缝钢管seamless steel pipe,焊接钢管welded steel pipe,黑铁管iron pipe,镀锌钢管galvanized steel pipe,铸铁cast iron,生铁pig iron,熟铁wrought iron,镀锌铁皮galvanized steel sheet,镀锌铁丝galvanized steel wire,钢丝网steel wire mesh,多孔金属网expanded metal,锰钢managanese steel,高强度合金钢high strength alloy steel,• Non-Ferrous Metal 有色金属,金gold,白金platinum,铜copper,黄铜brass,青铜bronze,银silver,铝aluminum,铅lead,,• Anti-Corrosion Materials 防腐蚀材料,聚乙烯polythene, polyethylene,尼龙nylon,聚氯乙烯PVC (polyvinyl chloride),聚碳酸酯polycarbonate,聚苯乙烯polystyrene,丙烯酸树酯acrylic resin,乙烯基酯vinyl ester,橡胶内衬rubber lining,氯丁橡胶neoprene,沥青漆bitumen paint,环氧树脂漆epoxy resin paint,氧化锌底漆zinc oxide primer,防锈漆anti-rust paint,耐酸漆acid-resistant paint,耐碱漆alkali-resistant paint,水玻璃sodium silicate ,树脂砂浆resin-bonded mortar,环氧树脂epoxy resin,,• Building Hardware 建筑五金,钉子nails,螺纹屋面钉spiral-threaded roofing nail,环纹石膏板钉annular-ring gypsum board nail,螺丝screws,平头螺丝flat-head screw,螺栓bolt,普通螺栓commercial bolt,高强螺栓high strength bolt,预埋螺栓insert bolt,胀锚螺栓cinch bolt,垫片washer,,• Paint 油漆,底漆primer,防锈底漆rust-inhibitive primer,防腐漆anti-corrosion paint,调和漆mixed paint,无光漆flat paint,透明漆varnish,银粉漆aluminum paint,磁漆enamel paint,干性油drying oil,稀释剂thinner,焦油tar,沥青漆asphalt paint,桐油tung oil, Chinese wood oil,红丹red lead,铅油lead oil,腻子putty,,k. OTHER ARCHITECTURAL TERMS 其它建筑术语,,• Discipline 专业,建筑architecture,土木civil,给排水water supply and drainage,总图plot plan,采暖通风H.V.A.C (heating、ventilation and air conditioning),电力供应electric power supply,电气照明electric lighting,电讯telecommunication,仪表instrument,热力供应heat power supply,动力mechanical power,工艺process technology,管道piping,,• Conventional Terms 一般通用名词,建筑原理architectonics,建筑形式architectural style,民用建筑civil architecture,城市建筑urban architecture,农村建筑rural architecture,农业建筑farm building,工业建筑industrial building,重工业的heavy industrial,轻工业的light industrial,古代建筑ancient architecture,现代建筑modern architecture,标准化建筑standardized buildings,附属建筑auxiliary buildings,城市规划city planning,厂区内within site,厂区外offsite,封闭式closed type,开敞式open type,半开敞式semi-open type,模数制modular system,单位造价unit cost,概算preliminary estimate,承包商constructor, contractor,现场site,扩建extension,改建reconstruction ,防火fire-prevention,防震aseismatic, quake-proof,防腐anti-corrosion,防潮dump-proof,防水water-proof,防尘dust-proof,防锈rust-proof,车流量traffic volume,货流量freight traffic volume,人流量pedestrian volume,透视图perspective drawing,建筑模型building model,,• Architectural Physics 建筑物理,照明illumination,照度degree of illumination,亮度brightness,日照sunshine,天然采光natural lighting,光强light intensity,侧光side light,顶光top light,眩光glaze,方位角azimuth,辐射radiation,对流convection,传导conduction,遮阳sun-shade,保温thermal insulation,恒温constant temperature,恒湿constant humidity,噪音noise,隔音sound-proof,吸音sound absorption,露点dew point,隔汽vapor-proof,,Name Of Professional role 职务名称,项目经理project manager (PM),设计经理design manager,首席建筑师principal architect,总工程师chief engineer,土木工程师civil engineer,工艺工程师process engineer,电气工程师electrical engineer,机械工程师mechanical engineer,计划工程师planning engineer,助理工程师assistant engineer,实习生probationer,专家specialist, expert,制图员draftsman,技术员technician,• Drafting 制图,总说明general specification,工程说明project specification,采用标准规范目录list of standards and specification adopted,图纸目录list of drawings,平面图plan,局部放大图detail with enlarged scale ,...平面示意图schematic plan of... ,...平剖面图sectional plan of...,留孔平面图plan of provision of holes,剖面section,纵剖面longitudinal section,横剖面cross (transverse) section,立面elevation,正立面front elevation,透视图perspective drawing,侧立面side elevation,背立面back elevation,详图detail drawings,典型节点typical detail,节点号detail No.,首页front page,图纸目录及说明list of contents and description,图例legend,示意图diagram,草图sketch ,荷载简图load diagram,流程示意图flow diagram,标准图standard drawing,...布置图layout of ...,地形图topographical map,土方工程图earth-work drawing,展开图developed drawing,模板图formwork drawing,配筋arrangement of reinforcement,表格tables,工程进度表working schedule,技术经济指标technical and economical index,建、构筑物一览表list of buildings and structures,编号coding,序列号serial No.,行和栏rows and columns,备注remarks,等级grade,直线straight Line,曲线curves,曲折线zigzag line,虚线dotted line,实线solid line,影线hatching line,点划线dot and dash line,轴线axis,等高线contour Line,中心线center Line,双曲线hyperbola,抛物线parabola,切线tangent Line,尺寸线dimension Line,园形round,环形annular,方形square,矩形rectangle,平行四边形parallelogram,三角形triangle,五角形pentagon,六角形hexagon,八角形octagon,梯形trapezoid,圆圈circle,弓形sagment,扇形sector,球形的spherical,抛物面paraboloid,圆锥形cone,椭圆形ellipse, oblong,面积area,体积volume,容量capacity,重量weight,质量mass,力force,米meter,厘米centimeter,毫米millimeter,公顷hectate,牛顿/平方米Newton/square meter ,千克/立方米kilogram/cubic meter ,英尺foot,英寸inch,磅pound,吨ton,加仑gallon,千磅kip,平均尺寸average dimension,变尺寸variable dimension,外形尺寸overall dimension,展开尺寸developed dimension,内径inside diameter,外径outside diameter,净重net weight,毛重gross weight,数量quantity,百分比percentage,净空clearance,净高headroom,净距clear distance,净跨clear span,截面尺寸sectional dimension,开间bay,进深depth,单跨single span,双跨double span ,多跨multi-span,标高elevation, level,绝对标高absolute elevation,设计标高designed elevation,室外地面标高ground elevation,室内地面标高floor elevation,柱网column grid,坐标coordinate,厂区占地site area,使用面积usable area,辅助面积service area,通道面积passage area,管架pipe rack,管廊pipeline gallery,架空管线overhead pipeline,排水沟drain ditch,集水坑sump pit,喷泉fountain,地漏floor drain,消火栓fire hydrant,灭火器fire extinguisher,二氧化碳灭火器carbon dioxide extinguisher ,卤代烷灭火器halon extinguisher,,不知道有没有人用得着这个,还有好多下次再发,好讨厌的30秒和四千字,作者:sea526 回复日期:2005-12-15 20:43:00 ,俩字:恐怖,2. STRUCTURE 结构专业,a. Load 荷载,,拔力pulling force,标准值standard value,残余应力residual stress,冲击荷载impact load, punch load,残余变形residual deflection,承压bearing,承载能力bearing capacity,承重bearing, load bearing,承重结构bearing structure,脆性材料brittle material,脆性破坏brittle failure,抵抗力resisting power, resistance,吊车荷载crane load,分布荷载distributed load,风荷载wind load,风速wind velocity, wind speed,风压wind pressure,风振wind vibration,浮力buoyance, floatage,符号symbol, mark,负弯矩negative moment, hogging moment ,附加荷载additional load,附加应力additional stress,副作用side effect, by-effect,刚度rigidity,刚度比ratio of rigidity,刚度系数rigidity factor,刚接rigid connection,刚性节点rigid joint,恒载dead load,荷载传递transmission of load,固端弯矩fixed-end moment,活荷载live load,积灰荷载dust load,集中荷载concentrated load,加载, 加荷loading,剪力shear, shearing force,剪切破坏shear failure,剪应变shear strain,剪应力shear stress,简支simple support,静定结构statically determinate structure ,截面模量modulus of section,section modulus ,静力static force,静力分析static analysis,局部压力local pressure, partial pressure ,局部压屈local bulkling,绝对值absolute value,均布荷载uniformly distributed load,抗拔力pulling resistance,抗剪刚度shear rigidity,抗剪强度shear strength, shearing strength ,抗拉强度tensile strength,抗扭torsion resistance,抗扭刚度torsional rigidity,抗弯bending resistance,抗弯刚度bending rigidity,抗压强度compressive strength, compression strength,可靠性reliability,可靠性设计reliability design,拉力tensile force,拉应力tensile stress, tension stress,拉应变tensile strain, tension strain,临界点critical point,临界荷载critical load,临界应力critical stress,密度density,离心力centrifugal force,摩擦力friction force,摩擦系数frictional factor,挠度deflection,内力internal force, inner force,扭矩moment of torsion, torsional moment ,疲劳强度fatigue strength,偏心荷载eccentric load, non-central load ,偏心距eccentric distance, eccentricity,偏心受拉eccentric tension,偏心受压eccentric compression,屈服强度yield strength,使用荷载working load,水平力horizontal force,水平推力horizontal thrust,弹塑性变形elastoplastic deformation,弹性elasticity, resilience, spring,塑限plastic limit,弹性变形elastic deformation,塑性变形plastic deformation,弹性模量modulus of elastic,elastic modulus,体积volume, bulk, cubature, cubage,土压力earth pressure, soil pressure,弯矩bending moment, moment,弯曲半径radius at bent, radius of curve,位移displacement,温度应力temperature stress,温度作用temperature action,系数coefficient, factor,雪荷载snow load,压应变compression strain,压应力compression stress,应力集中concentration of stress,预应力prestressing force, prestress,振动荷载vibrating load, racking load,支座反力support reaction,自重own weight,作用action, effect,作用点point of application,application joint,b. Ground Base and Foundation地基及基础,,板桩sheet pile, sheeting pile,板桩基础sheet pile foundation,饱和粘土saturation clay,冰冻线frost line, freezing level,不均匀沉降unequal settlement, differential settlement,残积土residual soil,沉积物deposit, sediment,沉降settlement,沉降差difference in settlement,沉降缝settlement joint,沉井sinking well, sunk well,沉箱caisson,持力层bearing stratum,冲积alluviation,锤夯hammer tamping ,档土墙retaining wall, breast wall,底板base slab, base plate, bed plate,地板floor board,地基ground base, ground,地基承载力ground bearing capacity,地基处理ground treatment, soil treatment ,地基稳定base stabilization,地梁ground beam, ground sill,地漏floor drain,地下工程substructure work, understructure work,地下室basement, cellar,地下水ground water,地下水位groundwater level, water table ,地下水压力ground water pressure,地质报告geologic report,垫层bedding, blinding,独立基础isolated foundation, individual foundation ,端承桩end-bearing pile,筏式基础raft foundation,粉砂silt, rock flour,粉质粘土silty clay,粉质土silty soil,扶壁式档土墙buttressed retaining wall ,腐蚀corrosion,覆土earth covering,刚性基础rigid foundation,沟盖板trench cover,固结consolidation,灌注桩cast-in-place pile, cast in site pile ,护坡slope protection, revetment,护桩guard pile,环墙ring wall,灰土lime earth,回填backfill, backfilling,回填土backfill, backfill soil,混凝土找平层concrete screed,火山灰水泥trass cement,基槽foundation trench,基础foundation, base,基础底板foundation slab,基础埋深embedded depth of foundation ,基础平面图foundation plan,地基勘探site exploration, site investigation ,基坑foundation pit,集水坑collecting sump,阶形基础stepped foundation,结合层binding course, bonding course,井点well point,井点排水well point unwatering,开挖excavation, cutting,勘测exploration and survey,勘测资料exploration data,沥青bitumen, asphalt, pitch,联合基础combined foundation,卵石cobble, pebble,埋置embedment,毛石基础rubble foundation,锚筋anchor bar,锚桩anchor pile,密实度compactness, density, denseness,摩擦桩friction pile, floating pile,粘土clay,粘质粉土clay silt,碾压roller compaction, rolling,排水drainage, dewatering,排水沟drainage ditch,排水孔weep hole, drain hole,排水设备dewatering equipment,普通硅酸盐水泥ordinary Portland cement ,群桩grouped piles,容许沉降permissible settlement,容许承载力allowable bearing,软土soft soil,砂垫层sand bedding course, sand cushion ,砂土sandy soil, sands,砂质粉土sandy silt,设备基础equipment foundation,水泥搅拌桩cement injection,素土夯实rammed earth, packed soil,碎石桩stone columns,弹性地基elastic foundation,弹性地基梁beam on elastic foundation,填方fill, filling ,填土earth-fill, earth filling, filling,条形基础strip foundation,土方工程earthwork,挖方excavation work, excavation,箱形基础box foundation,压实compaction, compacting,压实系数compacting factor,验槽check of foundation subsoil,预制混凝土桩precast concrete pile,中砂medium sand,重力式档土墙gravity retaining wall,桩承台pile cap,钻孔桩bored pile,钻探exploration drilling, drilling,,最终沉降final settlement,,c.Reinforcement Concrete Structure 钢筋混凝土结构,板缝slab joint,板厚thickness of slab,板式楼梯cranked slab stairs,板跨度span of slab,薄壁结构thin-walled structure,薄腹梁thin wedded girder,保护层protective coating,臂式吊车boom crane, boom hoist,边梁edge beam, boundary beam,变截面variable cross-section,变形缝movement joint,变形钢筋deformed bar,初凝initial setting, pre-setting,次梁secondary beam,大型屋面板precast ribbed roof slab,单层厂房one-storied factory,单筋梁beam with single reinforcement,单跨single span,单向板one-way slab,垫块cushion block,垫梁template beam,吊车梁crane beam, crane girder,顶棚抹灰ceiling plastering。
Thermal comfort in the future - Excellence and expectationP. Ole Fanger and Jørn ToftumInternational Centre for Indoor Environment and EnergyTechnical University of DenmarkAbstractThis paper predicts some trends foreseen in the new century as regards the indoor environment and thermal comfort. One trend discussed is the search for excellence, upgrading present standards that aim merely at an “acceptable” condition with a substantial number of dissatisfied. An important element in this connection is individual thermal control. A second trend is to acknowledge that elevated air temperature and humidity have a strong negative impact on perceived air quality and ventilation requirements. Future thermal comfort and IAQ standards should include these relationships as a basis for design. The PMV model has been validated in the field in buildings with HVAC systems that were situated in cold, temperate and warm climates and were studied during both summer and winter. In non-air-conditioned buildings in warm climates occupants may sense the warmth as being less severe than the PMV predicts, due to low expectations. An extension of the PMV model that includes an expectancy factor is proposed for use in non-air-conditioned buildings in warm climates. The extended PMV model agrees well with field studies inon-air-conditioned buildings of three continents.Keywords: PMV, Thermal sensation, Individual control, Air quality, AdaptationA Search for ExcellencePresent thermal comfort standards (CEN ISO 7730, ASHRAE 55) acknowledge that there are considerable individual differences between people’s thermal sensation and their discomfort caused by local effects, i.e. by air movement. In a collective indoor climate, the standards prescribe a compromise that allows for a significant number of people feeling too warm or too cool. They also allow for air velocities that will be felt as a draught by a substantial percentage of the occupants.In the future this will in many cases be considered as insufficient. There will be a demand for systems that allow all persons in a space to feel comfortable. The obvious wayto achieve this is to move from the collective climate to the individually controlled local climate. In offices, individual thermal control of each workplace will be common. The system should allow for individual control of the general thermal sensation without causing any draught or other local discomfort. We know the range of operative temperatures required in a workplace to satisfy nearly everybody (Wyon 1996; Fanger 1970) and we know the sensitivity to draught from a wide range of studies. A search for excellence involves providing all persons in a space with the means to feel thermally comfortable without compromise.Thermal Comfort and IAQPresent standards treat thermal comfort and indoor air quality separately, indicating that they are independent of each other. Recent research documents that this is not true (Fang et al. 1999; Toftum et al. 1998). The air temperature and humidity combined in the enthalpy have a strong impact on perceived air quality, and perceived air quality determines the required ventilation in ventilation standards. Research has shown that dry and cool air is perceived as being fresh and pleasant while the same composition of air at an elevated temperature and humidity is perceived as stale and stuffy. During inhalation it is the convective and evaporative cooling of the mucous membrane in the nose that is essential for the fresh and pleasant sensation. Warm and humid air is perceived as being stale and stuffy due to the lack of nasal cooling. This may be interpreted as a local warm discomfort in the nasal cavity. The PMV model is the basis for existing thermal comfort standards. It is quite flexible and allows for the determination of a wide range of air temperatures and humidities that result in thermal neutrality for the body as a whole. But the inhaled air would be perceived as being very different within this wide range of air temperatures and humidities. An example: light clothing and an elevated air velocity or cooled ceiling, an air temperature of 28ºC and a relative humidity of 60% may givePMV=0, but the air quality would be perceived as stale and stuffy. A simultaneous request for high perceived air quality would require an air temperature of 20-22oC and a modest air humidity. Moderate air temperature and humidity decrease also SBS symptoms (Krogstad et al. 1991, Andersson et al. 1975) and the ventilation requirement, thus saving energy during the heating season. And even with air-conditioning it may be beneficial and save energy during the cooling season.PMV model and the adaptive modelThe PMV model is based on extensive American and European experiments involving over a thousand subjects exposed to well-controlled environments (Fanger 1970). The studies showed that the thermal sensation is closely related to the thermal load on the effector mechanisms of the human thermoregulatory system. The PMV model predicts the thermal sensation as a function of activity, clothing and the four classical thermal environmental parameters. The advantage of this is that it is a flexible tool that includes all the major variables influencing thermal sensation. It quantifies the absolute and relative impact of these six factors and can therefore be used in indoor environments with widely differing HVAC systems as well as for different activities and different clothing habits. The PMV model has been validated in climate chamber studies in Asia (de Dear et al. 1991; Tanabe et al. 1987) as well as in the field, most recently in ASHRAE’s worldwide research in buildings with HVAC systems that were situated in cold, temperate and warm climates and were studied during both summer and winter (Cena et al. 1998; Donini et al. 1996; de Dear et al. 1993a; Schiller et al. 1988). The PMV is developed for steady-state conditions but it has been shown to apply with good approximation at the relatively slow fluctuations of the environmental parameters typically occurring indoors. Immediately after an upward step-wise change of temperature, the PMV model predicts well the thermal sensation, while it takes around 20 min at temperature down-steps (de Dear et al. 1993b).Field studies in warm climates in buildings without air-conditioning have shown, however, that the PMV model predicts a warmer thermal sensation than the occupants actually feel (Brager and de Dear 1998). For such non-air-conditioned buildings an adaptive model has been proposed (de Dear and Brager 1998). This model is a regression equation that relates the neutral temperature indoors to the monthly average temperature outdoors. The only variable is thus the average outdoor temperature, which at its highest may have an indirect impact on the human heat balance. An obvious weakness of the adaptive model is that it does not include human clothing or activity or the four classical thermal parameters that have a well-known impact on the human heat balance and therefore on the thermal sensation. Although the adaptive model predicts the thermal sensation quite well for non-air-conditioned buildings of the 1900’s located in warm parts of the world, the question remains as to how well it would suit buildings of new types in the future where the occupants have a different clothing behaviour and a different activity pattern.Why then does the PMV model seem to overestimate the sensation of warmth in nonair-conditioned buildings in warm climates? There is general agreement thatphysiological acclimatization does not play a role. One suggested explanation is that openable windows in naturally ventilated buildings should provide a higher level of personal control than in air-conditioned buildings. We do not believe that this is true in warm climates. Although an openable window sometimes may provide some control of air temperature and air movement, this applies only to the persons who work close to a window. What happens to persons in the office who work far away from the window? And in warm climates, the normal strategy in naturally ventilated buildings is to cool the building during the night and then close the windows some time during the morning when the outdoor temperature exceeds the indoor temperature. Another obstacle is of course traffic noise, which makes open windows in many areas impossible. We believe that in warm climates air-conditioning with proper thermostatic control in each space provides a better perceived control than openable windows.Another factor suggested as an explanation to the difference is the expectations of the occupants. We think this is the right factor to explain why the PMV overestimates the thermal sensation of occupants in non-air-conditioned buildings in warm climates. These occupants are typically people who have been living in warm environments indoors and outdoors, maybe even through generations. They may believe that it is their “destiny” to live in environments where they feel warmer than neutral. If given a chance they may not on average prefer an environment that is different from that chosen by people who are used to air-conditioned buildings. But it is likely that they would judge a given warm environment as less severe and less unacceptable than would people who are used toair-conditioning. This may be expressed by an expectancy factor, e, to be multiplied with PMV to reach the mean thermal sensation vote of the occupants of the actualnon-air-conditioned building in a warm climate. The factor e may vary between 1 and 0.5. It is 1 for air-conditioned buildings. For non-air-conditioned buildings, the expectancy factor is assumed to depend on the duration of the warm weather over the year and whether such buildings can be compared with many others in the region that are air-conditioned. If the weather is warm all year or most of the year and there are no or few otherair-conditioned buildings, e may be 0.5, while it may be 0.7 if there are many other buildings with air-conditioning. For non-air-conditioned buildings in regions where the weather is warm only during the summer and no or few buildings have air-conditioning, the expectancy factor may be 0.7 to 0.8, while it may be 0.8 to 0.9 where there are many air-conditioned buildings. In regions with only brief periods of warm weather during the summer, the expectancy factor may be 0.9 to 1. Table 1 proposes a first rough estimationof ranges for the expectancy factor corresponding to high, moderate and low degrees of expectation.A second factor that contributes erroneously to the difference between the PMV and actual thermal sensation votes in non-air-conditioned buildings is the estimated activity. In many field studies in offices, the metabolic rate is estimated on the basis of a questionnaire identifying the percentage of time the person was sedentary, standing, or walking. This mechanistic approach does not acknowledge the fact that people, when feeling warm, unconsciously tend to slow down their activity. They adapt to the warm environment by decreasing their metabolic rate. The lower pace in warm environments should be acknowledged by inserting a reduced metabolic rate when calculating the PMV.To examine these hypotheses further, data were downloaded from the database of thermal comfort field experiments (de Dear 1998). Only quality class II data obtained in non-air-conditioned buildings during the summer period in warm climates were used in the analysis. Data from four cities (Bangkok, Brisbane, Athens, and Singapore) were included, representing a total of more than 3200 sets of observations (Busch 1992, de Dear 1985, Baker 1995, de Dear et al. 1991). The data from these four cities with warm climates were also used for the development of the adaptive model (de Dear and Brager 1998).For each set of observations, recorded metabolic rates were reduced by 6.7% for every scale unit of PMV above neutral, i.e. a PMV of 1.5 corresponded to a reduction in the metabolic rate of 10%. Next, the PMV was recalculated with reduced metabolic rates using ASHRAE’s thermal comfort tool (Fountain and Huizenga 1997). The resulting PMV values were then adjusted for expectation by multiplication with expectancy factors estimated to be 0.9 for Brisbane, 0.7 for Athens and Singapore and 0.6 for Bangkok. As an average for each building included in the field studies, Figure 1 and Table 2 compare the observed thermal sensation with predictions using the new extended PMV model for warm climates.Figure 1. Thermal sensation in non-air-conditioned buildings in warm climates.Comparison of observed mean thermal sensation with predictions made using the new extension of the PMV model for non-air-conditioned buildings in warm climates. The linesare based on linear regression analysis weighted according to the number of responsesTable 2. Non-air-conditioned buildings in warm climates.Comparison of observed thermal sensation votes and predictions made using the newextension of the PMV model.The new extension of the PMV model for non-air-conditioned buildings in warmclimates predicts the actual votes well. The extension combines the best of the PMV andthe adaptive model. It acknowledges the importance of expectations already accounted forby the adaptive model, while maintaining the PMV model’s classical thermal parametersthat have direct impact on the human heat balance. It should also be noted that the newPMV extension predicts a higher upper temperature limit when the expectancy factor islow. People with low expectations are ready to accept a warmer indoor environment. Thisagrees well with the observations behind the adaptive model.Further analysis would be useful to refine the extension of the PMV model, and additional studies in non-air-conditioned buildings in warm climates in different parts of the world would be useful to further clarify expectation and acceptability among occupants. It would also be useful to study the impact of warm office environments on work pace and metabolic rate.ConclusionsThe PMV model has been validated in the field in buildings with HVAC systems, situated in cold, temperate and warm climates and studied during both summer and winter. In non-air-conditioned buildings in warm climates, occupants may perceive the warmth as being less severe than the PMV predicts, due to low expectations.An extension of the PMV model that includes an expectancy factor is proposed for use in non-air-conditioned buildings in warm climates.The extended PMV model agrees well with field studies in non-air-conditioned buildings in warm climates of three continents.A future search for excellence will demand that all persons in a space be thermally comfortable. This requires individual thermal control.Thermal comfort and air quality in a building should be considered simultaneously. A high perceived air quality requires moderate air temperature and humidity. AcknowledgementFinancial support for this study from the Danish Technical research Council is gratefully acknowledged.ReferencesAndersson, L.O., Frisk, P., Löfstedt, B., Wyon, D.P., (1975), Human responses to dry, humidified and intermittently humidified air in large office buildings. Swedish Building Research Document Series, D11/75.ASHRAE 55-1992: Thermal environmental conditions for human occupancy. American Society of Heating, Refrigerating and Air-conditioning Engineers, Inc.Baker, N. and Standeven, M. (1995), A Behavioural Approach to Thermal Comfort Assessment in Naturally Ventilated Buildings. Proceedings from CIBSE National Conference, pp 76-84.Brager G.S., de Dear R.J. (1998), Thermal adaptation in the built environment: a literature review. Energy and Buildings, 27, pp 83-96.Busch J.F. (1992), A tale of two populations: thermal comfort in air-conditioned and naturally ventilated offices in Thailand. Energy and Buildings, vol. 18, pp 235-249.CEN ISO 7730-1994: Moderate thermal environments - Determination of the PMV and PPD indices and specification of the conditions for thermal comfort. International Organization for Standardization, Geneva.Cena, K.M. (1998), Field study of occupant comfort and office thermal environments in a hot-arid climate. (Eds. Cena, K. and de Dear, R.). Final report, ASHRAE 921-RP, ASHRAE Inc., Atlanta.de Dear, R., Fountain, M., Popovic, S., Watkins, S., Brager, G., Arens, E., Benton, C., (1993a), A field study of occupant comfort and office thermal environments in a hot humid climate. Final report, ASHRAE 702 RP, ASHRAE Inc., Atlanta.de Dear, R., Ring, J.W., Fanger, P.O. (1993b), Thermal sensations resulting from sudden ambient temperature changes. Indoor Air, 3, pp 181-192.de Dear, R. J., Leow, K. G. and Foo, S.C. (1991), Thermal comfort in the humid tropics: Field experiments in air-conditioned and naturally ventilated buildings in Singapore. International Journal of Biometeorology, vol. 34, pp 259-265.de Dear, R.J. (1998), A global database of thermal comfort field experiments. ASHRAE Transactions, 104(1b), pp 1141-1152.de Dear, R.J. and Auliciems, A. (1985), Validation of the Predicted Mean Vote model of thermal comfort in six Australian field studies. ASHRAE Transactions, 91(2), pp 452- 468. de Dear, R.J., Brager G.S. (1998), Developing an adaptive model of thermal comfort and preference. ASHRAE Transactions, 104(1a), pp 145-167.de Dear, R.J., Leow, K.G., and Ameen, A. (1991), Thermal comfort in the humid tropics - Part I: Climate chamber experiments on temperature preferences in Singapore. ASHRAE Transactions 97(1), pp 874-879.Donini, G., Molina, J., Martello, C., Ho Ching Lai, D., Ho Lai, K., Yu Chang, C., La Flamme, M., Nguyen, V.H., Haghihat, F. (1996), Field study of occupant comfort and office thermal environments in a cold climate. Final report, ASHRAE 821 RP, ASHRAE Inc., Atlanta.Fang, L., Clausen, G., Fanger, P.O. (1999), Impact of temperature and humidity on chemical and sensory emissions from building materials. Indoor Air, 9, pp 193-201. Fanger, P.O. (1970), Thermal comfort. Danish Technical Press, Copenhagen, Denmark. Fouintain, M.E. and Huizenga, C. (1997), A thermal sensation prediction tool for use by the profession. ASHRAE Transactions, 103(2), pp 130-136.Humphreys, M.A. (1978), Outdoor temperatures and comfort indoors. Building Research and Practice, 6(2), pp 92-105.Krogstad, A.L., Swanbeck, G., Barregård, L., et al. (1991), Besvär vid kontorsarbete med olika temperaturer i arbetslokalen - en prospektiv undersökning (A prospective study of indoor climate problems at different temperatures in offices), Volvo Truck Corp., Göteborg, Sweden.Schiller, G.E., Arens, E., Bauman, F., Benton, C., Fountain, M., Doherty, T. (1988) A field study of thermal environments and comfort in office buildings. Final report, ASHRAE 462 RP, ASHRAE Inc., Atlanta.Tanabe, S., Kimura, K., Hara, T. (1987), Thermal comfort requirements during the summer season in Japan. ASHRAE Transactions, 93(1), pp 564-577.Toftum, J., Jørgensen, A.S., Fanger, P.O. (1998), Upper limits for air humidity for preventing warm respiratory discomfort. Energy and Buildings, 28(3), pp 15-23.Wyon, D.P. (1996) Individual microclimate control: required range, probable benefits and current feasibility. Proceedings of Indoor Air ’96, vol. 1, pp 1067-1072未来的热舒适性——优越性和期望值P. Ole Fanger 和Jørn Toftum国际中心室内环境与能源丹麦科技大学摘要本文预期一些可在新世纪所预见的关于热舒适的室内环境的趋势。