On measuring concentration in banking systems
- 格式:pdf
- 大小:357.74 KB
- 文档页数:9

![[美]R·格伦·哈伯德《宏观经济学》R.GlennHubbard,AnthonyP](https://img.taocdn.com/s1/m/c5cc42cdd05abe23482fb4daa58da0116c171f30.png)
Macroeconomics R. GLENN HUBBARD COLUMBIA UNIVERSITY ANTHONY PATRICK O’BRIEN LEHIGH UNIVERSITY MATTHEW RAFFERTY QUINNIPIAC UNIVERSITY Boston Columbus Indianapolis New York San Francisco Upper Saddle RiverAmsterdam Cape Town Dubai London Madrid Milan Munich Paris Montreal Toronto Delhi Mexico City So Paulo Sydney Hong Kong Seoul Singapore Taipei TokyoAbout the AuthorsGlenn Hubbard Professor Researcher and Policymaker R. Glenn Hubbard is the dean and Russell L. Carson Professor of Finance and Economics in the Graduate School of Business at Columbia University and professor of economics in Columbia’s Faculty of Arts and Sciences. He is also a research associate of the National Bureau of Economic Research and a director of Automatic Data Processing Black Rock Closed- End Funds KKR Financial Corporation and MetLife. Professor Hubbard received his Ph.D. in economics from Harvard University in 1983. From 2001 to 2003 he served as chairman of the White House Council of Economic Advisers and chairman of the OECD Economy Policy Commit- tee and from 1991 to 1993 he was deputy assistant secretary of the U.S. Treasury Department. He currently serves as co-chair of the nonpar-tisan Committee on Capital Markets Regulation and the Corporate Boards Study Group. ProfessorHubbard is the author of more than 100 articles in leading journals including American EconomicReview Brookings Papers on Economic Activity Journal of Finance Journal of Financial EconomicsJournal of Money Credit and Banking Journal of Political Economy Journal of Public EconomicsQuarterly Journal of Economics RAND Journal of Economics and Review of Economics and Statistics.Tony O’Brien Award-Winning Professor and Researcher Anthony Patrick O’Brien is a professor of economics at Lehigh University. He received a Ph.D. from the University of California Berkeley in 1987. He has taught principles of economics money and banking and interme- diate macroeconomics for more than 20 years in both large sections and small honors classes. He received the Lehigh University Award for Distin- guished Teaching. He was formerly the director of the Diamond Center for Economic Education and was named a Dana Foundation Faculty Fel- low and Lehigh Class of 1961 Professor of Economics. He has been a visit- ing professor at the University of California Santa Barbara and Carnegie Mellon University. Professor O’Brien’s research has dealt with such issues as the evolution of the U.S. automobile industry sources of U.S. economiccompetitiveness the development of U.S. trade policy the causes of the Great Depression and thecauses of black–white income differences. His research has been published in leading journals in-cluding American Economic Review Quarterly Journal of Economics Journal of Money Credit andBanking Industrial Relations Journal of Economic History Explorations in Economic History andJournal of PolicyHistory.Matthew Rafferty Professor and Researcher Matthew Christopher Rafferty is a professor of economics and department chairperson at Quinnipiac University. He has also been a visiting professor at Union College. He received a Ph.D. from the University of California Davis in 1997 and has taught intermediate macroeconomics for 15 years in both large and small sections. Professor Rafferty’s research has f ocused on university and firm-financed research and development activities. In particular he is interested in understanding how corporate governance and equity compensation influence firm research and development. His research has been published in leading journals including the Journal of Financial and Quantitative Analysis Journal of Corporate Finance Research Policy and the Southern Economic Journal. He has worked as a consultantfor theConnecticut Petroleum Council on issues before the Connecticut state legislature. He has alsowritten op-ed pieces that have appeared in several newspapers including the New York Times. iii Brief Contents Part 1: Introduction Chapter 1 The Long and Short of Macroeconomics 1 Chapter 2 Measuring the Macroeconomy 23 Chapter 3 The Financial System 59 Part 2: Macroeconomics in the Long Run: Economic Growth Chapter 4 Determining Aggregate Production 105 Chapter 5 Long-Run Economic Growth 143 Chapter 6 Money and Inflation 188 Chapter 7 The Labor Market 231 Part 3: Macroeconomics in the Short Run: Theory and Policy Chapter 8 Business Cycles 271 Chapter 9 IS–MP: A Short-Run Macroeconomic Model 302 Chapter 10 Monetary Policy in the Short Run 363 Chapter 11 Fiscal Policy in the Short Run 407 Chapter 12 Aggregate Demand Aggregate Supply and Monetary Policy 448 Part 4: Extensions Chapter 13 Fiscal Policy and the Government Budget in the Long Run 486 Chapter 14 Consumption and Investment 521 Chapter 15 The Balance of Payments Exchange Rates and Macroeconomic Policy 559 Glossary G-1 Index I-1ivContentsChapter 1 The Long and Short of Macroeconomics 1WHEN YOU ENTER THE JOB MARKET CAN MATTER A LOT ........................................................ 11.1 What Macroeconomics Is About........................................................................... 2 Macroeconomics in the Short Run and in the Long Run .................................................... 2 Long-Run Growth in the United States ............................................................................. 3 Some Countries Have Not Experienced Significant Long-Run Growth ............................... 4 Aging Populations Pose a Challenge to Governments Around the World .......................... 5 Unemployment in the United States ................................................................................. 6 How Unemployment Rates Differ Across Developed Countries ......................................... 7 Inflation Rates Fluctuate Over Time and Across Countries................................................. 7 Econo mic Policy Can Help Stabilize the Economy .. (8)International Factors Have Become Increasingly Important in Explaining Macroeconomic Events................................................................................. 91.2 How Economists Think About Macroeconomics ............................................. 11 What Is the Best Way to Analyze Macroeconomic Issues .............................................. 11 Macroeconomic Models.................................................................................................. 12Solved Problem 1.2: Do Rising Imports Lead to a Permanent Reductionin U.S. Employment. (12)Assumptions Endogenous Variables and Exogenous Variables in EconomicModels ........................................................................................................ 13 Forming and Testing Hypotheses in Economic Models .................................................... 14Making the Connection: What Do People Know About Macroeconomicsand How Do They KnowIt .............................................................................................. 151.3 Key Issues and Questions of Macroeconomics ............................................... 16An Inside Look: Will Consumer Spending Nudge Employers to Hire................................ 18Chapter Summary and Problems ............................................................................. 20 Key Terms and Concepts Review Questions Problems and Applications Data Exercise Theseend-of-chapter resource materials repeat in all chapters.Chapter 2 Measuring the Macroeconomy 23HOW DO WE KNOW WHEN WE ARE IN ARECESSION ........................................................... 23Key Issue andQuestion .................................................................................................... 232.1 GDP: Measuring Total Production and Total Income ..................................... 25 How theGovernment Calculates GDP (25)Production and Income (26)The Circular Flow of Income (27)An Example of Measuring GDP (29)National Income Identities and the Components of GDP (29)vvi CONTENTS Making the Connection: Will Public Employee Pensions Wreck State and Local Government Budgets.................................................................... 31 The Relationship Between GDP and GNP........................................................................ 33 2.2 Real GDP Nominal GDP and the GDP Deflator.............................................. 33 Solved Problem 2.2a: Calculating Real GDP . (34)Price Indexes and the GDP Deflator (35)Solved Problem 2.2b: Calculating the Inflation Rate ..........................................................36 The Chain-Weighted Measure of Real GDP ....................................................................37 Making the Connection: Trying to Hit a Moving Target: Forecasting with “Real-Time Data” .................................................................................. 37 Comparing GDP Across Countries................................................................................... 38 Making the Connection: The Incredible Shrinking Chinese Economy ................................ 39 GDP and National Income .............................................................................................. 40 2.3 Inflation Rates and Interest Rates ....................................................................... 41 The Consumer Price Index .............................................................................................. 42 Making the Connection: Does Indexing Preserve the Purchasing Power of Social Security Payments ................................................................ 43 How Accurate Is theCPI ............................................................................................... 44 The Way the Federal Reserve Measures Inflation ............................................................ 44 InterestRates .................................................................................................................. 45 2.4 Measuring Employment and Unemployment .. (47)Answering the Key Question ............................................................................................ 49 An Inside Look: Weak Construction Market Persists.......................................................... 50 Chapter 3 The Financial System 59 THE WONDERFUL WORLD OFCREDIT ................................................................................... 59 Key Issue and Question .................................................................................................... 59 3.1 Overview of the Financial System ...................................................................... 60 Financial Markets and Financial Intermediaries ................................................................ 61 Making the Connection: Is General Motors Making Cars or Making Loans .................... 62 Making the Connection: Investing in the Worldwide Stock Market . (64)Banking and Securitization (67)The Mortgage Market and the Subprime Lending Disaster (67)Asymmetric Information and Principal–Agent Problems in Financial Markets...................68 3.2 The Role of the Central Bank in the Financial System (69)Central Banks as Lenders of Last Resort ..........................................................................69 Bank Runs Contagion and Asset Deflation ....................................................................70 Making the Connection: Panics Then and Now: The Collapse of the Bank of United States in 1930 and the Collapse of Lehman Brothers in2008 (71)3.3 Determining Interest Rates: The Market for Loanable Funds and the Market forMoney .......................................................................................... 76 Saving and Supply in the Loanable Funds Market ........................................................... 76 Investment and the Demand for Loanable Funds ............................................................ 77 Explaining Movements in Saving Investment and the Real Interest Rate (78)CONTENTS .。
I.J.Mathematical Sciences and Computing,2016, 4, 1-11Published Online November 2016 in MECS ()DOI: 10.5815/ijmsc.2016.04.01Available online at /ijmscComparative Analysis of Customers’ Queue Management of First Bank Plc. and Guaranty Trust Bank Plc, Isokun Ilesa, Nigeria David O. Ikotun a, Justus A. Ademuyiwa b, Festus D. Famule a,b,*a Department of Mathematics and Statistics, Interlink Polytechnic, Ijebu Jesa, Nigeriab Department of Mathematics and Statistics, Federal Polytechnic, Ile-Oluji, Department of Mathematics andStatistics Osun State College of Technology, Esa-Oke, NigeriaAbstractProblem of queue management has been a great barrier to the financial institutions. Another way of measuring efficiency in banking industries is how fast the service of saving and withdraw is been rendered. Imagine customers that spend the whole day in the banking hall for one service or the other, due to poor service delivery and long stay on the queue will not hesitate to change his bank. Data was collected by direct observation in two banks, one old generation bank and one new generation bank, queue model and other statistical tools were used to analyze the data. Result of the analysis shows that Guaranty Trust Bank is more efficient than First Bank in that the later has a prolonged service time attributed to the preference of it by a pool of customers for many reasons.Index Terms: Queue theory, markovian birth process, channel, queue efficiency, probability, queue discipline, arrival rate.© 2016 Published by MECS Publisher. Selection and/or peer review under responsibility of the Research Association of Modern Education and Computer Science1.IntroductionQueuing theory which is a branch of operation research often used in making decision about resources needed to provide service. It has applications in wide varieties of situation that may be encountered in business, commerce, industries, healthcare, public services and engineering. In particular, queue theory is very useful in customer services situations as well as transportation and telecommunication. Application is also found in intelligent transportation system, business core center, network environment, server queuing mainframe, computer and traffic flow.Queuing is a volatile situation in establishment. A part form time wasted, it also leads to break down of law * Corresponding author – Rogushina Julia.E-mail address: ladamandraka2010@and order. Cases of loss of lives were reported at filling stations in the years of fuel shortage or scarcity in most part of the world especially in Nigeria.Queuing wherever it occurs has many negative consequences a part form leading to chaos for instance, Baking industries, wasting of man hours per cases have been witnessed where customers while waiting to cash money are attached by armed robbers. And many times the robbers are made away with huge amount of money from people on the queue in banking halls and even kill or injure some of them. Unhealthy people develop complications while waiting, this sometimes leads to death if proper medication is not provided.In recent times, in banking sector in Nigeria, many new generation banks were licensed with a view of reducing congestion often experienced in the old generation banks. Despite all these, there is queuing problem in some of these banks. It is therefore necessary to carry out appraisal performances of the available banks.In this study, we want to find out if licensing new generation banks will solve the problem of long queues in Nigerian banks and therefore compare the efficiencies of the old generation banks with the new generation banks.2.Related WorksQueue theory can be used to analyze more abstract queues such as in operating system design, saving and withdrawals of cash in banks. It is used to increase placement of merchandising materials at the same time alleviating the actual amount of time a customer spends on waiting line.Erlang, a Danish Engineer who is called the father of queue theory published a paper that narrated the study of congestion in telephone traffic [1]. Molina in [2], worked on theory of probability of telephone trekking problems. Pollaezek (1930) did some works on poison input with single multiple channels problems [3]. Jackson (1957) presented a paper on network of queue where a customer was to go for more than one service point [4]. Little (1961) also joined the group researchers on queuing theory, when he developed a relationship between the expected numbers of customers on the queue in a steady state [5].A review on the positive correlation between arrival rate of customers and banks service rate was carried out in [6] while in [7], it was researched that if service system could provide service at faster rate than customers’ arrival rate, waiting line could still be formed if the arrival and service process are random. Posner and Bernholtz in 1968 treated closed to Jackson networks but, allowed ample service travel time nodes with general travel time (holding time) distribution. They showed that if one were interested in only one marginal probability distribution of a steady-state system size at set of rodes, exclusive of the travel time rode, the exact form of the travel distribution did not matter [8].In [9], multiple-class queuing systems with N-policy in which the idle server starts service as soon as the number of customers in the “start-up” reaches threshold N. The work considered cases of first come first served and no preemptive priority. They obtained the Laplace-Stieltjes transform of the waiting times of each class of customers. They also showed results for general behavior of such systems in their study.[10] deals with the policy for the M/G/1 queue and [11], with the M/G/1 queue with D-policy, i.e., the server is turned off at the end of a busy period and turned on when the cumulative amount of work firstly exceeds some fixed value D. In the work, it was firstly concentrated on the computation of the steady-state probabilities. The first moments and relationships among the busy period, the number of customers served and other performance measures are investigated. Some variants of the main model and the special case of the M/M/1 were also studied.A MX/G/1 queuing system with N-policy was considered in [12]. In the study, the server is turned off as soon as the system empties. When the queue length reaches or exceeds a predetermined value N (a threshold), the server is turned on and begins to serve the customers. In the study, they placed emphasis on understanding the operational characteristics of the queuing system. One of their findings was that the system size was the sum of two independent random variables: one has the PGF of the stationary system size of the MX/G/1 queuing system without N-policy and the other one has the probability generating function. [13]. divide thecompanies' customers into different priority groups to be served according to their payment history and feedback in order to increase the companies' performance and profit and save the time of customers within high priority class which may lead to increase their satisfaction. [14]. Worked on new model for call center queue management. [15]. Compares three Active Queue Management (AQM) methods, namely, Adaptive Gentle Random Early Detection (Adaptive GRED), Random Early Dynamic Detection (REDD), and GRED Linear analytical model with respect to different performance measures.3.MethodologyThis section considers the materials, statistical models and methods used in the study and they are logically grouped below:3.1.Model SpecificationThis model deals with situation where there is more than one service station in parallel where any station can serve customer on the waiting line.(1)Where,e= traffic intensityµ= service rate of the number of people serviced per unit time˄= average arrival rate of the number of people arriving per unit timeC= the number of servers (cashiers)The probability of having no customer in the queue:(2) The probability of not queuing on arrival is given as:(3) The average number of customer in the system is given as:(4) The average number of customer in the queue:(5)The average time a customer spends in system:*Po + (6) The average time spent in queen:(7) 3.2.Linear Markovian Birth ProcessIn linear Markovian pure birth process: the probability of birth in a small time interval is proportional to the current number of population and the length of interval. That is for all n:= 0 and =.The constant proportionality is birth rate or arrival rate:(8) The expected size of the population at time t:E [()t]= t if the population is initialized with members, then size at time t is (E [()t]=)3.3.Application of Queue ModelTable 1. FIRST BANK Plc. With C=3 (i.e. number of cashiers)S/N No of arrival Departure1.54 0.9 56 0.932.56 0.93 59 0.983.61 1.02 62 1.034.58 0.97 61 1.025.62 1.03 65 1.086.59 0.98 63 1.057.61 1.02 64 1.078.60 1.00 62 1.039.56 0.93 59 0.9810.55 0.92 60 1.0011.54 0.90 56 0.9312.57 0.95 58 09713.62 1.03 63 1.0514.60 1.00 62 1.0315.61 1.02 63 1.0516.58 0.97 65 1.0817.58 0.97 64 1.0718.63 1.05 64 1.0719.53 0.88 56 0.9320.56 0.93 62 1.0321.58 0.97 63 1.05Total 1222 1287The data used in this research work is primary data and the method of data collection is through observation. The number of customers serviced in 60minutes in each day was observed and recorded. The number of arrival is the number of customers serviced described earlier added to the number of customers still on the queue at the end of 60minutes.Average Arrival RateAverage Arrival Rate=1.03 minutes.Average Service RateAverage Service TimeTraffic IntensityThe probability of having no customer in the system:Probability of queuing on arrival:Probability of queuing on arrival:The average number of customer in the system:That is, 1 customer / minute.Average number of customer in the queue:Average time spent in the system:=24.41 minutesAverage time spent in the queue:Linear Markovian Birth Arrival process expected size of the queue or population the banking hall in 2hours if the population is initialized with one member:Table 2. GTB Plc. With C=6 (i.e. number of cashiers)S/N ARRIVALDEPARTURE µ1.105 1.75 177 1.952.103 1.72 133 1.883.113 1.88 119 1.984.117 1.95 123 2.055.123 2.05 129 2.156.119 1.98 125 2.087.115 1.92 123 2.058.101 1.68 121 2.029.113 1.88 125 2.0810.117 1.95 129 2.1511.121 2.02 133 2.2212.115 1.92 127 2.1213.103 1.72 119 1.9814.105 1.75 121 2.0115.117 1.95 129 2.1516.119 1.98 135 2.2517.117 1.95 133 2.2218.113 1.88 129 2.1519.107 1.78 127 2.1220.103 1.72 121 2.0221.101 1.68 113 188Total 2347 2611The probability of having no customer in the system:Probability of queuing on arrival:Probability of not queuing on arrival:Average number of customer in the system:Average number of customer in the queue:Average time spent in the system:Average time spent in the queue:Linear Markonau birth/arrival process the expected size of the queue or the population on the queue or the population in the banking hall in 2hours per day is initialized one member:3.4.ResultThe analysis shows an important result which interprets as follows: The number of customers arrived at that time was greater than the number of the cashiers. The probability of queuing on arrival in First Bank was 0.089 and Guaranty Trust Bank was 0.00035. These are weak probability but it is still possible for customer to wait before receiving services. The average number of customers waiting to be served in First Bank Plc. was one customer per minute while Guaranty Trust Bank Plc. was one customer per minute which means at time there will be no customer in the queue.Average time spent in the system in First Bank was 24.41 minutes and average time spent in the queue was 1.03minutes which means that a customer spent at least 23.38minutes in the queue.Guaranty Trust Bank, average time spent in the system was 11.52 minutes which is shorter than that of first bank. Lastly, if the time is extended to two hours in a day First Bank has 128 customers and Guaranty Trust Bank will have 11,085 customers to be attended to.4. ConclusionsA multi-channel queue model was used to analyse the data. The following were calculated with queue model: The probability of having no customer on the queue for two banks, the probability of not queuing in the system for two banks, the average number of customer in the system for two banks and the average time spent in the queue for the two banks.The Markovian birth process was used for the two banks and the result from the analysis shows that new generation bank is more efficient than old generation bank. Some people believe some much in old generation banks because of fear of liquidation and few other reasons, therefore, the increased patronage make them less efficient because management fails to increase their servers.Secondly, the two banks are efficient for the fact that probability of queuing on arrival is not up to 0.1minute. This means that if customer will queue at all, it will be for a very short period of time. The average number of customers waiting to be served in all the banks is not up to one, which means no customer is waiting for service. The best bank is determined by the average time spent in the system and the expected queue is extended to two hours per day. The more efficient bank is guaranty trust bank which has a maximum of 11.53 minutes as average time spent in the system and 11,085 customers on the queue if the hours are extended to two hours and this customer is expected to be attended to within 12minutes. The management of First Bank needs to improvetheir service mechanism because most of time spent in the banking hall is used in receiving services. This at times is beyond human effort because is mostly caused by online services. Server may go down or poor network services of automated teller machines. First Bank may need to employ more cashiers to be more efficientAcknowledgmentWe wish to acknowledge the supervisor of this work, Dr. Tope Omolofe and all other fellows who in one form or the other assisted in a successful execution of the work.References[1]Journal 19, Gurukul Institute of Engineering and Technology Molina, Application of Theory ofProbability to Telephone, 1927.[2]Framas A.P. Business Mathematics and Statistics 2nd Edition ELBS Publication London, 1990.[3]Journal 19, Gurukul Institute of Engineering and Technology Molina, Application of Theory ofProbability to Telephone, 1927.[4]Jackson J. R. Networks of Waiting Lines. Operations Research 1957, 5(4); 518-521.[5]Little J. A proof for queuing Formula IBM Technical Publication Department, 1961.[6]Oladapo. International Institution of Science, Technology of Education, 1998.[7]Ashley. An appraisal of cost of queuing in Nigeria. University of Ilorin Publication, 2002.[8]Posner M. and Bernholtz B. Closed finite queuing networks with time lag and with several classes of unit,Operations Research, 1965, 16(5), page 977-985.[9]Lee H. W., Yoon S. H. and Seo W. J. Start-up class models in multiple-class queues with N-policy.Queueing Systems, 1999, 31(1) page 101-124.[10]Heyman D. P. The policy for the M/G/1 queue, Management Science, 1997, 23(7), 775-778.[11]Balachandran K. R. and Tijms H. On the D-policy for M/G/1 queue, Management. Science, 1975, 21(9),1073-1076.[12]Lee H. W. and Lee S. S. Operating characteristics of MX/G/1 queue with N-policy, Queueing Systems,1994, 15, 387-399.[13]Youseef A. Average waiting system of customer in a new queue system with different classes, BusinessProcess Management, 2013, 19(1), 146-168.[14]Chassiotic E. and Worthingtol DJ. A new model for call center queue management, Operation researchsociety, 2004, 55(12), 1352-1357.[15]Hussein A.J. Performance study active queue management methods, king saud university, 2015, 27(4),416-429.Authors’ ProfilesDavid O. Ikotun was born on the 25th of July 1977. He obtained higher national diploma instatistics at Federal Polytechnic, Ede in 2002. He also has post graduate diploma in statistics,2010 at Federal University of Technology, Akure.He obtained master in statistics from the University of Ilorin. He is currently a lecturer inthe department of mathematics and statistics of Interlink Polytechnic, Ijebu Jesa, Nigeria.Comparative Analysis of Customers’ Queue Management of First Bank Plc. and Guaranty Trust Bank Plc, 11Isokun Ilesa, NigeriaJustus A. Ademuyiwa was born on 21st of November, 1977. He has higher nationaldiploma, 2001 in statistics at Federal Polytechnic, Ado Ekiti.He has post graduate diploma in statistics at Federal University of Technology, Akureand master in statistics at University of Ilorin, Nigeria. He is currently the head ofdepartment of statistics, Federal Polytechnic, Ile-Oluji, Nigeria.Festus D. Famule has higher national diploma in statistics from Ibadan Polytechnic, postgraduate diploma and master in statistics from University of Ibadan. He is currently a chieflecturer in the department of Mathematics and Statistics, Osun State College of Technology,Esa-Oke.How to cite this paper: David O. Ikotun, Justus A. Ademuyiwa, Festus D. Famule,"Comparative Analysis of Customers' Queue Management of First Bank Plc. and Guaranty Trust Bank Plc, Isokun Ilesa, Nigeria", International Journal of Mathematical Sciences and Computing(IJMSC), Vol.2, No.4, pp.1-11, 2016.DOI: 10.5815/ijmsc.2016.04.01。
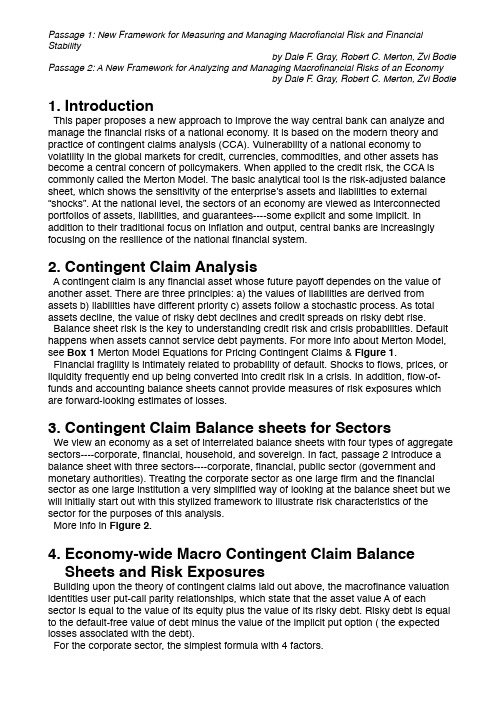
by Dale F. Gray, Robert C. Merton, Zvi Bodie 1.IntroductionThis paper proposes a new approach to improve the way central bank can analyze and manage the financial risks of a national economy. It is based on the modern theory and practice of contingent claims analysis (CCA). Vulnerability of a national economy to volatility in the global markets for credit, currencies, commodities, and other assets has become a central concern of policymakers. When applied to the credit risk, the CCA is commonly called the Merton Model. The basic analytical tool is the risk-adjusted balance sheet, which shows the sensitivity of the enterprise’s assets and liabilities to external “shocks”. At the national level, the sectors of an economy are viewed as interconnected portfolios of assets, liabilities, and guarantees----some explicit and some implicit. In addition to their traditional focus on inflation and output, central banks are increasingly focusing on the resilience of the national financial system.2.Contingent Claim AnalysisA contingent claim is any financial asset whose future payoff dependes on the value of another asset. There are three principles: a) the values of liabilities are derived from assets b) liabilities have different priority c) assets follow a stochastic process. As total assets decline, the value of risky debt declines and credit spreads on risky debt rise.Balance sheet risk is the key to understanding credit risk and crisis probabilities. Default happens when assets cannot service debt payments. For more info about Merton Model, see Box 1 Merton Model Equations for Pricing Contingent Claims & Figure 1.Financial fragility is intimately related to probability of default. Shocks to flows, prices, or liquidity frequently end up being converted into credit risk in a crisis. In addition, flow-of-funds and accounting balance sheets cannot provide measures of risk exposures which are forward-looking estimates of losses.3.Contingent Claim Balance sheets for SectorsWe view an economy as a set of interrelated balance sheets with four types of aggregate sectors----corporate, financial, household, and sovereign. In fact, passage 2 introduce a balance sheet with three sectors----corporate, financial, public sector (government and monetary authorities). Treating the corporate sector as one large firm and the financial sector as one large institution a very simplified way of looking at the balance sheet but we will initially start out with this stylized framework to illustrate risk characteristics of the sector for the purposes of this analysis.More info in Figure 2.4.Economy-wide Macro Contingent Claim BalanceSheets and Risk ExposuresBuilding upon the theory of contingent claims laid out above, the macrofinance valuation identities user put-call parity relationships, which state that the asset value A of each sector is equal to the value of its equity plus the value of its risky debt. Risky debt is equal to the default-free value of debt minus the value of the implicit put option ( the expected losses associated with the debt).For the corporate sector, the simplest formula with 4 factors.by Dale F. Gray, Robert C. Merton, Zvi Bodie For the financial sector, the support from government is added into its function with 4 factors.For the sovereign, passage 2 has more info. See in passage 2 Figure 2. Assets include: foreign currency reserves and contingent foreign currency reserves; net fiscal asset (present value of taxes and revenues, including seignorage, less present value of government expenditures); and other public assets. Liabilities include: local-currency debt; foreign-currency debt; financial guarantees; base money. Public sector is divided into two parts----government & monetary authority. A case can be made that foreign currency debt is senior to local currency debt.For the household sector, the formula is different. See more in Passage 2.Problem: How to understand “The household sector asset is equal to the household net worth plus c which is consumption modeled as a “dividend” payment out of the household asset up to time T”?5.Interrelationship of Macro Financial Contingent ClaimBalance Sheets, Risk Exposures and TraditionalMacroeconomic Flows.Flow of funds can be seen as a special deterministic case of the CCA balance sheet equations when volatility is set to zero and annual changes are calculated. The risk transmission between sectors is lost. Risk managers would find it difficult to analyze the risk exposure of their firm or financial institution by relying solely on the income an cashflow statements, and not taking into account balance sheet or information on their institution’s derivative or option positions. Country risk analysis that relies only on macroeconomic flow-based approach is deficient in a similar way.6.Measuring Implied Asset Value and Volatilities UsingMarket PricesFirms and Financial InstitutionsThe simplest method solves two equations for two unknowns, asset value and asset volatility.SovereignA simplified balance sheet (subtracting the “senior” guarantee to too-big-to-fail entities from both sides the balance sheet as shown). See more in passage 2.Household Sector Balance SheetIn the household sector, we can user macroeconomic data and info from household surveys to construct measures of the portfolio of household assets directly, for the most part, and try to estimate the volatility of household assets directly. Household balance sheet assets include financial assets and estimated labor income. For the household “subsidiary” balance sheet, direct estimation of the real estate prices, volatilities and debt obligations is likely to be the most practical approach.by Dale F. Gray, Robert C. Merton, Zvi Bodie 7.Some Important Extensions and Refinements of CCAModelsRecent research has studied the relationship between the volatility skew implied by equity options and CDS spreads. They establish a relationship between implied volatility of two equity options.Merton Model has been extended to include stochastic interest rates.8.Measuring Risk ExposuresRisk exposures in risky debt, probabilities of default, distance-to-distress, spreads on debt and the sensitivity of the implicit options to the change in the underlying asset and other measures.9.Risk Transmission Between SectorsThe risk-transmission patterns can be dampened or may be magnified depending on the capital structure and linkages.corporate to banking; banking to government; government to banking/financial system; Pension to government; sovereign to debt holders; markets to household and then to consumption; potential highly non-linear risk transmission when assets of one sector are linked (through implicit put options) to the assets of another sector.10.Balance Sheet Risk Framework for Stress Testing,Scenario, and Simulation AnalysisExample of financial stability stress-testing with CCA model, factor model and Macro Model.Example of Banking Stability Stress-testing with links to corporate and household sub-sectorsExample of Stress-Testing and Accessing Capital Adequacy Using CCA Models of Financial Institutions11.Integrating Financial Risk Models and Indicatorswith Macro ModelsCredit risk, and the market risk of the claims held in agent’s financial portfolios, are generally absent even in the majority of state-of-the-art macroeconomic models.In order to understand the interaction of balance sheet risk and the macroeconomy a promising area of future research is the integration of the financial risk analytic models and indicators with traditional macroeconomic models. Macroeconomic models are primarily stock-flow models in discrete time and are usually geared to try to forecast the mean of macroeconomic variables. Financial risk analytics is critical in risk analysis. CCA is a framework with volatile assets relative to a distress barrier using option pricing concepts to calculate credit risk indicators. Whatever level of aggregation is chosen, the time pattern of the following could be calculated and used with macroeconomic models:Time series of CCA balance sheet components and sensitivity measures.Time series of CCA derived credit risk indicators (distance-to-distress, estimated default probability, CCA credit spreads)by Dale F. Gray, Robert C. Merton, Zvi Bodie Time series of market indicators such as observed CDS and bond spreads or market risk appetite indicators (such as VIX)12.Financial Risk Analytic Indicators and MonetaryPolicy ModelsFinancial stability models and monetary stability models, by their nature, are very different framework. There is keen interest in relating these two types of analysis, but no consensus on how it can be done.The primary tool for macroeconomic management is the interest rate set by the central bank. A simple for module monetary policy model of this type consists of an equation for the GDP output gap, an equation for inflation, an equation for exchange rate and real interest rates, and a Taylor rule for setting the domestic policy rate. The domestic policy rate is a short-term interest rate set by the central bank, such as the Federal Funds rate in the United States.Since the economy and interest rates affects financial sector credit risk, and the financial sector affects the economy, an important issue is whether credit risk indicators should be included in monetary policy models and, if so, how. The next step could be to add a fifth equation relating the CRIs to GDP and interest rates. Using past data, it might be interesting to include the CRI in the policy rate reaction function to examine whetherfinancial stability appears to have been taken into account when setting interest rates in the past.13.conclusions。

翻译翻译题是高校自主招生测试部分的新增题型,主要考查考生的英译汉能力,要求考生将一篇200到300词的短文译成中文,或在一篇文章中划出若干句子译成中文。
高校自主招生的翻译部分主要有一下特点:主要考查考生对文章的理解、基础语法以及常见的句式和短语的掌握和运用。
内容专业性不强,不需要专业理论知识。
题目内容既没有高难度的新闻翻译、文学翻译,也不涉及科技经贸翻译中的专业知识,只是一般的文章翻译,与其说是测试考生的翻译能力,不如说是测试考生的英语语言能力,尤其是对原文理解能力更确切,因此谈不上翻译的“信、达、雅”标准。
翻译时要通读并透彻理解通篇文章、整个句子。
判断句子是简单句还是复杂句,然后弄清句子的主干和修饰成分。
要特别注意英语的逻辑思维。
最后审核,这是不可缺少的一个重要环节,而且在最后审核时一定要结合整篇文章来进行,这样才能检查出译文在理解和表达上有什么问题,是否有错误和误译,以便及时改正。
用词要规范:尽量使用书面语言,通俗易懂的词。
少用俚语、生僻词或陈词滥调,以免影响效果。
用词要简洁有力:简洁是为了清晰,译文中多余的词不但不能增强语言的表现力,反而使语言显得累赘。
因此翻译时要避免用词重复啰嗦。
真题导入一(北京大学2010年)1.与其诅咒黑暗,不如点亮蜡烛。
(better)2.能源危机对全球经济有消极作用,导致经济衰退。
(impact)试题精解参考译文1. Better to light one candle than to curse the darkness.2. Energy crisis has a negative impact on the global economy, leading to economic recession.真题导入二(北京大学2007年)I. Translate the underlined sentences in the following passage from English into Chinese.Thanks to the work of many scientists, we are now clear that many of the important earthquake regions are places where the movements of plates are happening and therefore, it becomes much easier to look for signs that an earthquake is coming soon. (1) In the past few years, there has been great excitement about the possibility of finding out when earthquakes are going to happen by measuring changes in the rocks, but we are still not sure whether this can be the basis for an efficient means of predicting earthquakes. But further research on this subject may suggest ways in which earthquakes can be predicted and. prevented. (2) One idea is that it might be possible to reduce the pressures that have built up in rocks by pumping in water at high pressure, thus producing a wet surface on which the two opposite side of the fault can slide (move smoothly).Now the question is that nobody is quite sure what the results might be.Ⅱ.Translate the following sentences into English with the words or expressions given in the brackets.1.宴会举行到一半酒就喝光了,我们本该事先多买些的。

Central Bank Independence and Macroeconomic Performance:Some ComparativeEvidenceAlberto Alesina;Lawrence H.SummersJournal of Money,Credit and Banking,Vol.25,No.2.(May,1993),pp.151-162.Stable URL:/sici?sici=0022-2879%28199305%2925%3A2%3C151%3ACBIAMP%3E2.0.CO%3B2-TJournal of Money,Credit and Banking is currently published by Ohio State University Press.Your use of the JSTOR archive indicates your acceptance of JSTOR's Terms and Conditions of Use,available at/about/terms.html.JSTOR's Terms and Conditions of Use provides,in part,that unless you have obtained prior permission,you may not download an entire issue of a journal or multiple copies of articles,and you may use content in the JSTOR archive only for your personal,non-commercial use.Please contact the publisher regarding any further use of this work.Publisher contact information may be obtained at/journals/ohio.press.html.Each copy of any part of a JSTOR transmission must contain the same copyright notice that appears on the screen or printed page of such transmission.The JSTOR Archive is a trusted digital repository providing for long-term preservation and access to leading academic journals and scholarly literature from around the world.The Archive is supported by libraries,scholarly societies,publishers, and foundations.It is an initiative of JSTOR,a not-for-profit organization with a mission to help the scholarly community take advantage of advances in technology.For more information regarding JSTOR,please contact support@.Sat Feb915:34:002008You have printed the following article:Central Bank Independence and Macroeconomic Performance:Some ComparativeEvidenceAlberto Alesina;Lawrence H.SummersJournal of Money,Credit and Banking ,Vol.25,No.2.(May,1993),pp.151-162.Stable URL:/sici?sici=0022-2879%28199305%2925%3A2%3C151%3ACBIAMP%3E2.0.CO%3B2-TThis article references the following linked citations.If you are trying to access articles from anoff-campus location,you may be required to first logon via your library web site to access JSTOR.Please visit your library's website or contact a librarian to learn about options for remote access to JSTOR.[Footnotes]2Political and Monetary Institutions and Public Financial Policies in the Industrial Countries Vittorio Grilli;Donato Masciandaro;Guido Tabellini;Edmond Malinvaud;Marco PaganoEconomic Policy ,Vol.6,No.13.(Oct.,1991),pp.341-392.Stable URL:/sici?sici=0266-4658%28199110%296%3A13%3C341%3APAMIAP%3E2.0.CO%3B2-T3Political and Monetary Institutions and Public Financial Policies in the Industrial Countries Vittorio Grilli;Donato Masciandaro;Guido Tabellini;Edmond Malinvaud;Marco PaganoEconomic Policy ,Vol.6,No.13.(Oct.,1991),pp.341-392.Stable URL:/sici?sici=0266-4658%28199110%296%3A13%3C341%3APAMIAP%3E2.0.CO%3B2-T6Political and Monetary Institutions and Public Financial Policies in the Industrial Countries Vittorio Grilli;Donato Masciandaro;Guido Tabellini;Edmond Malinvaud;Marco PaganoEconomic Policy ,Vol.6,No.13.(Oct.,1991),pp.341-392.Stable URL:/sici?sici=0266-4658%28199110%296%3A13%3C341%3APAMIAP%3E2.0.CO%3B2-T8Political and Monetary Institutions and Public Financial Policies in the Industrial Countries Vittorio Grilli;Donato Masciandaro;Guido Tabellini;Edmond Malinvaud;Marco PaganoEconomic Policy ,Vol.6,No.13.(Oct.,1991),pp.341-392.Stable URL:/sici?sici=0266-4658%28199110%296%3A13%3C341%3APAMIAP%3E2.0.CO%3B2-TLINKED CITATIONS -Page 1of 3-8Seigniorage and Political InstabilityAlex Cukierman;Sebastian Edwards;Guido TabelliniThe American Economic Review ,Vol.82,No.3.(Jun.,1992),pp.537-555.Stable URL:/sici?sici=0002-8282%28199206%2982%3A3%3C537%3ASAPI%3E2.0.CO%3B2-J Literature CitedPolitics and Business Cycles in Industrial DemocraciesAlberto Alesina;James Mirrlees;Manfred J.M.NeumannEconomic Policy ,Vol.4,No.8.(Apr.,1989),pp.55-98.Stable URL:/sici?sici=0266-4658%28198904%294%3A8%3C55%3APABCII%3E2.0.CO%3B2-J Seigniorage and Political InstabilityAlex Cukierman;Sebastian Edwards;Guido TabelliniThe American Economic Review ,Vol.82,No.3.(Jun.,1992),pp.537-555.Stable URL:/sici?sici=0002-8282%28199206%2982%3A3%3C537%3ASAPI%3E2.0.CO%3B2-JPolitical and Monetary Institutions and Public Financial Policies in the Industrial Countries Vittorio Grilli;Donato Masciandaro;Guido Tabellini;Edmond Malinvaud;Marco Pagano Economic Policy ,Vol.6,No.13.(Oct.,1991),pp.341-392.Stable URL:/sici?sici=0266-4658%28199110%296%3A13%3C341%3APAMIAP%3E2.0.CO%3B2-TRules Rather than Discretion:The Inconsistency of Optimal PlansFinn E.Kydland;Edward C.PrescottThe Journal of Political Economy ,Vol.85,No.3.(Jun.,1977),pp.473-492.Stable URL:/sici?sici=0022-3808%28197706%2985%3A3%3C473%3ARRTDTI%3E2.0.CO%3B2-ALINKED CITATIONS -Page 2of 3-The Political Business CycleWilliam D.NordhausThe Review of Economic Studies ,Vol.42,No.2.(Apr.,1975),pp.169-190.Stable URL:/sici?sici=0034-6527%28197504%2942%3A2%3C169%3ATPBC%3E2.0.CO%3B2-H Elections and Macroeconomic Policy CyclesKenneth Rogoff;Anne SibertThe Review of Economic Studies ,Vol.55,No.1.(Jan.,1988),pp.1-16.Stable URL:/sici?sici=0034-6527%28198801%2955%3A1%3C1%3AEAMPC%3E2.0.CO%3B2-E Postwar Developments in Business Cycle Theory:A Moderately Classical Perspective:CommentLawrence H.SummersJournal of Money,Credit and Banking ,Vol.20,No.3,Part 2:Recent Developments in Macroeconomics.(Aug.,1988),pp.472-476.Stable URL:/sici?sici=0022-2879%28198808%2920%3A3%3C472%3APDIBCT%3E2.0.CO%3B2-DLINKED CITATIONS -Page 3of 3-。
《宏观经济学》试卷A注意:请在答题纸上作答,考试时间120分钟,可以翻阅纸质字典,不得携带电子词典及手机等。
Part 1: Single Choice (40×1′=40′)1. Macroeconomics is the study of ( ) a. market regulation. b. money and financial markets. c. economy-wide phenomena. d. how households and firms make decisions and how they interact.2. National income is defined as ( ) a. all income produced within a country. b. the income received by the national government. c. the total income earned by a nation’s residents f rom the production of goods and services within the borders of the country. d. the total income earned by a nation’s residents in the production of goods and services.3. The best measure of a country’s production of goods and services is ( ) a. real GDP. b. real NNP. c. nominal GDP. d. nominal GNP.4. GDP is used as the basic measure of a society’s economic well -being. A better measure of the economic well-being of individuals in society is ( ) a. the consumption component of GDP. b. GDP per person. c. government expenditures per person. d. the level of business investment.5. The inflation rate is defined as the ( ) a. cost of inflation. b. cost of borrowing. c. percentage change in real GDP from the previous period. d. percentage change in the price level from the previous period.6. If the nominal interest rate is 8% and rate of inflation is 2%, the real interest rate is ( ) a. 16%. b. 10%. c. 6%. d. 4%.7. What is the purpose of measuring the overall level of prices in the economy? ( ) a. to allow consumers to know what kinds of prices to expect in the future b. to allow the measurement of GDP c. to allow comparison between dollar figures from different points in time d. All of the above are correct.8. A COLA automatically raises the wage rate when ( ) a. real GDP increases. b. the labor force increases.c. taxes increase.d. the consumer price index increases.9. A certificate of indebtedness that specifies the obligations of the borrower to the holder is called a ( ) a. stock. b. mutual fund. c. bond. d. All of the above are correct. 10. Stock indexes are ( ) a. reports in the newspapers that report on the price of the stock and earnings of individual corporations over time. b. the average of a group of stock prices. c. measures of the risk relative to the profitability of corporations. d. measures of the price of a stock relative to its risk.11. If Congress raised the tax on interest income, investment ( ) a. and saving would increase. b. and saving would decrease. c. would increase and saving would decrease. d. would decrease and saving would increase. 12. An increase in the budget deficit shifts the ( ) a. demand for loanable funds left. b. demand for loanable funds right. c. supply of loanable funds left. d. supply of loanable funds right.13. Which of the following beliefs would make someone less likely to oppose government deficits? ( ) a. The return on private investment is higher than the return on public investment. b. Taxes considerably distort private decision making. c. The demand for loanable funds curve is very steep. d. All of the above would make someone less likely to oppose government deficits.14. Which of the following people is counted as unemployed according to official statistics? ( ) a. Nancy, who is on temporary layoff b. Gary, who has retired and is not looking for work c. Brian, a full-time student who is not looking for work d. All of the above are correct.15. The natural rate of unemployment is ( ) a. zero percent. b. the rate associated with the highest possible level of GDP. c. created primarily by short-run fluctuations in real GDP. d. the amount of unemployment that the economy normally experiences. 16. Sectoral shifts in the economy ( ) a. create structural unemployment. b. immediately reduce unemployment. c. on net leave unemployment unchanged. d. increase unemployment due to job search. 17. Minimum wage laws ( )院系: 专业班级: 姓名: 学号:装 订 线a. probably reduce teenage employment.b. are probably the major cause of natural unemployment.c. probably most adversely affect skilled workers.d. All of the above are correct.18. Angela is the newly appointed CEO of a company that manufactures computer chips on an assembly line. Her staff has told her that given productivity numbers, they suspect some workers may be shirking. According to efficiency wage theory, what should she do? ( ) a. Pay all workers more than the equilibrium wage rate. b. Reward those who shirk with higher wages. c. Pay below the equilibrium wage rate to make up for the loss from shirking. d. Make sure that workers are getting paid exactly the equilibrium wage rate.19. Which of the following best illustrates the unit of account function of money? ( ) a. You list prices for candy sold on your Web site, , in dollars. b. You pay for tickets to a WNBA game with dollars. c. You keep $10 in your backpack for emergencies. d. None of the above is correct. 20. M1 includes ( ) a. savings deposits. b. money market deposit accounts. c. currency. d. All of the above are correct.21. The Federal Open-market Committee is made up of ( ) a. 5 of the 12 presidents of the Federal Reserve Regional banks, and the 7 members of the Board of Governors. b. the 12 presidents of the Federal Reserve Regional banks, and the Chair of the Board of Governors. c. the 12 presidents of the Federal Reserve Regional banks, and the 7 members of the Board of Governors. d. 7 of the 12 presidents of the Federal Reserve Regional banks, and the 5 members of the Board of Governors.22. If banks choose to hold more excess reserves, ( ) a. required reserves in the banking system increase. b. the money multiplier will increase. c. the discount rate will increase. d. the money supply falls.23. The Fed can influence unemployment in ( ) a. the short run, but not the long run. b. the short and long run. c. the long run, but not the short run. d. neither the short nor long run.24. When the price level rises, the number of dollars needed to buy a representative basket of goods ( ) a. decreases, so the value of money rises. b. decreases, so the value of money falls. c. increases, so the value of money rises.d. increases, so the value of money falls.25. If velocity and output were nearly constant, ( ) a. the inflation rate would be much higher than the money supply growth rate. b. the inflation rate would be much lower than the money supply growth rate. c. the inflation rate would be about the same as the money supply growth rate. d. Any of the above could be correct, more information is needed.26. If the money supply growth rate permanently increased from 10 percent to 20 percent we would expect that inflation and nominal interest rates would both increase ( ) a. by more than 10 percentage points. b. by 10 percentage points. c. but by less than 10 percentage points. d. None of the above is correct. 27. Shoeleather costs refer to ( ) a. the cost of more frequent price changes induced by higher inflation. b. resources used to maintain lower money holdings when inflation is high. c. the distortion in resource allocation created by distortions in relative prices due to inflation. d. the distortion in incentives, created by inflation, by taxes that do not adjust for inflation. 28. In order to maintain stable prices, the central bank must ( ) a. tightly control the money supply. b. keep unemployment low. c. sell indexed bonds. d. All of the above are correct. 29. Business cycles ( ) a. are explained mostly by fluctuations in corporate profits. b. no longer are very important due to government policy. c. are fluctuations in real GDP and related variables over time. d. All of the above are correct.30. Most economists believe that classical economic theory is a good description of the world in ( ) a. the long run, but not in the short run. b. the short run, but not in the long run. c. the short run and in the long run. d. neither the short nor long run.31. A decrease in U.S. interest rates leads to ( ) a. an appreciation of the dollar that leads to smaller exports. b. an appreciation of the dollar that leads to greater net exports. c. a depreciation of the dollar that leads to smaller net exports. d. a depreciation of the dollar that leads to greater net exports. 32. The long-run aggregate supply curve shifts right if ( ) a. Congress raises the minimum wage substantially. b. unemployment insurance benefits are made more generous. c. immigration from abroad increases. d. All of the above are correct.院系: 专业班级: 姓名: 学号:装 订 线33. Suppose a shift in aggregate demand creates an economic contraction. If policymakers can respond with sufficient speed and precision, they can offset the initial shift by shifting aggregate ( ) a. supply left. b. supply right. c. demand left. d. demand right.34. Which of the following has been suggested as an important cause of the Great Depression? ( ) a. a decline in the money supply b. a large decline in government expenditures c. an increase in the relative price of oil d. All of the above are correct.35. According to liquidity preference theory, which of the following shifts the money demand curve to the left? ( ) a. a decrease in the price level b. an increase in the price level c. an increase in the interest rate d. Both b and c are correct.36. If Congress cuts spending to balance the federal budget, the Fed can act to prevent unemployment and recession while maintaining the balanced budget by ( ) a. raising taxes. b. cutting expenditures. c. increasing the money supply. d. decreasing the money supply.37. Investment tax credits are designed to ( ) a. increase aggregate demand in the short run and eventually increase long-run aggregate supply. b. increase aggregate demand in the short run, but eventually decrease long-run aggregate supply. c. increase aggregate demand in the short run and have no impact on aggregate supply. d. None of the above is correct.38. According to Friedman and Phelps, the unemployment rate is above the natural rate when actual inflation ( ) a. is greater than expected inflation. b. equals expected inflation. c. is less than expected inflation. d. is high.39. The restrictive monetary policy followed by the Fed in the early 1980s ( ) a. reduced both unemployment and inflation. b. reduced inflation significantly, but at the cost of a severe recession. c. reduced unemployment significantly, but at the cost of higher inflation. d. raised both unemployment and inflation.40. A favorable supply shock will cause the short-run Phillips curve to shift ( ) a. left, and unemployment to rise. b. left, and unemployment to fall. c. right, and unemployment to rise. d. right, and unemployment to fall.Part 2: Simply answer following questions (4×5′=20′)1. How will following events influence the GDP of U.S. by expenditure method? (1)Boeing Company sold a plane to the U.S. Air Force. (2)Boeing Company sold a plane to the U.S. Air Company. (3)Boeing Company sold a plane to the Franc Air Company. (4)Boeing Company sold a plane to Mr. Cross.(5)Boeing Company produced a plane which will be sold in the next half year. 2. Who control the money supply? How does it control?3. Try to tell the relationship between short run Philips curve and long run Philips curve.4. What factors can cause unemployment? How?Part3: Calculate (2×10′=20′)1. Consider following events in certain economy:Y=5000、G=1000、T=1000、C=250+0.75(Y -T)、I=1000+50R(1)Try to calculate private saving, public saving and national saving in this economy (2) Try to find the equilibrium interest rate(3) Suppose Government purchase increase to 1250, try to calculate private saving, public saving and national saving(4) Try to find the new equilibrium2. Suppose in an economy, there are 0.76 billion adults, and 0.48 billion of them are working, 0.04 billion of them are looking for job, 0.18 billion of them are neither working nor looking for a job. Try to calculate(1) Labor force amount (2) Labor participate rate (3) Unemployment ratePart4: Analysis following questions(2×10′=20′)1. Try to tell the development path of macroeconomics. (How did it appear? How did it change?)2. Try to use the macroeconomics knowledge to analyze the current economic condition and try toafford some macroeconomic policies in China, and try to analyze their impacts to economy.院系: 专业班级: 姓名: 学号:装 订 线《国际贸易专业宏观经济学》试卷A宏观经济学(双语)A 卷参考答案Part1:1C 2D 3A 4B 5D 6C 7C 8D 9C 10B 11 B 12C 13C 14A 15D 16D 17A 18A 19A 20C 21A 22D 23A 24D 25C 26B 27B 28A 29C 30A 31A 32C 33D 34A 35A 36C 37A 38C 39B 40B Part2:1. (1) Increases government purchases and then increases GDP (2) Increases investment and then increases GDP (3) Increases net export and then increases GDP (4) Increases consumption and then increase GDP (5) Increases investment and then increase GDP2. Federal Open Market Committee conducts monetary policy by controlling the money supply. The money supply is the quantity of money available in the economy. The primary way in which the Fed changes the money supply is through open-market operations. The Fed purchases and sells U.S. government bonds. To increase the money supply, the Fed buys government bonds from the public. To decrease the money supply, the Fed sells government bonds to the public.3. The Phillips curve shows the short-run combinations of unemployment and inflation that arise as shifts in the aggregate demand curve move the economy along the short-run aggregate supply curve. The Phillips curve seems to offer policymakers a menu of possible inflation and unemployment outcomes. As a result, the long-run Phillips curve is vertical at the natural rate of unemployment. Monetary policy could be effective in the short run but not in the long run. In the long run, expected inflation adjusts to changes in actual inflation.4. Job search, this unemployment is different from the other types of unemployment. It is not caused by a wage rate higher than equilibrium. It is caused by the time spent searching for the “right” job. Minimum wage laws, although minimum wages are not the predominant reason for unemployment in our economy, they have an important effect on certain groups with particularly high unemployment rates. When the minimum wage is set above the level that balances supply and demand, it creates unemployment. Unions, a union is a worker association that bargains with employers over wages and working conditions. In the 1940s and 1950s, when unions were at their peak, about a third of the U.S. labor force was unionized. A union is a type of cartel attempting to exert its market power. Efficiency wages, Efficiency wages are above-equilibrium wages paid by firms in order to increase worker productivity. The theory of efficiency wages states that firms operate more efficiently if wages are above the equilibrium level.Part3:1. (1) Private saving=Y-T-C=5000-1000-(250+0.75*4000)=750 Public saving=T-G=1000-1000=0 National saving=750(2) I=S 1000+50R=750 R=-5 (3) Private saving=750Public saving=T-G-1000-1250=-250 National saving=500(4) 1000+50R=500 R=-10 2. (1) labor force: 0.48+0.04=0.52(2) Labor participate rate: 0.52/0.76=68% (3) Unemployment rate: 0.04/0.52=7.7%院系: 专业班级: 姓名: 学号:装 订 线。
⼴外货币银⾏学期末重点全英⽶什⾦考试题型以及分数分布:⼀、选择题:1’*20=20’⼆、名词解释:4’*5=20’三、简答题:8’*5=40’四、论述题:20’*1=20’重点制作思路:1.考虑到时间关系,抓⼤放⼩2.结合⽼师提及复习内容进⾏预测3.以理顺书本架构为主,看到⼀个知识点猜⼀下可能会出什么题The economics of money,banking and financial markets----by Kyle Chapter1:Why Study Money, Banking, and Financial Markets?(本章了解⼀下这个问题即可,最多考⼀下选择)Answer:To examine how financial markets such as bond and stock markets workTo examine how financial institutions such as banks workTo examine the role of money in the economyChapter2:An Overview of the Financial System1.Function of Financial MarketsPerform the essential function of channeling funds from economic players that have saved surplus funds to those that have a shortage of fundsDirect finance: borrowers borrow funds directly from lenders in financial markets by selling them securities.Promotes economic efficiency by producing an efficient allocation(分配)of capital(资⾦), which increases production Directly improve the well-being of consumers by allowing them to time purchases better 2.Structure of Financial Markets Debt and Equity (普通股)MarketsPrimary and Secondary MarketsExchanges and Over-the-Counter (OTC不通过交易所⽽直接售给顾客的) MarketsMoney and Capital Markets(货币和资本市场)3. Financial Market Instruments(要能举出例⼦,很可能考选择)Money markets deal in short-term debt instrumentsCapital markets deal in longer-term debt and equity instruments.4.Internationalization of Financial Markets(重点,选择、名词解释都有可能)Foreign Bonds & EurobondEurocurrencies & EurodollarsWorld Stock Markets5.Function of Financial Intermediaries: Indirect Finance(记⼀下⾦融中介机构的功能,交易成本很可能考名词解释)Lower transaction costs (time and money spent in carrying out financial transactions).Reduce the exposure of investors to riskDeal with asymmetric 不对称information problemsConclusion:Financial intermediaries allow “small” savers and borrowers to benefit from the existence of financial markets.6. Types of Financial Intermediaries(会分类即可)Depository institutionsContractual saving institutionsInvestment intermediaries7.Regulation of the Financial SystemTo increase the information available to investors:To ensure the soundness 健康稳固of financial intermediariesChapter3:What Is Money?1.Meaning of Money(即definition,必考名词解释!!)Money (or the “money supply”): anything that is generally accepted in payment for goods or services or in the repayment of debts.2.Functions of Money(重点)Medium of Exchange:A medium of exchange mustUnit of Account:Store 储藏of Value:3.Evolution of the Payments SystemCommodity 商品MoneyFiat 法定MoneyChecks ⽀票Electronic Payment (e.g. online bill pay).E-Money (electronic money):4.Measuring Money (重中之重,M1/M2都很有可能考名词解释)Construct monetary aggregates using the concept of liquidity:(构建货币总量使⽤流动性的概念)M1 (most liquid assets)= currency + traveler’s checks + demand deposits + other checkable deposits.M2 (adds to M1 other assets that are not so liquid) = M1 + small denomination time deposits + savings deposits and money market deposit accounts + money marketmutual fund shares.Chapter 4:Understanding Interest Rates1.measuring interest rates:Present Value(很可能考察名词解释)A dollar paid to you one year from now is less valuable than a dollar paid to you todaySimple Present Value:PV=CF/(1+i)n次⽅2.Four Types of Credit Market InstrumentsSimple LoanFixed Payment LoanCoupon Bond 附票债券Discount Bond 贴现债券3.Yield to Maturity(重点,很可能名词解释)The interest rate that equates the present value of cash flow payments received from a debt instrument with its value today 计算4种不同信⽤⼯具外加Consol or Perpetuity(⾦边债券或永久债券)的YM4. Yield on a Discount Basis(了解即可)Current Yield当期收益率Yield on a Discount Basis 折价收益率Rate of Return 收益率5.Rate of Return and Interest Rates(收益率与利息率的distinction)The return equals the yield to maturity only if the holding period equals the time to maturityA rise in interest rates is associated with a fall in bond prices, resulting in a capital loss if time to maturity is longer than the holding periodThe more distant a bond’s maturity, the greater the size o f the percentage price change associated with an interest-rate changeThe more distant a bond’s maturity, the lower the rate of return the occurs as a result of an increase in the interest rate Even if a bond has a substantial initial interest rate, its return can be negative if interest rates rise6.Interest-Rate RiskPrices and returns for long-term bonds are more volatile than those for shorter-term bondsThere is no interest-rate risk for any bond whose time to maturity matches the holding period7.Real and Nominal Interest Rates(重点,很可能考察简答题)Nominal interest rate makes no allowance for inflationReal interest rate is adjusted for changes in price level so it more accurately reflects the cost of borrowingEx ante real interest rate is adjusted for expected changes in the price levelEx post real interest rate is adjusted for actual changes in the price level8.Fisher Equation(重点考察)Chapter5:The Behavior of Interest Rates1.Determining the Quantity Demanded of an AssetWealth: the total resources owned by the individual, including all assetsExpected Return: the return expected over the next period on one asset relative to alternative assetsRisk: the degree of uncertainty associated with the return on one asset relative to alternative assetsLiquidity: the ease and speed with which an asset can be turned into cash relative to alternative assets(流动性很有可能考名词解释)2.Theory of Asset Demand(必考,死活都得背下来)Holding all other factors constant:1.The quantity demanded of an asset is positively related to wealth2.The quantity demanded of an asset is positively related to its expected returnrelative to alternative assets3.The quantity demanded of an asset is negatively related to the risk of its returnsrelative to alternative assets4.The quantity demanded of an asset is positively related to its liquidity relative toalternative assets3.Supply and Demand for Bonds(见到看⼀下图)Market Equilibrium4.Shifts in the Demand for BondsWealth: in an expansion with growing wealth, the demand curve for bonds shifts to the rightExpected Returns: higher expected interest rates in the future lower the expected return for long-term bonds, shifting the demand curve to the leftExpected Inflation: an increase in the expected rate of inflations lowers the expected return for bonds, causing the demand curve to shift to the leftRisk: an increase in the riskiness of bonds causes the demand curve to shift to the left Liquidity: increased liquidity of bonds results in the demand curve shifting right 5.Shifts in the Supply of BondsExpected profitability of investment opportunities: in an expansion, the supply curve shifts to the rightExpected inflation: an increase in expected inflation shifts the supply curve for bonds to the rightGovernment budget: increased budget deficits shift the supply curve to the right6.The Liquidity Preference Framework(重中之重)7.Demand for Money in the Liquidity Preference FrameworkAs the interest rate increases:–The opportunity cost of holding money increases…–The relative expected return of money decreases……and therefore the quantity demanded of money decreases.8.Shifts in the Demand for Money(都很重要)Income Effect:a higher level of income causes the demand for money at each interest rate to increase and the demand curve to shift to the rightPrice-Level Effect: a rise in the price level causes the demand for money at each interest rate to increase and the demand curve to shift to the rightLiquidity preference framework leads to the conclusion that an increase in the money supply will lower interest rates: the liquidity effect.Income effect finds interest rates rising because increasing the money supply is an expansionary influence on the economy (the demand curve shifts to the right). Chapter9:Banking1.The Bank Balance SheetLiabilities–Checkable deposits–Nontransaction deposits–Borrowings–Bank capitalAssets–Reserves(准备⾦)–Cash items in process of collection–Deposits at other banks–Securities–Loans–Other assets2.Basic Banking:Cash Deposit:Opening of a checking account leads to an increase in the bank’s reserves equal to the increase in checkable depositsCheck Deposit3.Inter-businessBank settlementFinance leaseFiduciary businessSafe deposit box4.Off-Balance-Sheet ActivitiesLoan sales (secondary loan participation)Generation of fee income. Examples:Chapter12:Central Banks and the Federal Reserve System(此章省略很多)1.Structure of the Fed(了解即可)12 FRBs(9⼈)Member BanksFOMC (7+1+4⼈)Federal Advisory Council (12⼈)2.Federal Reserve Bank(3+3+3⼈)Functions:Clear checksIssue new currencyWithdraw damaged currency from circulationAdminister and make discount loans to banks in their districtsEvaluate proposed mergers and applications for banks to expand their activitiesAct as liaisons between the business community and the Federal Reserve SystemExamine bank holding companies and state-chartered member banksCollect data on local business conditionsUse staffs of professional economists to research topics related to the conduct of monetary policyChapter13&14:The Money Supply Process:1.Players in the Money Supply ProcessCentral bank (Federal Reserve System)Banks (depository institutions; financial intermediaries)Depositors (individuals and institutions)2.Fed’s Balance Sheet4.Open Market PurchaseThe effect of an open market purchase on reserves depends on whether the seller of the bonds keeps the proceeds from the sale in currency or in depositsThe effect of an open market purchase on the monetary base always increases the monetary base by the amount of the purchaseOpen Market SaleReduces the monetary base by the amount of the saleReserves remain unchangedThe effect of open market operations on the monetary base is much more certain than the effect on reserves5.Fed’s Ability to Control the Monetary BaseSplit the monetary base into two components :MBn= MB - BRthe non-borrowed monetary base :MBnborrowed reserves:BR6.The Formula for Multiple Deposit Creation(很重要!必考,记住公式)7.Factors that Determine the Money SupplyChanges in the nonborrowed monetary base MBnChanges in borrowed reserves from the FedChanges in the required reserves ratioChanges in currency holdingsChanges in excess reserves8.The Money Multiplier(重点)Assume that the desired holdings of currency C and excess reserves ER grow proportionally with checkable deposits D. Then,c = {C/D} = currency ratioe = {ER/D} = excess reserves ratioThe monetary base MB equals currency (C) plus reserves (R):MB = C + R = C + (r x D) + ERM=m*MB=m*(MBn+BR)M=1+c/r+e+cChapter 15:Tools of Monetary Policy1. Tools of Monetary PolicyOpen market operationsChanges in borrowed reservesChanges in reserve requirementsFederal funds rate: the interest rate on overnight loans of reserves from one bank to another 2.Demand in the Market for ReservesSupply in the Market for Reserves3.Affecting the Federal Funds Rate4.Open Market Operations(超级重点)Advantages:The Fed has complete control over the volumeFlexible and preciseEasily reversedQuickly implemented5.Discount Policy(超级重点)Advantages:Used to perform role of lender of last resortdisadvantages:Cannot be controlled by the Fed; the decision maker is the bank6.Reserve Requirements(超级重点)Advantages:No longer binding for most banksdisadvantages:Can cause liquidity problemsIncreases uncertainty for banks7.Monetary Policy Tools of the European Central BankOpen market operationsLending to banksReserve RequirementsChapter16:The Conduct of Monetary Policy: Strategy and Tactics1. Goals of Monetary Policy(1)The Price Stability GoalLow and stable inflationInflationNominal anchor to contain inflation expectationsTime-inconsistency problem(2)Other Goals of Monetary PolicyHigh employmentEconomic growthStability of financial marketsInterest-rate stabilityForeign exchange market stability2.Monetary TargetingAdvantages–Almost immediate signals help fix inflation expectations and produce less inflation –Almost immediate accountability Disadvantages–Must be a strong and reliable relationship between the goal variable and the targeted monetary aggregat e3.Inflation TargetingPublic announcement of medium-term numerical target for inflationInstitutional commitment to price stability as the primary, long-run goal of monetary policy and a commitment to achieve the inflation goalInformation-inclusive approach in which many variables are used in making decisions AdvantagesDoes not rely on one variable to achieve targetEasily understoodReduces potential of falling in time-inconsistency trapStresses transparency and accountabilityDisadvantagesDelayed signalingToo much rigidityPotential for increased output fluctuationsLow economic growth during disinflation4.Monetary Policy with an Implicit Nominal AnchorThere is no explicit nominal anchor in the form of an overriding concern for the Fed.Forward looking behavior and periodic “preemptive strikes”The goal is to prevent inflation from getting started.Advantages–Uses many sources of information–Avoids time-inconsistency problemDisadvantages–Lack of transparency and accountability–Strong dependence on the preferences, skills, and trustworthiness of individuals in charge–Inconsistent with democratic principles5.Tactics: Choosing the Policy InstrumentTools–Open market operation–Reserve requirements–Discount ratePolicy instrument (operating instrument)–Reserve aggregates–Interest rates–May be linked to an intermediate targetInterest-rate and aggregate targets are incompatible (must chose one or the other).6.Linkages Between Central Bank Tools, Policy Instruments, Intermediate Targets, and Goals of Monetary Policy(中间⽬标是超级重点,死活都要背下来)Chapter19:The Demand for Money1.Velocity of Money and The Equation ofExchangeV=P*Y/MM*V=P*Y2.Quantity Theory of Money DemandSO: Demand for money is determined by:The level of transactions generated by the level of nominal income PYThe institutions in the economy that affect the way people conduct transactions and thus determine velocity and hence k 3.Keynes’s Liquidity Preference TheoryTransactions motivePrecautionary motiveSpeculative motiveVelocity is not constant:4.Friedman’s Modern Quantity Theory of Money(记住该公式及其含义)5.Differences between Keynes’s and Friedman’s Model (cont’d)Friedman–Includes alternative assets to money–Viewed money and goods as substitutes–The expected return on money is not constant; however, r b – r m does stay constant as interest rates rise–Interest rates have little effect on the demand for moneyFriedman (cont’d)–The demand for money is stable–velocity is predictable–Money is the primary determinant of aggregate spendingChapter23:Transmission Mechanisms of Monetary Policy: The Evidence1.Framework(1)Structural Modelwhether one variable affects anotherTransmission mechanism–The change in the money supply affects interest rates–Interest rates affect investment spending–Investment spending is a component of aggregate spending (output) Advantages and Disadvantages(2)Reduced-FormAnalyzes the effect of changes in money supply on aggregate output (spending) to see if there is a high correlation Advantages and Disadvantages2.Transmission Mechanisms of Monetary Policy(1)Asset Price EffectsTraditional interest rate effectsExchange rate effects on net exports...(2)Credit ViewChapter24:Money and Inflation1.meaning of inflation(死活背下来)extremely high for a sustained period of time, its rate of money supply growth is also extremely highMoney Growth–High money growth produces high inflationFiscal Policy–Persistent high inflation cannot be driven by fiscal policy aloneSupply Shocks–Supply-side phenomena cannot be the source of persistent high inflation ?Conclusion: always a monetary phenomenon 2.Origins of Inflationary Monetary PolicyCost-push inflation–Cannot occur without monetary authorities pursuing an accommodating policy ?Demand-pull inflationBudget deficits–Can be the source only if the deficit is persistent and is financed by creating money rather than by issuing bondsTwo underlying reasons–Adherence of policymakers to a high employment target–Presence of persistent government budget deficits3.The Discretionary (Activist)/ Nondiscretionary (Nonactivist) Policy Debate(1)Advocates of discretionary policy:regard the self-correcting mechanism as slowPolicy lags slow activist policy(2)Advocates of nondiscretionary policy:believe government should not get involvedDiscretionary policy produces volatility in both the price level and output。
CHAPTER 5MEASURING AND EVALUATING BANK PERFORMANCEGoal of This Chapter: To help the reader learn how to analyze and evaluate a bank's performance, especially its rate of return, efficiency, and risk exposure, from the data provided in bank financial statements.Key Terms Presented in This ChapterBank Profitability Equity MultiplierROA Credit RiskROE Liquidity RiskEfficiency Market RiskNet Interest Margin Interest-Rate RiskNoninterest Margin Earnings RiskNet Profit Margin Solvency RiskAsset Utilization UBPRChapter OutlineI. Introduction: Performance Pressures Faced by Banks TodayII. Evaluating a Bank's PerformanceA. Determining the Bank's Long-Range ObjectivesB. Maximizing The Value of the Firm: A Key Objective for Any BankC. Profitability Ratios: A Surrogate for Stock Values1. Key Profitability Ratios in Banking2. Interpreting Profitability Ratios3. Useful Profitability Formulas4. Breaking Down Equity Returns for Closer Analysis5. Break-Down Analysis of a Bank's Return on Assets6. What a Breakdown of Bank Profitability Measures Can Tell UsD. Measuring Risk in Banking1. Credit Risk2. Liquidity Risk3. Market Risk4. Interest-Rate Risk5. Earnings Risk6. Solvency (or Default) Risk7. Other Forms of Risk in Banking (Inflation Risk, Currency orExchange-Rate Risk, Political Risk, and Crime Risk)E. Other Goals in BankingIII. The Impact of Bank Size on PerformanceIV. Watching out for Size, Location and Regulatory Bias in Analyzing Bank Performance V. Using Financial Ratios and Other Analytical Tools to Track Bank Performance--The UBPR.VI. Summary of the ChapterAppendix to the Chapter - Improving Bank Performance Through Knowledge: Sources of Information for Bankers, Their Customers, and Bank RegulatorsConcept Checks5-1. Why should banks be concerned about their level of profitability and exposure to risk? Banks in the U.S. and most other countries are private businesses that must attract capital from the public to fund their operations. If profits are inadequate or if risk is excessive, they will have greater difficulty in obtaining capital and their funding costs will grow, eroding profitability. Bank stockholders, depositors, and bank examiners representing the regulatory community are all interested in the quality of bank performance. The stockholders are primarily concerned with profitability as a key factor in determining their total return from holding bank stock, while depositors (especially large corporate depositors) and examiners typically focus on bank risk exposure.5-2. What individuals or groups are likely to be interested in these aspects or dimensions of bank performance?The individuals or groups likely to be interested in bank profitability and risk include other banks lending to a particular bank, borrowers, large depositors, holders of long-term debt capital issued by banks, bank stockholders, and the regulatory community.5-3. What factors influence a bank's stock price?A bank's stock price is affected by all those factors affecting its profitability and risk exposure, particularly its rate of return on equity capital and risk to shareholder earnings. A bank can raise its stock price by creating an expectation in the minds of investors of greater earnings in the future, by lowering the bank's perceived risk exposure, or by a combination of increases in expected earnings and reduced risk.5-4. Suppose that a bank is expected to pay an annual dividend of $4 per share on its stock in the current period and dividends are expected to grow 5 percent a year every year, and the minimum required return to equity capital based on the bank's perceived level of risk is 10 percent. Can you estimate the current value of the bank's stock?In this constant dividend growth rate problem the current value of the bank's stock would be: P o = D1 / (k – g) = $4 / (0.10 – 0.05) = $80.5-5. What is return on equity capital and what aspect of bank performance is it supposed to measure?Return on equity capital is the ratio of Net Income After Taxes/Total Equity Capital. It represents the rate of return earned on the funds invested in the bank by its stockholders.5-6. Suppose a bank reports that its net after-tax income for the current year is $51 million, its assets total $1,444 million, and its liabilities amount to 926 million. What is its return on equity capital?The bank's return on equity capital should be:ROE = Net After Tax Income = $51 million = .098 or 9.8 percentEquity Capital $1,444 mill.-$926 mill.5-7. What is return on assets and why is it important in banking?Return on assets is the ratio of Net Income After Taxes/Total Assets. The rate of return secured on a bank's total assets indicates the efficiency of its management in generating net income from all of the resources (assets) committed to the institution.5-8. A bank estimates that its total revenues from all sources will amount to $155 million and its total expenses (including taxes) will equal $107 million this year. Its liabilities total $4,960 million while its equity capital amounts to $52 million. What is the bank's return on assets? Is this ROA high or low? How could you find out?The bank's return on assets would be:ROA = Net After Tax Income = $155 mill. - $107 mill. = 0.0096 or 0.96 percent Total Assets $4,960 mill. + $52 mill.The size of this bank's ROA should be compared with the ROA's of other banks similar in size and location to determine if this bank's ROA is high or low relative to the average forcomparable banks.5-9. Why do bankers pay close attention today to the net interest margin and noninterest margin? To the earnings base and spread?The net interest margin (NIM) indicates how successful the bank has been in borrowing funds from the cheapest sources and in maintaining an adequate spread between its returns on loans and security investments and the cost of its borrowed funds. If the NIM rises, loan and security income must be rising or the average cost of funds must be falling or both. A declining NIM is undesirable because the bank's interest spread is being squeezed, usually because of rising interest costs on deposits and other borrowings.In contrast, the noninterest margin reflects the bank's spread between its noninterest income (such as service fees on deposits) and its noninterest expenses (especially salaries and wages and overhead expenses). For most banks the noninterest margin is negative. Management will usually attempt to expand fee income, while controlling closely the growth of noninterest expenses in order to make a negative noninterest margin as least negative as possible.The earnings base indicates the proportion of the bank's earning assets (loans, leases, and investments) relative to its total assets. As competition increases, greater pressure is placed on the bank's management to maintain the quality and quantity of these earning assets. Additionally, the bank's managers typically will shift some of their emphasis to increasing noninterest income generated by fees.The earnings spread measures the effectiveness of the bank's intermediation function of borrowing and lending money, which, of course, is the bank's primary way of generating earnings. As competition increases, the spread between the average yields on assets and the average cost of liabilities will be squeezed, forcing the bank's management to search for alternative sources of income, such as fees from various services the bank offers.5-10. Suppose a banker tells you that his bank in the year just completed had total interest expenses on all borrowings of $12 million and noninterest expense of $5 million, while interest income from earning assets totaled $16 million and noninterest revenues added to a total of $2 million. Suppose further that assets amounted to $480 million of which earning assets represented 65 percent of total assets, while total interest-bearing liabilities amounted to 55 percent of the bank's total assets. See if you can determine this bank's net interest and noninterest margins and its earnings base and earnings spread for the most recent year.The bank's net interest and noninterest margins must be:Net Interest = $16 mill. - $12 mill. Noninterest = $2 mill. - $5 mill.Margin $480 mill. Margin $480 mill.=.00833 = -.00625 The bank's earnings spread and earnings base are:Earnings = $16 mill. - $12 mill.Spread $480 mill * 0.85 $480 mill. * 0.75= .0392 -.0333Earnings Base = $480 mill. - $480 mill. * 0.15 = 0.85 or 85 percent$480 mill.5-11. What are the principal components of ROE and what do each of these components measure?The principal components of ROE are:a. The net profit margin or net after-tax income to operating revenues which reflects theeffectiveness of a bank's expense control program;b. The degree of asset utilization or ratio of operating revenues to total assets which measures the effectiveness of managing the bank's assets, especially the loan portfolio; and,c. The equity multiplier or ratio of total assets to total equity capital which measures a bank's use of leverage in funding its operations.5-12. If a bank has an ROA of 0.80 percent and an equity multiplier of 12x what is its ROE? Suppose this bank's ROA falls to 0.60 percent. What size equity multiplier must it have to hold its ROE unchanged?The bank's ROE is:ROE = 0.80 percent *12 = 9.60 percent.If ROA falls to 0.60 percent, the bank's ROE and equity multiplier can be determined from:ROE = 9.60% = 0.60 percent * Equity MultiplierEquity Multiplier = 9.60 percent = 16x.0.60 percent5-13. Suppose a bank reports net income after taxes of $12, before-tax net income of $15,operating revenues of $100, assets of $600, and $50 in equity capital. What is the bank's ROE? Tax-management efficiency indicator? Expense control efficiency indicator? Asset management efficiency indicator? Funds management efficiency indicator?The bank's ROE must be:ROE = 50$12$ = 0.24 or 24 percentIts tax-management, expense control, asset management, and funds management efficiencyindicators are:Tax Management = $12 Expense Control = $15Efficiency indicator $15 Efficiency Indicator $100= .8 or 80 percent =.15 or 15 percentAsset Management = $100 Funds Management = $600Efficiency Indicator $600 Efficiency Indicator $50= 0.1666 or 16.67 percent = 12 x5-14. What are the most important components of ROA and what aspects of bank performance do they reflect?The principal components of ROA are:a. Total Interest Income Less Total Interest Expense divided by Total Assets, measuring a bank's success at intermediating funds between borrowers and lenders;b. Provision for Loan Losses divided by Total Assets which measures management's ability to control loan losses and manage a bank's tax exposure;c. Noninterest Income less Noninterest Expenses divided by Total Assets, which indicates the ability of management to control salaries and wages and other noninterest costs and generate tee income;d. Net Income Before Taxes divided by Total Assets, which measures operating efficiency and expense control; ande. Applicable Taxes divided by Total Assets, which is an index of tax management effectiveness.5-15. If a bank has a net interest margin of 2.50%, a noninterest margin of -1.85%, and a ratio of provision for loan losses, taxes, security gains, and extraordinary items of -0.47%, what is its ROA?The bank's ROA must be:ROA = 2.50 percent - 1.85 percent - 0.47 percent = 0.18 percent5-16. To what different kinds of risk are banks subjected today?a. Earnings Risk -- the probability that a bank's earnings (net income) will fall, subjecting its stockholders to actual losses or to lower rates of return.b. Credit Risk -- the probability that loans and securities the bank holds will not pay out as promised.c. Solvency Risk -- the possibility or probability the bank will fail.d. Liquidity Risk -- the probability the bank will not have sufficient cash on hand in the volume needed precisely when cash demands arise.e. Market Risk -- the probability that the value of assets held by the bank will decline due to falling market prices.f. Interest-Rate Risk - the possibility or probability interest rates will change, subjecting the bankto losses.5-17. What items on a bank's balance sheet and income statement can be used to measure it's risk exposure?There are several alternative measures of risk in banking. Solvency risk is often measured by bank capital ratios, such as the ratio of total capital to total assets or total capital to risk assets. Creditrisk can be tracked by such ratios as net loan losses to total loans or relative to total capital. Liquidity risk can be followed by using such ratios as cash assets to total assets or by total loans to total assets. Interest-rate risk may be indicated by such ratios as interest-sensitive liabilities to interest-sensitive assets or the ratio of money-market borrowings to money-market assets.5-18. A bank reports that the total amount of its net loans and leases outstanding is $936 million,its assets total $1,342 million, its equity capital amounts to $110 million, and it holds $1,150 million in deposits, all expressed in book value. The estimated market values of the bank's total assets and equity capital are $1,443 million and $130 million, respectively. The bank's stock is currently valued at $60 per share with annual per-share earnings of $2.50. Uninsured deposits amount to $243 million and money market borrowings total $ 1 32 million, while nonperforming loans currently amount to $43 million, and the bank just charged off $21 million in loans. Calculate as many of the bank's risk measures as you can from the foregoing data.Net Loans and Leases = $936 mill. Uninsured Deposits $243 mill.mill.0.7069 or 70.69 percent 0.2113 or 21.13 percentEquity Capital = $130 mill. Stock Price $60Total Assets $1,443 mill. Earnings Per Share $2.50 = 0.0901 or 9.01 percent = 24 XNonperforming Assets = $43 mill. =0.0459 or 4.59 percentNet Loans and Leases $1,443 mill.Charge-offs of loans = $21 Purchased Funds = $243 mill. + $132 mill. Total Loans and Leases $936 Total Liabilities $1,324 mill. - $110 mill.=.0224 or 2.24 percent .3089 or 30.89 percentBook Value of Assets = $1324 =0.9175 or 91.75 percentMarket Value of Assets $1443Problems5-1. First National Bank of Inesco is expected to pay a dividend of $12 per share at the end of the year and its stock dividends are expected to grow 8 percent a year indefinitely into the future. If the appropriate discount rate applied to the bank's expected dividend stream is 15 percent,Inesco's current stock price should be:P o = D (k g)1- = $12(.15.08)- = $171.43 per share.5-2.Price State Bank's expected stream of dividends over the next three years is as follows: Expected Dividends Per SharePeriod 1 $3.00Period 2 $4.50Period 3 $6.00Applying a discount rate of 12 percent to this dividend stream yields an estimated stockprice ofP o = $3(1.12)+ + $4.50(1.12)2+ + $6(1.12)3+ + $60(1.12)3+P 0 = $53.24 per share.5.3 Depositors and Merchants Bank has an equity-to-asset ratio of 7.5 percent which means its equity multiplier must be:1/(Equity Capital / Assets) = Assets EquityCapital = 1 / 0.075 = 13.33xIn contrast, Newton National Bank has an equity multiplier of:1/(Equity Capital / Assets) = 10.06= 16.67xWith an ROA of 0.85 percent Newton National would have an ROE of:ROE = 0.85 x 16.67x = 14.17 percent.In this case Newton National Bank is making greater use of financial leverage and is generating a higher return on equity capital.Depositors and Merchants has an ROE of:ROE = 0.85 x 13.33 x = 11.33 percent.5-4. The income and expense statement for Gilcrest Merchants National Bank, when arranged in proper order, would appear as follows:Gilcrest Merchants National Bank Income and Expense StatementInterest Fees on Loans $61Interest Dividends on Securities 12Total Interest Income 73Interest Paid on Deposits 49Interest on Nondeposit Borrowings 6Total Interest Expense 55Net Interest Income 18Provision for Loan Losses 2Noninterest Income and Fees 7Noninterest Expenses:Salaries and Employee Benefits 10Overhead Expenses 5Other Noninterest Expenses3Total Noninterest Expenses 18Net Income Before Taxes and SecurityGains or Losses 5Taxes 1Securities Gains (or Losses), Net ofTaxes1Net Income After Taxes $5Among the key ratios that can be calculated are the following:ROE = Net Income After Taxes = $5 =0.0180 or 1.80 percentEquity Capital $80ROA = Net Income After Taxes = $5 =0.005 or .5 percentTotal Assets $1000Net Interest Margin = Total Interest Income–Total Interest Expenses[($61 + $12) –($49 + $6)]=0.0180 or 1.8percent Total Assets $1000Net Noninterest = $7 - $18 =-0.011 or –1.1 percentMargin $1000Net operating margin = [Total Operating Revenues – Total Operating Expenses] /Total Assets = 1000$73$80$ = 0.0070 or 0.70 percent.Earnings = Total Interest Income - Total Interest Expenses = $61 + $12 - $49 + $6 Spread Total Earning Assets Total Interest Bearing $830 $710 Liabilities0.0880 – 0.0775 or 8.8 percent – 7.75 percent or 1.05 percentEarnings base = Total Assets – Nonearning Assets = $830 =0.83 or 83 percent in assets Total Assets $1000Profit Margin =Net income after taxes Total operating revenue = $5$80 = 0.0625 or 6.25 percent. Asset Utilization =Total operating revenue Total Assets = $80$1000 = $80$1000 = 0.08 or 8.0 percent Equity Multiplier =Total Assets Total Equity Capital = 12.5x Net Loans / Total Assets = 1000$670$ = 0.67 or 67 percentCash and Due from Bank = $120 = 0.12 or 12 percent Total Assets $1000Operating Efficiency Ratio = Total Operating Expenes Total Operating Revenues = $73$80 = 0.9125 or 91.25 percentEmployee Productivity = Net Operating Income = $80 - $73 = $175,000Ratio # of Full Time Employees $40 per employee5-5. The rates of return requested for Shadowwood National Bank are as follows:ROE = $105 ROA = $105$15,765 - $15,440 $15,7650.3231 or 32.31 percent 0.0067 or .67 percentNet Interest = $1875 - $1210 = $665 = 0.0527 or 5.27 percentMargin $12,612 $12,612(If total assets are used as the denominator, NIM = 4.22%.)Net Noninterest Margin =$501$685$12,612= 0.0146 or –1.46 percent.(If total assets are used as the denominator, the noninterest margin is –1.17%).Net Operating = ($1,875+- $501) – ($1,210 + $685 + $381) = $100 =0.0063 or.63 percent Margin $15,765 $15,765Net Return Before = ($1,875 + $501) – ($1,210 + $685 + $381 + $16) = $84 = 0.0053 or .53 Special Transaction Costs $15,765 $15,765 .percentEarnings per Share = 000,145000,000,105$ = $724.14 per share.Alternative Scenario 1:Suppose interest income, interest expenses, noninterest income, and noninterest expenses each increase by 5 percent, with all other items remaining unchanged.If we assume that the 5% increase flows through to net income, resulting in a 5% increase in net income, then the ROE, ROA, and EPS will increase by (at least) 5% also. Actually, the scenario which does not have provision for loan losses, securities gains, and taxes increasing would result in a greater than 5% increase in net income. This would, of course, result in the ROE, ROA, and EPS increases being greater than 5%.Alternative Scenario 2:Suppose Shadowood's interest income, interest expenses, noninterest income, and noninterest expenses decline by 5 percent, all other factors held equal. As with scenario 1, if we assume the decrease flows through to net income, then net income will decrease by 5%. This decrease will result in ROE, ROA, and EPS actually being greater than 5% as a result of the other items, such as provision for loan losses, taxes, and securities gains, not changing. Base Problem Alternative Scenario 1 AlternativeScenario 2Interest Income $1875 $1968.75 $1781.25 Interest Expense 1210 1270.50 1149.50 Net Interest Income $ 665 $ 698.25 $ 631.75Provision for Loan Losses $ 381 $ 381 $ 381Noninterest Income $ 501 $ 526.05 $ 475.95 Noninterest Expense 685 719.25 650.75 Net Noninterest Income ($184) ($193.20) ($174.8)Net Income Before Taxes $ 100 $ 124.05 $ 75.95 Income Taxes $ 16 $ 16 $ 16 Securities Gaines (orLosses)21 21 21 Net Income After Taxes $ 105 $ 129.05 $ 80.95Common SharesOutstanding145,000 145,000 145,000Base Problem AlternativeScenario 1AlternativeScenario 2a. ROE 32.31% 39.71% 24.91%b. ROA 0.67 0.82% 0.51%c. NIM (1) 5.27% 5.54% 5.01%NIM (2) 4.22% 4.43% 4.01%d. EPS $724.14 $890.00 $558.28e. NNIM (1) -1.46% -1.53% -1.39%NNIM (2) -1.17% -1.23% -1.11%f. NOM 0.63% 0.79% 0.48%g. Net Returns BeforeSpecial Transactions0.53% 0.69% 0.38%Notes: All figures except Common Shares in millions.Equity Capital = Total Assets - Total Liabilities = $ 15,765 - $15,440= $ 325 (millions) Total Assets =$15,765 millionsEarning Assets = $12,612 millionsNIM(1) uses Earning Assets in the denominator; NIM(2) uses Total AssetsNNIM(1) uses Earning Assets in the denominator; NNIM(2) uses Total Assets5-6. Selected balance sheet and income statement data for Farmers and Merchants National Bank are given as follows:Given: ROA = 0.0076 (i.e., 0.76%)Total Assets = $1.69 billion ($1,690 million)Equity Capital = $139 millionSolution:ROE = ROA * Total AssetsEquity Capital = 0.0076 * $1,690$139= 0.0924 or 9.24%Alternative Scenario 1:R0A increases by 50%, with no change in assets or equity capital.Therefore, the new ROA = 0.0076 * 1.5 = 0.0114 or 1.14%.New ROE = 1.14% * 12.16 = 13.86%This represents a 50% increase in ROE. With no changes in assets or equity, the investors' funds are more effectively utilized, generating additional income and making the bank more profitable. Alternative Scenario 2:ROA decreases by 50%, with no change in equity or assets.Therefore, the new ROA = 0.0076 * 0.5 = 0.0038 or 0.38%.New ROE = 0.38% * 12.16 = 4.62%This represents a 50% decrease in ROE. The bank's management has been less efficient, in this case, in managing their lending and/or investing functions or their operating costs.Alternative Scenario 3:ROA = 0.0076 or 0.76% (as in the original problem)Total assets double in size to $3.38 billion and equity capital doubles in size to $278 million. Therefore, the equity multiplier (i.e. total assets/equity capital) remains the same (E.M. =$3,380/$278 = 12.16). As a result, there is no change in ROE from the original situation (i.e., 0.76% * 12.16 = 9.24%).Alternative Scenario 4:This, of course, is just the reverse of scenario 3. Since the changes in both assets and equity capital are the same, the ratio of the two (i.e., the equity multiplier) remains constant. As a result, there is again no change in ROE.E.M. = Total Assets/Equity Capital = $845/$69.5 = 12.16.Therefore, ROE = 0.76% * 12.16 = 9.24%.5-7. Granite Dells State Bank reports the following information:Given:Total Operating Revenues = $135 millionTotal Operating Expenses = $121 millionTax Liability = $2 millionTotal Assets = $1.17 billionTotal Liabilities = $989 millionSolution:Net Income after Taxes = $135 million -$121 million -$2 million = $12 millionEquity Capital = $1.17 billion - $989 million = $181 million= $12 million / $181 million = 0.0663 or 6.63%.ROE = Net Income after TaxesEquity CapitalAlternative Scenario 1:Given: Total operating revenues, total operating expenses, and taxes each grow by 10%, but assets and liabilities remain fixed.Solution:Total revenues = $135 million * 1.10 = $148.5 millionTotal expenses = $121 million * 1.10 = $133.1 millionTax liability = $2 million * 1.10 = $2.2 millionNet Income after Taxes = $148.5 - $133.1 - $2.2 = $13.2 millionROE = $13.2 million/$181 million = 0.0729 or 7.29%= 10% (ROE increases by 10%)Change in ROE = 7.29% 6.63%6.63%Alternative Scenario 2:Given: Total assets increase by 10% (Total assets = $ 1.17 * 1.10 = $1.287 billion)Total liabilities increase by 10% (Total liabilities = $989 million * 1.10 =1.0879Revenues and expenses (including taxes) remain unchanged.Solution: Equity Capital = $1.287 billion - $1.0879 billion = $199.1 million= 0.063 or 6.03%ROE = $12 million$199.1 millionTherefore change in ROE = 6.03% - 6.63% = -0.6% = -9%6.63% 6.63% (ROE decreases by 9%)Alternative Scenario 3:Given: Total revenues decline by 10% (Total revenues = $135 million * 0.90 = $121.5 million) Total expenses decline by 10% (Total expenses = $121 million * 0.9 = $108.9 million)Tax liability declines by 10% (Tax liability = $2 * 0.9 = $1.8 million)Assets and liabilities remain unchanged (Therefore, equity remains unchanged)Solution: Net Income after Tax = $121.5 million - 108.9 million - $1.8 million = $10.8 ROE = $10.8 million = 0.0597 = 5.97%$181 millionTherefore, change in ROE = 5.97% - 6.63% = -0.66% = -10% (ROE decreases by 10%)6.63% 6.63%Alternative Scenario 4:Given: Assets and liabilities decrease by 10%; therefore,Equity capital decreases by 10%,Operating revenues, operating expenses, and taxes remain unchanged.Solution: Total assets = $1.17 billion * 0.9 = $1.053 billionTotal liabilities = $989 million * 0.9 =$890.1 millionEquity capital = $1.053 billion - $890.1 million = $162.9 million= 0.0737 or 7.37%ROE = $12 million$162.9 million5-8. Suppose a bank is projected to achieve a 1.25 percent ROA during the coming year. What must its ratio of total assets to total equity capital be if it is to achieve a 12-percent ROE goal? Given: ROA = 1.25% and target ROE = 12%Solution: ROE = ROA * (Total Assets/Equity Capital)Total Assets = ROE = 12% = 9.6 xEquity Capital ROA 1.25%If ROA unexpectedly falls to 0.75% and target ROE remains 12%:Solution:12% = .75% * Total AssetsEquity CapitalTotal Assets = 12% =16 xEquity Capital .75%Alternative Scenario 1:Given: ROA = 1.5% and target ROE = 12%Solution: Total Assets = 12% = 8xEquity Capital 1.5%Alternative Scenario 2:Given: Bank's ROA unexpectedly declines to 0.75%Solution: Total Assets = 12% = 16 x (The same as part 2 of original problem) Total Equity .75%5-9. The following information is given for Blythe County National Bank:Net Income after Taxes = $16 millionTotal Operating Revenues = $215 millionTotal Assets = $1,250 millionTotal Equity Capital Accounts = $111 millionSolve for the bank's net profit margin, asset utilization ration, equity multiplier, and ROE. Solutions:a. Net Profit Margin = Income After Taxes = $16 mill. = 0.0744 or 7.44%Total Operating Revenue $215 mill.b. Asset Utilization = Total Operating Revenues = $215 mill. = 0.172 or 17.2%Total Assets $1250 mill.c. Equity Multiplier = Total Assets = $1250 mill. = 11.26 timesTotal Equity Capital $111 mill.d. ROE = Net Income After Taxes = $16 mill. = 0.1441 or 14.41%Total Equity Capital $111 mill.Alternative Scenario:Given: Total Liabilities = $1,475 million。
Concentration MeasurementBackground:It’s very important to be able to measure the concentration of various substances in a solution. If we use a certain amount of a solution in a reaction, we would really like to know the number of molecules we used, not just the volume we poured in. If we made the solution ourselves, and did it carefully, then we know the concentration, but if we use a solution that someone else made… we have to trust them, or measure it ourselves. If we use a solution that has been sitting around for a long time… the concentration MIGHT still be what is marked on the label, but it might also have changed, if reactions have occurred in the interim.Measuring the concentration of a solution is tricky, since there are no “concentration meters.” We must calculate the concentration from other measurements.We can often measure the concentration of a solution by comparing the properties of the solution to other solutions, where we know the concentrations.•If the solute absorbs visible light, a concentrated solution will have a deeper coloration than a more dilute solution. Two solutions of the same compound that absorb the same amount of light have the same concentration.•Some compounds break into ions (positively and negatively charged bits) in water. A solution of that compound will conduct electricity. The conductivity of the solution will depend upon the number of movable ions. Two solutions of the same compound that conduct equally well have the same concentration.I will give you detailed directions for Part 1 of this lab, but you are going to generate your own procedures for Part 2.Part 1: Finding Concentration using a Colorimeter (Absorbance) Probe: Preparing the solutionsMake five standard NiCl2 solutions. Nickel chloride crystals have water moleculestrapped within them. The mass of water must be considered, or the moles of nickelchloride will be incorrect. The symbol NiCl2•6H2O means that there are six watermolecules for every nickel chloride, so the molecular mass should include those eighteen atoms. You will need to perform the appropriate calculations before you come to class. If you have not done the calculations you will be unable to start the experiment. Check your work with your lab partner.Prepare 50.0 ml of a 0.260M solution of NiCl2• 6H2O.How many grams of the solid do you need to mass out?From that solution (solution 1) prepare 50.0 ml of a 0.200M solution.What volume of solution 1 do you need to use, to make solution 2?You will still have some leftover 0.260M solution for the tests.Put the extra into a test tube labeled #1.From solution 2, prepare 50.0 ml of a 0.160M solution.What volume of solution 2 do you need to use, to make solution 3?You will still have some leftover 0.200M solution for the tests.Put the extra into a test tube labeled #2.From solution 3, prepare 50.0 ml of a 0.120M solution.What volume of solution 3 do you need to use, to make solution 4?You will still have some leftover 0.160M solution for the tests.Put the extra into a test tube labeled #3.From solution 4, prepare 50.0 ml of a 0.100M solution.What volume of solution 4 do you need to use, to make solution 5?You will still have some leftover 0.120M solution for the tests.Put the extra into a test tube labeled #4.Put solution 5 into a test tube labeled #5. (If there is extra, leave it in the flask.) Preparing the Absorbance samples:Fill a cuvette (small container used in the colorimeter device) with each solution. Keep them in order, and put numbered lids on the cuvettes.The cuvettes each contain about 4 ml of liquid.Carefully, blot dry the outside of each cuvette. Try not to scratch the surfaces. Do not touch the smooth sides with your hands.Recording Absorbance data:The colorimeter is used to measure how much light of a given wavelength is absorbed by a sample. If the sample is more concentrated, it absorbs more light. As long as ALL ofthe light is not absorbed, the relationship can be determined. For NiCl2 we will set thecolorimeter to 635nm (red light, well absorbed by the green solution). Before putting any samples in the colorimeter, use the left & right arrows to select 635nm, put a cuvette filled with water into the compartment (see below for directions), and then push CAL to calibrate the device. If you are using one of the older colorimeters I will show you how to calibrate it during lab.To insert a cuvette, hold it by the ridged sides, not the clear sides, and insert it into the square well underneath the cover. The clear sides should be pointing front and back, the ridged sides, left and right. Close the cover.Using the “events with entry” mode on the LabQuest, measure the absorbance of each solution. The “value” to enter is the concentration of the solution. Inspect the data. If there is a definite pattern your solutions were well made. Record your data.Using a sixth cuvette, filled with the solution of unknown concentration, measure its absorbance. Comparing the absorbance measured with the graph you will plot, determine the concentration of the unknown solution.-----------------------------------------------------------------------------------------------------------It’s pretty cool that we can use the colorimeter to find the concentrations of solutions that are colored. But, if a solution is NOT colored, the colorimeter will not be helpful. Fortunately there are other devices that we can use.Part 2: Finding Concentration using a Conductivity Probe:You will need to come up with your own procedures for this part.We would like to find the concentration of salt in seawater. However, since we don’t want to deal with plankton and that sort of thing, we’re going to use a sample of water from a salt-water aquarium instead. As mentioned above, we want to make comparisons to solutions of known concentrations. We have plenty of solid NaCl in our lab. Consider Part 1 of this lab as you plan your Part 2 experiments. What calculations will you need to do?Our conductivity meter will not measure accurately for NaCl solutions with a concentration greater than 0.200M.What do you want to do first?What decisions do you need to make before moving on?How will you know if your data is meaningful?Comparing the conductivity measured with the graph you will plot, determine the concentration of the unknown solution.Recording conductivity data:The conductivity probe is used to measure how conductive the solution is.Select the 0 –20,000 µS setting on the probe box.To measure conductivity, the probe simply needs to be placed in a test tube containing the solution. The opening at the bottom must be fully immersed.Using the “events with entry” mode on the LabQuest, measure the conductivity of all solutions (of known and unknown concentration). Rinse and dry the conductivity probe before each measurement. Record your data.Analysis (and later discussion.)Plot a graph (in your lab notebook) of the absorbance data. It should be at least one-half page in size. What is your independent variable (x-axis)? What is your dependent variable (y-axis)? The scales you use for each variable should be evenly spaced, although your data points will not be. The origin of your graph should be (0,0). Do not offset your graph. Draw a “best-fit” line or curve (as appropriate) to your data.Plot a graph of the conductivity data. Consider the graphing tips above.unknown?What was the concentration of the NiCl2What was the concentration of salt in seawater?Analysis should include a discussion of the sources of systematic error in the experiments.How do these two methods compare? Which method was easier? Which method was more accurate? Which method was more interesting?When do scientists use each of these methods? Do you ever use these methods yourself? (Albeit without the devices) Make lab-to-world connections.Write a clear conclusion paragraph, detailing (but not repeating the entire analysis) what was learned from these experiments.。
Finance Research Letters 5(2008)59–67/locate/frlOn measuring concentration in banking systemsCarlos Alegria a ,∗,Klaus Schaeck ba Winton Capital Management,Oxford Science Park,Oxford,OX44GA,UKb Cass Business School,Faculty of Finance,106Bunhill Row,London,EC1Y 8TZ,UK Received 12June 2007;accepted 10December 2007Available online 15December 2007AbstractAssuming a Pareto-type distribution of bank sizes,we investigate the effect of changes in Zipf’s ex-ponent (α)and the sample size on the behavior of different concentration indices,such as the 3-bank concentration ratio,the Herfindahl–Hirschman index and the top 5%-concentration ratio.We derive analyt-ical relations between these concentration indices and investigate the elasticity of these indices to changes in αand in the sample size N .We show different regimes under which each index can be used most ap-propriately.Our results are highly relevant for policymakers who rely on such concentration measures to derive public policy recommendations in banking.©2008Elsevier Inc.All rights reserved.JEL classification:C49;D31;G21;L16Keywords:Zipf’s law;Concentration indices;Banking1.IntroductionDeregulation,liberalization,and consolidation in the banking industry,reflected by increasing cross-border mergers and growing M&A activity within national boundaries,have increasingly prompted concerns about greater market power enjoyed by banks and the subsequent impact upon financial stability (Mishkin,1999;De Nicolóet al.,2004).It is therefore critical to assess the implications of these developments on bank market structure to draw appropriate policy inferences.Moreover,commonly used concentration mea-*Corresponding author.E-mail addresses:alegria_carlos@ (C.Alegria),klaus.schaeck.1@ (K.Schaeck).1544-6123/$–see front matter ©2008Elsevier Inc.All rights reserved.doi:10.1016/j.frl.2007.12.00160 C.Alegria,K.Schaeck/Finance Research Letters5(2008)59–67sures such as the k-bank concentration ratio1and the Herfindahl–Hirschman index(HHI) are extensively used as a proxy for competition in models explaining banking sector per-formance as a function of market structure(De Nicolóet al.,2004;Barth et al.,2004; Beck et al.,2006).In some countries,such as in the U.S.,these concentration measures play a pertinent role in the enforcement of anti-trust laws(Bikker,2004).In sum,precise measures of concentration are crucial for welfare-related public policy making in the banking industry.This letter compares and contrasts alternative measures of concentration,Zipf’sα,and the top5%concentration ratio(k5%)with the more widely used3-bank concentration ratio(k3)and the Herfindahl–Hirschman index(HHI).We also discuss the regimes in which the application of these indices is appropriate in order to draw better inferences for public policy in banking. To this end,we evaluate the sensitivity of our measures to different sample sizes and different bank size distributions,since the number of banks varies considerably across banking systems. Finally,we present an empirical illustration of the proposed measures using bank data obtained for15countries.2.Zipf’s lawAn increasing body of literature shows that the distribution offirm sizes in terms of total assets,sales,income,and employees2follows Pareto’s law where the rank offirm R i and its size Z i are related byZ i=const·R−αi.(1) When the exponentα=1then Eq.(1)is known as Zipf’s law.This empirical relationship is well established in explaining the distribution of city sizes(Axtell,2001;Gabaix,1999)and country sizes(Rose,2006).On thefirm level,Ramsden and Kiss-Haypál(2000),Okuyama et al.(1999),and Stanley et al.(1995)have shown thatfirm sizes in terms of assets,income,and sales respectively also have power law tails with differentαin different industrial sectors.This literature argues that the degree of deviation from a normal distribution and the exponentαare thought to be related to the degree of interaction(competition,cooperation,or collusion)of the firms within each sector.Thus,observing changes in this exponent may provide useful insights into market structure and competition in an industry.The Zipf exponentαcan be obtained by using Zipf’s plot where the log-rank is plotted against the log of bank size.To compute Zipf’s exponentα,we use a log-transformation of(1) log(R i)=const−αlog(Z i)(2) so that the slope of the regression line isα;obtained by regressing the tails of the distribu-tion using OLS.As a consequence,we refer toαhenceforth as slope coefficient,or simply as Zipf’sα.3The cut-off point is arbitrary but usually one selects values above the10%point of the distribution,this is:R i/N>0.1.The higherα,the lower the dispersion of extreme bank sizes, suggesting higher bank concentration in the system.The inverse applies for lower values ofα.1The k-bank concentration ratio is the general way of referring to the ratio of the assets(deposits)held by a certain number of banks to total assets(deposits)in the banking system.Most studies assume k=3and we therefore refer to this measure subsequently as3-bank concentration ratio,see also Beck et al.(2006).2Okuyama et al.(1999)argue that these quantities give all consistent results when analyzing company statistics.3See Gabaix(1999),Axtell(2001),Okuyama et al.(1999),and Rose(2006)for further details on Zipf’s law and estimation ofαusing OLS.C.Alegria,K.Schaeck /Finance Research Letters 5(2008)59–67613.Concentration measuresIn light of the above mentioned recent developments,there is a need to investigate comparative measures of bank concentration and how they perform under different regimes of Zipf’s law.We next turn to the definition and discussion of three concentration indices.3.1.3-bank concentration ratio (k 3)The three bank concentration measure is simply the ratio between the assets of the 3largest banks within a country divided by the total assets in the banking system at a given point in time.It is a very popular measure of concentration in the banking literature (Bikker,2004)and the predominant concentration measure used in applied work (e.g.Bikker and Haaf,2002;Bikker,2004;Beck et al.,2006).If we define Z i as the size of bank i and Z T the total size of the banking system,4then k 3is given by(3)k 3= 3i =1Z i Z T.It should be noted that k 3is an absolute measure of concentration with an arbitrary cut-off point (Bikker,2004).This gives rise to obvious problems if we are comparing k 3values for samples with different sizes.For instance,if we are comparing two samples with the same distribution (same α),one with 100banks and another with 1000banks,then even though both samples should have the same concentration index,k 3will differ substantially.3.2.Hirschman–Herfindahl index (HHI)The HHI is the sum of the squared bank market shares.It is another benchmark measure of bank concentration and gives more weight to larger banks.Contrary to the k 3and k 5%measures,the HHI extends to all banks in the system,thereby avoiding arbitrary cut-offs.The HHI plays a statutory role in the U.S.for the approval of bank mergers,where the post-merger market HHI must not exceed 0.18,and the change in the index should be less than 0.02(Cetorelli,1999).The HHI is defined as(4)HHI =N i =1Z i Z T 2.3.3.Top 5%concentration ratio (k 5%)We now introduce the top 5%concentration measure,which we calculate as the ratio between the assets of the top 5%of largest banks divided by the total assets in the banking system at a given point in time.We are not aware of any previous application of this concentration measure in the literature and define the top k 5%concentration ratio as (5)k 5%= a i =1Z i Z T,where a =Round (0.05·N).4Note that the total size of the banking system is given by Z T = N i =1Z i.62 C.Alegria,K.Schaeck /Finance Research Letters 5(2008)59–67The usage of k 5%overcomes the difficulties associated with the k 3ratio as it is a relative measure of concentration.For the previous example,it would give similar values for both samples by measuring the weight of the 5largest banks and 50largest banks (for sample sizes 100and 1000,respectively).4.Relationship between concentration indicesWe assume that the distribution of bank sizes within a given country follows Zipf’s law (1).To compare the behavior of different measures of concentration when banks sizes follow such a distribution,it is useful to find a relation between each of the concentration measures and Zipf’s α.By introducing the Riemann Zeta function,5we can write k 3,k 5%and HHI as a function of αusing simple derivations:k 3=ξ(α,3)ξ(α,N);k 5%=ξ(α,a)ξ(α,N),where a =Round (0.05·N);(6)HHI =ξ(2α,N)ξ2(α,N).5.Sensitivity analysisIn a recent paper,Naldi (2003)analyzes the sensitivity of different concentration measures relative to α.He argues that measuring elasticities of such concentration indices relative to the distribution parameter αis critical for understanding the regime in which we operate in.In our paper,we extend Naldi’s work by analyzing elasticities of the different concentration measures to both αand the sample size N .First,we are interested in a concentration index that has constant elasticity to αso that it consistently reflects changes in the underlying distribution.Second,an ideal measure would also have zero elasticity to changes in the sample size so that it is consistent across different samples.6A low elasticity to changes in the sample size is desirable because regulators often compare concentration levels across different banking markets to draw inference for the degree of competition.7If the sensitivity of concentration measures to changes in the number of banks and the parameter αis not sufficiently taken into account,the inferences for policymaking about restricting or encouraging competition may well be misleading.In this section,we therefore analyze the sensitivity of the concentration indices to Zipf’s α,and the number of banks,N ,in the system.5.1.Different slope (α)regimesTo compare the robustness of the different concentration indices for different regimes of α,we build on the work by Naldi (2003)and calculate the elasticity αfor each concentration measures.If C denotes a given concentration index then the elasticity is defined by(7)χα=αC ∂C dα.5Riemann’s Zeta function is defined as ξ(α,N)= N i =1i −α(Naldi,2003).6In contrast,under certain circumstances,it is important to have a high sensitivity in order to resolve two slightly different distribution parameters.Naldi (2003)provides additional details of an example where a high sensitivity of the concentration measure is desirable.7See,for instance,Beck et al.(2006).C.Alegria,K.Schaeck /Finance Research Letters 5(2008)59–6763Fig.1.Elasticity of concentration indices as a function of α.Elasticity of the different concentration indices (k 3,k 5%and HHI)as a function of Zipf’s slope coefficient,αfor different sample sizes.Panel A:Sample size of 100banks.Panel B:Sample size of 500banks.Using Eqs.(6)and (7)and Riemann’s Zeta function ξ(α,N),we can easily obtain analytical expressions for each of the concentration indices 8:(8)χα(k 3)=α ξ (α,3)ξ(α,3)−ξ (α,N)ξ(α,N) ,(9)χα(k 5%)=α ξ (α,a)ξ(α,a)−ξ (α,N)ξ(α,N) ,(10)χα(HHI )=α ξ (2α,N)ξ(2α,N)−2ξ (α,N)ξ(α,N).Fig.1plots the elasticity of the different concentration indices as a function of αfor banking systems with N =100and N =500institutions.It shows that the most elastic index to changes in bank size distribution is the HHI.Its value (peaking at around α=1)is significantly higher than the elasticity of the k 3and k 5%.Fig.1also shows that for high values of α>2,both the k 3and k 5%indices have low sensitivities to αand the HHI is preferable.Our results demonstrate that the HHI is most suitable when one needs to distinguish between small differences in the bank size distribution when it follows a Pareto law as in Eq.(1).However,it is less adequate when one needs to compare sample concentration measures that have differing values of α.For this effect,we would need an index that has a constant elasticity for changes in α,so that the different samples can be compared.k 3has a sensitivity that falls between the k 5%and HHI.9By comparing Fig.1,Panels A and B,we also observe that the elasticity of HHI and k 3to αincreases substantially for the larger sample size,while the k 5%does not exhibit much 8The derivative of Riemann’s Zeta function is given by ξ (α,N)= N i =1−log (i)·i −α.9Our findings also have important implications for empirical studies in banking where concentration ratios are com-pared across different countries without taking the sensitivities of the respective concentration measures into account as in Beck et al.(2006).64 C.Alegria,K.Schaeck /Finance Research Letters 5(2008)59–67variation.Thus,k 5%is also less sensitive to the sample size and therefore is best suited to compare concentrations of samples with different sizes.It should be noted however that for small sample sizes,N <50,the k 5%index does not yield meaningful results and the HHI or k 3measures are preferable.5.2.Different sample sizes (N)To compare the robustness of the different concentration indices for different sizes,we calcu-late the elasticity χ(N)for each index.For the calculation of elasticity we use the logarithm of sample size,N log such that:(11)χN =N log C ∂C dN log .To compare the concentration indices of samples with different sizes,we require an index that has zero elasticity to changes in N .Fig.2shows the elasticity of the different concentration indices as a function of sample size,N ,for systems with different Zipf exponents (α=0.3and α=1).10The results show that the most sensitive index to changes in the sample size is HHI for α=0.3(α<−2.5for N >50).They also underscore that for low values of α(between 0and 0.5),the k 5%has an elasticity close to zero,even though it has a discrete behavior.11For values of α=1we observe that k 3is the index with lower elasticity and would probably be preferred as a summary measure of concentration.Alternatively,one could also use the k 10%for small samples,which avoids some of the problems associated with k 5%.For values of α<1,the HHI seems to be the least appropriate index as it shows the greatest sensitivity to sample size.6.Empirical illustrationWe present in this section an empirical illustration by comparing bank asset size distributions (given by Zipf’s α)in 15industrialized countries.This example is relevant to empirical compar-isons of concentration indices for banks across countries,where apart from different distributions,the samples exhibit varying numbers of banks.We obtain bank data from BankScope.This database has been widely used for cross-country studies in the banking literature as it covers approximately 90%of the banking sector assets in most counties.12We retrieve data for all commercial,savings,and co-operative banks for the period 1998–2005for Austria,Belgium,Brazil,France,Germany,Hong Kong SAR,Italy,Japan,Luxembourg,Spain,Sweden,Switzerland,the Netherlands,the UK,and the USA.10Recall that Zipf’s law suggests that α=1.We also analyze α=0.3because the bank size distributions in our empirical example in Section 6have values of αranging from 0.3to 1.This is also supported by empirical evidence from Rose (2006)who shows that Zipf’s exponents for city sizes range from α=0.9to α=2,while α=0.3to α=0.4for the distribution of country sizes.11The discrete behavior of k 5%is due to the definition of the index as being the ratio of the size of the 5%largest companies to size of the total system.As the 5%largest companies is given by a =Round (0.05·N),it will have a discrete behavior,sometimes overstating the actual 5%point of the distribution and sometimes understating it.The smaller the sample size,the larger the error.Hence,this measure can be unreliable for small samples (i.e.small number of banks in the banking system).12BankScope provides harmonized data templates that permit cross-country comparisons.For additional details on BankScope see Claessens et al.(2001).C.Alegria,K.Schaeck/Finance Research Letters5(2008)59–6765Fig.2.Elasticity of concentration indices as a function of N.Elasticity of the different concentration indices(k3,k5% and HHI)as a function of sample size,N for different values ofα.Panel A:For Zipf’s exponent,α=1.Panel B:For α=0.3.Table1Empirical illustrationCountryα(se)R2N k5%k3HHI Spain0.50(0.01)0.986720.390.370.069 USA0.69(0.01)0.9323170.550.200.029 Hong Kong0.30(0.02)0.854830.800.770.257 Brazil0.63(0.03)0.8341320.560.320.060 Austria0.40(0.01)0.9371610.670.500.115 Luxembourg 1.09(0.05)0.892990.300.220.040 Italy0.50(0.00)0.9964020.590.270.049 Belgium0.27(0.02)0.796720.850.740.244 The Netherlands0.32(0.01)0.944600.490.470.112 Germany0.31(0.00)0.94914780.820.230.034 Japan0.41(0.00)0.9596760.710.260.037 Sweden0.49(0.02)0.941880.580.490.113 Switzerland0.34(0.01)0.9353580.830.680.268 United Kingdom0.35(0.01)0.9253380.720.270.046 France0.35(0.01)0.8943840.750.290.046 Notes.The table reports estimated Zipf slope coefficients,α,with their respective standard errors(se)and regression R2 values.We perform OLS of log of rank on log of bank assets;intersect included,but not reported;N refers to the average number of banks in the country.Concentration indices k5%,k3and HHI are also shown.Table1shows the Zipf slope coefficients,α,obtained using OLS regression,13respective R2 values and the number of banks within each country.Concentration indices k5%,k3and HHI are also shown.The values ofαwere obtained using the distribution of bank assets from199813For further information on how to calculateα,see Gabaix(1999),Axtell(2001),Okuyama et al.(1999),and Rose (2006).66 C.Alegria,K.Schaeck/Finance Research Letters5(2008)59–67to2005in order to increase the sample size.N represents the average number of banks in the system per year during the sample period.Two important points emerge from Table1:First,Zipf’sαhas a wide range of values from 0.27to1.09.Second,the number of banks also varies widely ranging from60to1478(even tough 1478is a particular case because the German banking system has an unusually large number of banks).Our brief illustration underscores that the different indices tend to vary widely in terms of possible values and range.These results highlight the difficulties associated with relying on HHI and the3-bank concen-tration ratio when drawing policy inferences.14Our empirical illustration illustrates that k5%,k3 and HHI are in disagreement about the most concentrated(and hence least competitive)banking market.While the k5%ratio indicates that Belgium has the most concentrated banking system, the k3ratio suggests that the banking system in Hong Kong is the most concentrated system; based on the HHI,Swiss banks operate in the most concentrated market.These divergences could be explained by the highly negative elasticity of HHI to the sample size compared with a lower negative elasticity of k3with N and positive elasticity of k5%with N.Both Belgium and Hong Kong have small sample sizes(N equals72and83,respectively)while Switzerland has 358banks.Therefore,the high HHI values for Hong Kong and Belgium are related to the small sample sizes and not to changes in the distribution.As a result,to compare the concentration of the countries’banking systems for such a diverse range ofαand N,we need to choose the concentration index appropriately.The most suitable index of the three indices examined in Section3would be the k5%due to its lower sensitivity to αand N in the respective ranges.7.Concluding remarksWe present an analysis of the sensitivity of different measures of concentration to different distribution specifications and sample sizes for the banking industry.Under the assumptions of a Pareto-type distribution of bank sizes,we compare the sensitivity of k3,k5%and HHI measures of concentration under different regimes.Our results indicate that the relative concentration index(k5%)is more adequate for compar-ing concentration of samples withα<1and large sample sizes(N>50).However,for small sample sizes,N<50,the k5%index is inadequate and the HHI or k3measures are preferable. Of these two,the k3bank concentration ratio is least sensitive to both changes inαand N.The analyzes highlight that policymakers in banking should take such parameters into account when comparing concentration measures across different banking markets.We illustrate ourfindings with an empirical example by analyzing the distribution of bank sizes in a cross-country setting.For our sample,with values of0.25<α<1.1and sample sizes ranging from N=60to N=1478per country,we conclude that the most robust concentration index is k5%.However for other types of distributions and sample sizes,this may not be the case. Clearly,for these cases,adequate measures of concentration should be selected.Therefore,the choice of the concentration index and the purpose for which it is used should be carefully inves-tigated before using these indices to draw inferences about the relation between concentration and other economic factors such as the degree of competition in banking.14See also Bikker(2004)for a comparison of different concentration indices based on the Dutch mortgage market.C.Alegria,K.Schaeck/Finance Research Letters5(2008)59–6767 AcknowledgmentsWe thank Masaki Yamada,Martin Cihak and Simon Wolfe for valuable comments and sug-gestions.ReferencesAxtell,R.L.,2001.Zipf distribution of U.S.firm sizes.Science293,1818–1820.Barth,J.R.,Caprio Jr.,G.,Levine,R.,2004.Bank regulation and supervision:What works best?Journal of Financial Intermediation13,205–248.Beck,T.,Demirgüç-Kunt,A.,Levine,R.,2006.Bank concentration,competition,and crises:First results.Journal of Banking and Finance30,1581–1603.Bikker,J.A.,petition and Efficiency in a Unified European Banking Market.Edward Elgar,Cheltenham. Bikker,J.A.,Haaf,K.,petition,concentration and their relationship:An empirical analysis of the banking industry.Journal of Banking and Finance26,2191–2214.Cetorelli,N.,petitive Analysis in Banking:Appraisal of the Methodologies.Economic Perspectives,vol.23.Federal Reserve Bank of Chicago,pp.2–15.Claessens,S.,Demirgüç-Kunt,A.,Huizinga,H.,2001.How does foreign entry affect domestic banking markets?Journal of Banking and Finance25,891–911.De Nicoló,G.,Bartholomew,P.,Zaman,J.,Zephirin,M.,2004.Bank consolidation,internationalization,and conglom-erization:Trends and implications forfinancial risk.Financial Markets,Institutions and Instruments13,173–217. Gabaix,X.,1999.Zipf’s law and the growth of cities.American Economic Review89,129–132.Mishkin,F.S.,1999.Financial consolidation:Dangers and opportunities.Journal of Banking and Finance23,675–691. Naldi,M.,2003.Concentration indices and Zipf’s law.Economics Letters78,329–334.Okuyama,K.,Takayasu,M.,Takayasu,H.,1999.Zipf’s law in income distribution of companies.Physica A269,125–131.Ramsden,J.J.,Kiss-Haypál,G.,pany size distribution in different countries.Physica A277,220–227. Rose,A.K.,2006.Cities and countries.Journal of Money,Credit,and Banking38,2225–2245.Stanley,M.H.R.,Buldyrev,S.V.,Havlin,S.,Mantegna,R.N.,Salinger,M.A.,Stanley,H.E.,1995.Zipf plots and the size distribution offirms.Economics Letters49,453–457.。