2010年B题数学建模优秀论文
- 格式:pdf
- 大小:577.33 KB
- 文档页数:18
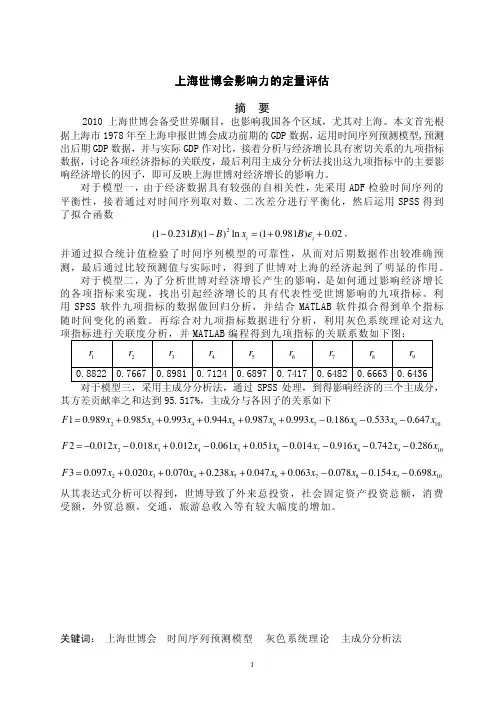
2010年上海世博会影响力的定量评估摘要上海世博会的举办对中国乃至世界的快速发展都产生了深远的影响。
本文着眼于上海世博会促进旅游业这一侧面,提出并解决三个重要的问题。
一:上海世博会对上海入境人数的贡献旅游业发展具有趋势性、周期性、随机性,根据这一规律建立入境人数本底趋势模型,使用内插法处理过的2007年7月至2010年3月数据拟合出本底趋势线,进而求出2010年4、5、6、7月的本底值,与实际人数相比得到世博会对入境人数平均贡献率为22.41%。
二:未来几个月上海入境人数走势利用第一问模型得出08-11月世博会给上海带来544815人的额外入境人数。
三:世博会给上海带来的直接利益通过对已知的世博会入园人数进行分析,建立每天入园人数的时间序列分析模型,由于人员的变动性,故采用时间序列分解法求解。
运用趋势外推法加权拟合出长期趋势直线,综合考虑影响参观人数的随机因素,预测出上海世博会最终入园人数为7010.82万人。
门票总收入达103.88亿元。
关键字:本底趋势线内插法定量评估时间序列分析模型趋势外推法一、问题重述题目背景:2010年上海世博会是首次在中国举办的世界博览会。
从1851年伦敦的“万国工业博览会”开始,世博会正日益成为各国人民交流历史文化、展示科技成果、体现合作精神、展望未来发展等的重要舞台。
请你们选择感兴趣的某个侧面,建立数学模型,利用互联网数据,定量评估2010年上海世博会的影响力。
问题提出:上海世博会促进旅游业这一侧面,提出了三个重要的问题。
问题一:上海世博会期间,上海的入境人数有什么变化,给出相应的数学模型,并计算世博会对入境人数的平均贡献率。
问题二:未来几个月上海入境人数走势。
问题三:从互联网获取每天入园参观人数,建立每天的参观人数的预测模型,并预测最终入园人数并估算世博会的门票总收入。
二、符号约定三、模型假设1、忽略国家政策、军事、节假日等方面对上海入境人数的影响。
2、将世博会期间的天气情况影响限制在一定波动范围内。
Team#8254page1of16 Play your best hit:The mystery in baseball batMCM Contest Question ATeam#8254February22,2010Contents1Introduction (2)1.1Problem Restatement (2)1.2What is the sweet spot on earth? (2)1.3How to cork a bat? (2)1.4The material of baseball bat matters? (2)2Assumption (3)3A Simplified Model (3)3.1Model Description (3)3.2Finding the”sweet spot” (5)4An Augmented Model (6)4.1Model Description (6)4.2Why no corked bats and metal bats? (8)4.2.1Qualitative Analysis (8)4.2.2Quantitative Analysis (9)5Sensitivity (12)6Conclusion (13)6.1Strength (13)6.2Weakness (13)6.3Recommendation (13)7References (13)8Appendix (14)Team#8254page2of16 1Introduction1.1Problem RestatementEvery experienced hitter knows that there is a spot on the baseball bat that when hitting with this spot,the hand of the hitter feels no pain and the ball can be hit farther.This is the”sweet spot”.According to the theory of torque,this spot should be at the end of the bat,but the experience of the hitters proves it wrong.The location of”sweet spot”on a given baseball bat is approximately 6-1/2”from the end of the bat[1].Our purpose is to establish a model to give a scientific explanation.In addition,some players believe that drilling a cylinder in the end of the bat andfilling it with cork or rubber,namely,to cork the bat [2],enhances the”sweet spot”effect.We would like to found our model and use it to interpret it.What’s more,the question that whether the material of bats matters is also a part discussed in this paper.1.2What is the sweet spot on earth?There are many definitions of”sweet spot”[3].Here in this paper,we define it as the location where maximum energy is transferred to the ball.1.3How to cork a bat?”Corking”is to drill a1inch diameter hole6inches longitudinally into the bat’s barrel end.The structure of the real bat and the corked bat can be showed in Fig1.In our augmented model,we will analyze the effect of corking.1.4The material of baseball bat matters?Compared to the wood bats,aluminum bats is not easily be broke,and as the aluminum bats are hollow,the thickness of the shell can be manipulated so that the center of mass may be more closer to the handle,and consequently reducing the perceived weight while swinging.In this way,it increases the mobility of(a)Normal baseball bat(b)Corked baseball batFig1:Normal baseball bat and corked batTeam#8254page3of16 the hitter.What’s more,using aluminum bat can largely improve the energy of the ejecting ball,which may be too hard to catch or even dangerous for players. All those features lead to the prohibition of the using of aluminum bat[4].We will explain it in details later in this paper.Fig2:Cross section of aluminum bat2AssumptionAs the hitting process is too complex,we make the following assumptions in order to simplify the problems and establish our models:1.The better hitting effect means a larger exit speed of the ball and a shorteracceleration time of the bat.2.When the hitter swings,hitter-bat system rotates around a vertical axis that”penetrates”the hitter.3.The collision of the ball and the bat is one-dimensional.4.The hitter always hits the ball at the”sweet spot”.3A Simplified Model3.1Model DescriptionIn our simplified model,we omit the situations that the player might modify the baseball bat and concentrate on explaining why the”sweet spot”is not at the end of the bat but a few distances from the end.When you hit a ball,the bat vibrates in response.These vibrations travel in waves up and down the length of the bat.At one point,called”the node”, the waves always cancel each other out.If you hit the ball on the bat’s node, the vibrations from the impact will cancel out,and you won’t feel any stinging or shaking in your hand.Since little of the bat’s energy is lost to vibrations when this spot is hit,more can go to the ball[5].We will found a model based onTeam#8254page4of16 the characteristics showed as italics.In our model,we ignore the swing of the hitter’s arms when hit.We denote the spot where the hitter holds the bat as pivot, assuming that the pivot isfixed,and the bat is mounted on the pivot so that it can swing around the pivot freely.The parameters we use are given in the tabular Notation,and the force and motion diagram is showed in Fig3.NotationSymbols MeaningF ball the applied force in the collisionF px,F py the vertical and horizontal component forces of the force in the pivotcm the center of mass of the batp the impact pointpivot the spot where the hitter holds the batI pivot the moment of inertia of the bat with respect to pivotL x−y the distances between x and yαthe rotation angular acceleration of the batm bat the mass of the batL sum the whole length of the batFig3:The force and motion diagram of the batNext,we will analyze the model above with the knowledge of kinetics in order tofind the”sweet spot”.Team #8254page 5of 163.2Finding the ”sweet spot”According to the theorem of moment of momentum we have:F ball ·L pivot =I pivot ·α(1)and based on the theorem of motion of center of mass:∑F =ma c we have:F ball +F px =m bat ·L pivot −cm ·α(2)Therefore,with equation (1)and (2)we have:F hand =F ball m bat ·L pivot −cm ·L pivot −p I pivot−1 Thus we know that the horizontal component force is 0whenL pivot −p =I pivotm bat L pivot −cmIn other words,when the distance between the pivot and the p is I pivot m bat ·L pivot −cm ,the p is the sweet spot.In order to find the specific location of the ”sweet spot”on a certain bat,we quote the data from [6]and choose a C243wooden bat,thus we get the parame-ters L pivot −cm =0.42m ,I pivot =0.208kg ·m 2,L knob −pivot =0.15m ,m bat =0.905kg ,L sum =0.86m .Then we calculate L pivot −p =0.55m ,so that L knob −p =0.70m .From the re-sult we can obviously see that the ”sweet spot”is about 0.16m far from the end of the fat part of the bat.The forces on different location of the bat can be showed in Fig4.Fig 4:The rotation system in a hitting processIn this way,we have successfully demonstrated that the experience of the hitters is right.Team#8254page6of16 4An Augmented Model4.1Model DescriptionThe previous model fails to take the situation that some hitter may modify the bat into account.What’s more,in real baseball game it is impossible that the arms of the hitter are stationary when hit.So we augmented ourfirst model. In this augmented model,we assume that the hitter and the bat form a rotation system in which the hitter stays vertical and the bat stays horizontal.The hitting process can thus be modeled as:the system gets a torque T generated by the hitter and rotates around the axis which vertically”penetrates”the hitter and then hits a ball.After hitting process,the ball ejects out with a velocity of v f. The distance between the impact spot and the axis is r.The process is described in Fig5.Fig5:The rotation system in a hitting processWe notice that the ball gets maximum velocity after hitting means the effect of hitting is optimal,so we should focus on the exit speed of the ball.Two processes are displayed as follows:Process1:The hitter swings the bat and accelerates the bat to an angular velocity ofω.Process2:After the imperfect inelastic collision of bat and ball,the ball ejects out with a velocity of v f.In process1,the moment of inertia of bat and the air resistance will hamper the rotation of the system of hitter-bat.It is easy to calculate the liner velocity of any spot on the bat by the kinematics formula v=ωr,and according to the formulas given by Keith Koenig in reference[7],we know that the angular ve-Team#8254page7of16 locity and the linear velocity of the impact spot on the bat before the collision in process1are:ω=TK Dtanhcosh−1expK DI hitter+I batθv bat=rω(3) where•r is the rotation radius,equals the length from the impact spot to the axis.•T is the torque applied to the hitter-bat system which is generated by the hitter.•K D is an aerodynamic parameter,which is given byK D=12ρC D DL44(for more please read reference[7])•tanh is hyperbolic tangent function.•cosh−1is anti-hyperbolic cosine function.•exp is exponential function.•θis the angle that the bat rotates.•I hitter is the hitter’s moment of inertia with respect to the axis.•I bat is the bat’s moment of inertia with respect to the axis.In our case,we treat T,K D,I hitter,θas constant parameters while r and I bat are the only variables.In process2,we assume that the bat and ball have an one-dimensional col-lision and they both have some extent of deformation.The deformation trans-forms a small part of the kinetic energy(about25%,reference[8])into potential energy stored in bat and ball,while most part(about75%)of it dismisses due to the friction and the oscillation of the bat.And referring to reference[7]we havev f=COR−r M1+r Mv ball+COR+11+r Mv bat(4)where•COR is the coefficient of restitution,it will be discussed in the next part.•v ball is the velocity of the ball right before the collision with the bat.Team #8254page 8of 16•v bat is the velocity of the bat right before the collision with the bat.by equation (3)and (4),we getv f =COR −r M 1+r M v ball +COR +11+r M r T K D tanh cosh −1 exp K D I hitter +I batθ (5)The parameters:COR ,I bat ,r M are explained in Appendix .4.2Why no corked bats and metal bats?In order to reveal the influence of each parameter on the velocity of the ball thus to figure out the effect of the corking behavior and predict different be-havior for wood and metal bats,we make some analysis about the application procedure of our augmented model.4.2.1Qualitative AnalysisWe assume that the velocity of the ball is constant before the collision with the bat,and the impact spots are on the same position of the bat,namely,r is a constant.The corking has two aspects of influences:one is the decrease of mass,the other is the deviation of the center of mass.1.Corked bat•The influence on v fDue to the lower density of material corked in the barrel,the whole mass of bat inclines and the center of mass moves to the rotation axis a little.On one hand,it will cause the decrease of I bat as I bat = r 2dm ,and according to the expression of v f :v f =COR −r M 1+r M v ball +COR +11+r M r T K D tanh cosh −1 exp K D I hitter +I batθ we know that the value of r T K D tanh cosh −1 exp K D I hitter +I batθ will increase.On the other hand,as we haver M =m ball (z −z p )2I cm +m bat L 2pivot −cmTeam#8254page9of16 we know that if m bat decreases and the center of mass deviates toknob,I cm and L pivot−cm will both decline,and that will make r M in-crease and lead to the decline of both COR−r M1+r M v ball and COR+11+r M.How-ever,it is impossible for us to ensure whether the value of v f willincrease or decrease without specific data.We will explain it later inthe Quantitative Analysis section.•The influence onflexibilityWe regard the procedure that the hitter-bat system is accelerated fromstationary situation to rotating with an angular velocity ofωas auniformly accelerated motion procedure.By kinematic formulas weknow that the acceleration time is t=2θω,and from the expression ofωmentioned in page6,section4.1,we know that as the I bat decreasesdue to corking,the value ofωwill increase,so that the accelerationtime will be shorten and in this way theflexibility develops.2.Metal bats vs.wood batsUsing our augmented model we are able to analyze the behavior of bats that have different composition material.•The influence on v fMetal bats(usually aluminum bats)have trampoline effect due togood elasticity,so that it has larger COR than wood bats(usually ashbats).In addition,as the aluminum bats have less mass,the influenceof material is just like that in discussing corked bats.It is obvious thatin order tofind which kind of bat’s v f is larger we need the supportof data.•The influence onflexibilityThe aluminum bats are lighter than wood bats so that the influenceonflexibility is the same as corked bats.4.2.2Quantitative Analysis1.Data usingAs the qualitative analysis cannot show the exact differences between wood bats,corked wood bats(corked bats)and aluminum bats,we quote the data from reference[7][12][13][14]to verify our augmented model.Table1:Value of ConstantsTeam#8254page10of16Constants Valuem ball/(g)134.2v ball/(m/s)25(assumption)T316N·mK D/(N·m·s2)0.00544θ 2.36radr/(m)0.762R hitter−pivot/(m)0.305I hitter/(kg·m2)0.444Table2:Value of VariablesValues Wood bat Corked bat Aluminum batCOR0.500.500.58mass/(g)876834827I p/(kg·m2)0.2110.1950.17L cm−pivot/(cm)424039.5I bat/(kg·m2)0.5160.4760.446z−z p/(m)0.470.460.45r M0.14030.14540.1596 Using the data above we can calculate the three relative values of v f that are47.1m/s,47.6m/s and51.3m/s.The I bat is calculated based on parallel axis theorem.For a better compare of the hitting effects of the three bats,we use com-puter to make a hitting experiment simulation about theflying trajectories of the ball after hitting:Assuming that the ball dose a slanting parabolic motion and the launch angle of the ball after hitting with the bat isθ=30◦.Fig6shows the trajec-tories of balls that are hit by the three kinds of bats.2.The influence of three kinds of bats onflexibilityCombine the formula t=2θωwith the expression ofω,we have the expres-sion of the acceleration time t:t=2θTK Dtanhcosh−1expK DI hitter+I batθAfter using the values given in the table1and table2,we get:Kinds of bats t/(s)Wood Bats0.121Corked Bats0.118Aluminum Bats0.116Team#8254page11of16Fig6:The trajectories of the balls hit by the three kinds of bats It is easy to see that the acceleration time of corked bat is0.003s shorter than that of wood bat.During this time,the incoming ball moves0.075m farther,that is to say,theflying distance of the incoming ball from the ser-vice point to the collision point when using a corked bat is0.075m farther than that of wood bat,so that the hitter would feel more easy to deal with the incoming ball as he or she has more time to react and accelerate the bat when using a corked bat.In the same way we know that when usinga aluminum bat rather than a wood bat,the hitter has0.005s longer and0.125m farther to handle the bat.3.Summary of our analysisAt this point,we are able to answer the second and third questions about the corking behavior and the matters of different materials.•Why does Major League Baseball prohibit”corking”?From the analysis above we know that for a baseball bat used in ourmodel,if it is corked,the swinging velocity of bat right before hittingthe ball will increase0.5m/s and theflexibility of swinging can alsobe developed,as the mass of the bat decreases and the center of massof it deviates.•Why does Major League Baseball prohibit metal bats?According to our model,the hitting effect is closely linked with thematerials.We know from our qualitative verification that the hittingvelocity of using a aluminum bat is4.2m/s more than that of woodbat,and the deviation of the center of mass further gains0.005s reac-tion time for the hitter.As the ball hit by aluminum bat has a muchbigger velocity,it makes the catching of the ball difficult and evendangerous.Team#8254page12of16 5SensitivityAfter analyzing the application of our augmented model,wefind it neces-sary to analyze the sensitivity of our model,aiming at implementing it more effectively.We choose to research the exit speed of normal wood bat with differ-ent parameters.1.The influence of massThe change of mass will influence both r M and I bat,but as the value of them are too hard to obtain by direct calculating,we make some simplificationsbelow:r M=m ball (z−z p)2I p=m ball(z−z p)2I cm+m bat L2pivot−cmIn this expression,as I cm is very small(about0.04kg·m2),we treat it as a constant one.It is the same to z−z p(about0.47m)and L pivot−cm(about 0.42m).Hence,the value of r M only correlates to m bat,and we haver M=0.1340.4720.04+m bat×0.422then in I bat=I cm+m bat·L2hitter−cm,we also treat L hitter−cm(about0.725m) as a constant,so we haveI bat=0.04+m bat×0.7252Relating to equation(5),we denote COR=0.5and get:m bat(kg)0.830.850.870.89v f(m/s)46.846.7646.7146.672.The influence of materialThe major influence of different materials is they have different COR s.When the mass is constant,we have I bat=0.516kg·m2,and r M=0.1403, andfinally we get:COR0.40.450.50.550.6v f/(m/s)42.344.747.149.551.9From the results above,we can see that COR seems a more prominent influence.Team#8254page13of16 6Conclusion6.1StrengthFirst of all,this paper solves the problem of”sweet spot”,and we give an easy formula to calculate the position of”sweet spot”.Secondly,we analyze the hitting process and divide it into two stages,and discuss the factors that affect the exit speed in details while giving a formula that can describe this stage.Then we answer the questions through qualitative analysis and quantitative calculation.Finally,we make a analysis about the sensitivity and prove the rationality by comparing the results.6.2WeaknessFirst of all,as the real hitting process is too complex to analyze,we make several simplifications in order to facilitate the founding of model.In model 1,we just regard the bat as a pendulum rod with one endfixed,which is a little different from the real situation.And in model2,we simplify the complex process of hitting into two stages.Secondly,the data wefind are not precise,especially for the value of COR which we regard as constant.Additionally,the calculations in this paper are also simplified,thus the accu-racy of our results declines.6.3RecommendationThe biggest disadvantage of our model is lacking experiments,and if we have time and facilities to do some experiments,the result must be more reliable.For example,the equation(6)in Appendix can be used to measure COR,and in order to measure the value of I pivot,we could refer to[15]and use the method to obtain data.With this data we can verify our model in a better way.7References[1]/wiki/Sweet spot[2]/drussell/bats-new/corkedbat.html[3]/drussell/bats-new/sweetspot.html[4]/wiki/Aluminum Bats vs.Wood Bats[5]/baseball/sweetspot.htmlTeam#8254page14of16[6]/sysengr/slides/baseballBat.ppt[7]Keith Koenig,Nan Davis Mitchell,Thomas E.Hannigan,J.Keith Clutter.The influence of moment of inertia on baseball/softball bat swing speed.SportsEngineedng(2004)7,105-117.[8]Alan M.Nathana.Characterizing the performance of baseball bats.Am.J.Phys.,Vol.71,No.2,February2003134-143[9]/wiki/Coefficient of restitution[10]Lv ZhongjieHuang Fenglei.Coefficient of Restitution of a Circular PlateDuring Inelastic Collision.Transactions of Beijing Institute of Technology.Vol.28No.4.[11]P.J.Drane and J.A.Sherwood.Characterization of the effect of temperatureon baseball COR performance.[12]/sysengr/slides/baseballBat.ppt[13]/docs/621958/How-Does-a-Baseball-Bat-Work[14]/wiki/moment of inertia[15]/drussell/bats-new/bat-moi.html8AppendixParameters ExplanationIn expression(5),page8,section4.1,there are several parameters that will influence thefinal velocity of the ball:1.COR•What is COR?The coefficient of restitution(COR),or bounciness of an object is afractional value representing the ratio of velocities after and before animpact[9].Fig7:The one-dimensional collision processTeam #8254page 15of 16The coefficient of restitution is given byCOR =v 1f −v 2f v 1−v 2(6)where–v 1is the velocity of object 1before the collision.–v 2is the velocity of object 2before the collision.–v 1f is the velocity of object 1after the collision.–v 2f is the velocity of object 2after the collision.All the parameters above are scalars.In the ideal situations,we may have a so-called plastic collision when COR =0,namely the deformation of the material cannot re-store.And when COR =1,called perfectly elastic collision,is a situa-tion that the deformation can restore entirely.In general,the value of COR varies from (0,1).•What factors affect COR ?MaterialCOR represents the deformation recovery ability of the material.Gen-erally speaking,the more elastic the material is,the higher the value of COR will be.Impact velocityCOR decreases when the impact velocity increases.[10]The Temperature and Relative Humility of The EnvironmentCompared to the factors above,another two factors,the tempera-ture and relative humility have a relatively smaller influence.COR decreases when the temperature decreases and it decreases when the relative humility increases.[11]2.I bat•MOI (moment of inertia)[14]Moment of inertia is a measure of an object’s resistance to changes in its rotation rate.It is the rotational analog of mass,the inertia of a rigid rotating body with respect to its rotation.The moment of iner-tia plays much the same role in rotational dynamics as mass does in linear dynamics,determining the relationship between angular mo-mentum and angular velocity,torque and angular acceleration,and several other quantities.It is denoted asI = r 2dmwhere m is mass and r is the perpendicular distance to the axis of rotation.Team#8254page16of16•Parallel Axis TheoremI z=I cm+mL2where I cm is the moment of inertia of the rotor with respect to thecenter of mass,and the L is the distance from the center of mass toaxis z.•The factors affect MOIFigure:It influences the location of the center of mass,thereby affectsthe distance from the center of mass to rotation axis.Mass:Its increase is proportional to the increase of MOI.3.r MIn reference[8],Alan M.Nathan develops a formula relating v f to the initial speed of the ball v ball and the initial speed of the bat at the impact pointv bat as:r M=m ball (z−z p)2I pwhere•m ball and m bat are the ball and the bat’s mass respectively.•Z is the location of the impact point.•Z p is the location of the pivot point.•I p is the moment of inertia of the bat with respect to the pivot point. From the expression above we can see that reducing the mass of the bat m bat while keeping the other parameters constant will lead to a augment of r m.。
2010年上海世博会影响力的定量评估摘要本文根据题目要求,在合理的假设之下,主要从上海世博会对宏观经济影响力的角度,建立了相应的数学模型,定量评估了2010年上海世博会的影响力。
首先通过分析往届各国举办世博会后本国经济受到的影响及其影响因素,得到对上海世博会影响力的有效评价因素,然后定量评估世博会对经济领域的影响力。
模型一通过对世博会成本-收益分析以及投入产出情况分析,得出世博会对上海经济影响的大小与其投资量有关。
世博会运营期间的产出共计123.71亿元,运营期间的投入共计106.8亿元。
在边际成本内,投资量越大,影响越大,即在整个经济领域,产出大于其投资,获得较大的经济效益。
其次,在模型二、三中利用凯恩斯的乘数效应理论模型分析了上海世博会对上海GDP的直接拉动,得出整个筹办至会展期8年时间将预计使上海GDP增加4175.24亿元,平均每年增加521.91亿元,并导出投资模型,利用1980~2002年旅游业产业增加值和投资增量的统计数据,采用SPSS进行回归估计,得到上海世博会的投资对上海旅游业产业增加值的贡献为241.02亿元。
在模型四中,世博会的旅游消费拉动模型估计出旅游消费合计为805亿元,通过世博会期间的旅游消费拉动了上海市旅游业的发展。
同时还定量分析了2010年上海世博会对促进产业结构调整、拓展就业机会的影响力。
模型五通过图表分析法将往届世博会的筹办、运营、后续三个阶段对现代服务业的影响力进行分析,明确世博会的成功举办对其现代服务业有非常积极的影响力。
当然,世博会的影响力未必全是积极影响,因此,列举了上海世博会的举办可能带来的一些负面影响。
最后,模型六通过模糊综合评判分析,得出了世博会的举办在综合方面“影响力较有利”,即世博会在整体上带来的影响力是较为有利的。
关键词:成本-收益分析乘数效应理论模糊综合评判后世博效应一、问题的提出1、背景提出:2010年上海世博会已经开幕,是首次在中国举办的世界博览会,全世界都把目光投向了上海。
储油罐的变位识别与罐容表标定摘 要本文对A 试题进行了分析和研究。
为了解决加油站中储油罐的变位识别与罐容表标定问题,同时分析罐体变位对罐容表的影响,通过建立出在不同油位值情况下比较精准的罐内油位高度与储油量的函数关系模型,利用采集到的小椭圆型储油罐和实际储油罐的实验数据,借助相关软件对问题进行深入研究。
针对问题一:为了研究罐体变位后对罐容表的影响,本文首先根据所给的简化小椭圆型储油罐(两端平头的椭圆柱体),利用微元法,建立出在不同油位值情况下的平头罐体油位高度与储油量的函数对应关系——积分模型(模型一)。
对于倾斜角为 4.1a =︒的纵向变位情况,通过等面积法找到倾斜时油标显示值H 1与对应同体积的水平状态下液高2H 的函数关系,从而得出倾斜角为 4.1a =︒时罐内油位高度与储油量的函数关系。
利用添加多项式对模型进行校正,用MATLAB 软件编程得到所加多项式的参数,得到贴近实际的油位高度与储油量的数学关系模型,并运用该模型得到初始油标值为0,间隔1cm 的罐容表标定值。
再用SPSS 软件中的曲线估计过程拟合得到小椭圆储油罐无变位时油位高度与储油量的函数关系,求解得到无变位时的罐容表。
通过比较小椭圆储油罐无变位和变位斜角为 4.1a =︒时的罐容表标定值,分析出罐体变位前后储油量最大差值大约为270L ,较小差值65L ,平均差值为178.87L ,说明小椭圆罐体变位后对罐容表的影响是很大的。
针对问题二:研究主体为圆柱体、两端为球冠体的实际储油罐,对其进行分段计算,主体1V 的求法沿用问题一中所建立的分段函数数学模型,两端球冠体采用近似椭球的体积求法。
建立出含有参数纵向倾斜角度α和横向偏转角度β的实际罐体显示与储油量的函数对应关系——积分模型(模型二)。
并根据所给采集数据在MATLAB 软件中利用最小二乘法估计出变位参数角度α和β的数值: 2.779, 4.693αβ==将得到的α和β估计值代入模型二中的分段函数关系式中,通过计算理论的累加出油量与检测数据的累加出油量差值,用SPSS 软件中的曲线估计过程拟合得到罐内探针、管线等所占的体积与显示油高的函数关系,并作为修正因子带入的建立的模型二中,得到修正后的模型二(实际罐体显示油高与储油量的函数关系式)。
上海世博会影响力的定量评估上海世博会影响力的定量评估摘 要2010上海世博会备受世界瞩目,也影响我国各个区域,尤其对上海。
本文首先根据上海市1978年至上海申报世博会成功前期的GDP 数据,运用时间序列预测模型,预测出后期GDP 数据,并与实际GDP 作对比,接着分析与经济增长具有密切关系的九项指标数据,讨论各项经济指标的关联度,最后利用主成分分析法找出这九项指标中的主要影响经济增长的因子,即可反映上海世博对经济增长的影响力。
对于模型一,由于经济数据具有较强的自相关性,先采用ADF 检验时间序列的平衡性,接着通过对时间序列取对数、二次差分进行平衡化,然后运用SPSS 得到了拟合函数2(10.231)(1)ln (10.981)0.02t t B B x B ε−−=++,并通过拟合统计值检验了时间序列模型的可靠性,从而对后期数据作出较准确预测,最后通过比较预测值与实际时,得到了世博对上海的经济起到了明显的作用。
对于模型二,为了分析世博对经济增长产生的影响,是如何通过影响经济增长的各项指标来实现,找出引起经济增长的具有代表性受世博影响的九项指标。
利用SPSS 软件九项指标的数据做回归分析,并结合MATLAB 软件拟合得到单个指标随时间变化的函数。
再综合对九项指标数据进行分析,利用灰色系统理论对这九项指标进行关联度分析,并MATLAB 编程得到九项指标的关联系数如下图:1r2r3r4r5r6r7r8r9r0.8822 0.7667 0.8981 0.7124 0.6897 0.7417 0.6482 0.6663 0.6436 对于模型三,采用主成分分析法,通过SPSS 处理,到得影响经济的三个主成分,其方差贡献率之和达到95.517%,主成分与各因子的关系如下234567891010.9890.9850.9930.9440.9870.9930.1860.5330.647F x x x x x x x x x =+++++−−−234567891020.0120.0180.0120.0610.0510.0140.9160.7420.286F x x x x x x x x x =−−+−+−−−−234567891030.0970.0200.0700.2380.0470.0630.0780.1540.698F x x x x x x x x x =+++++−−− 从其表达式分析可以得到,世博导致了外来总投资,社会固定资产投资总额,消费受额,外贸总额,交通,旅游总收入等有较大幅度的增加。

1 1论文来源:无忧数模网2010年上海世博会影响力的定量评估摘 要2010年上海世博会是首次在中国举办的世界博览会,也是第一次在第三世界国家举办。
本文研究有关上海世博会影响力的问题。
从不同的出发点,分别建立了如下两个模型。
模型一采用投入——产出模型模型的核心思想,以年份与的对数值的二次相GDP 关关系和上海市社会固定资产总投入与的对数值的线性关系,利用上海统计年鉴GDP 发布的数据,分别建立无世博影响的表达式,与有世博ii i x x x eQ 21210001.00862.00032.02314.81-++=影响的表达式,两式的预测误差均在3%以内。
与2008年ii ix x x e Q 21210003.00291.00019.01911.82+-+=真实值比较,用表达式预测2008年的的值可以得出世博会对2008年上海市经1Q GDP 济贡献率达到24%。
并且在得知申办世博会后第i 年上海市固定投入总额的前提下由可求出世博会对上海地区经济的持续性积极影响。
如假设2011年市%100212⨯-=Q Q Q η固定资产总投资为5600亿元,则世博会对上海经济有16%的积极影响。
模型二将经济效益与社会效益综合考虑。
运用层次分析,主成分分析以及插值拟合,加权赋值等方法,模拟出世博会影响力与经济效益、社会效益的综合影响关系。
得到上海世博会的经济效益影响力系数0.3480,社会效益影响力系数0.2521。
与大阪世博会经济效益影响力系数0.2179,社会效益影响力系数0.3229对比,得出各种效益倾向下的结论,例如:经济效益:社会效益为0.7:0.3时,上海和大阪的综合影响力系数分别为0.3192、0.2094,得出上海世博会综合影响力优于大阪。
然后对模型二里的影响力的加权表达因子1p 进行灵敏度分析,从而证实该模型的可靠性。
将2000年汉诺威世博会数据代入,证实了该模型很好的稳定性。
最后,在模型推广中分析了世博会可能造成的负面影响。
世博效应:对上海会展业的影响摘要:会展业是会议业和展览业的总称,隶属于服务业,即通过举办各种形式的会议和展览,吸引大量商务客和游客,促进产品市场的开拓、技术和信息交流、对外贸易和旅游观光,并以此带动交通、住宿、等多项相关产业的发展,并被称为“无烟工业”.2010年世博会对上海会展业影响深远,世博会带来的机遇表现在:首先,场馆建设和基础设施为会展提供良好的硬件环境.根据规划,整个世博园区提供了将近二百个展览场馆,世博会举办前、举办中以及举办后都将为上海的会展业带来巨大的发展空间.其次,世博会加快人才的大量培养,为上海会展行业储备和积聚人才.最后,世博会推进会展项目的国际化、专业化、品牌化发展.上海会展业已成为上海服务业的重要组成部分,是提升城市形象、增强城市服务功能和促进社会建设的新兴产业,因此我国各大城市都在大力发展会展业,使其成为地区新的经济引擎,会展业的竞争力是城市综合竞争力的重要反映.我们将建立两种模型,来综合的评估世博会对上海会展业的影响:1. 模糊归一化法评估上海会展业竞争力的综合评价指标;我们可以具体从经济发展水平,商贸发展水平,会展业发展水平,社会事业发展水平,区域交通条件,地理区位条件和旅游业发展水平的评价指标来对会展业的竞争力进行定量的评估.2. 预测会展业未来的发展趋势.“后事件效应”,即在重大事件活动举办之后呈现下降的典型特点,世博会谢幕后,由于国际入境旅游人数的减少,展馆被拆迁或改建等因素,会展业的利润收入会受到波动,因此我们用微分方程构造的数学模型对会展业未来的发展趋势作出一定的预测.通过采集数据,建立模型,用Excel程序包 ,MATLAB 等软件对采集到的数据进行统计分析等处理,来对2010年世博会对上海会展业的影响效应进行定量的评估.关键字:世博会会展业模糊归一假设法一、问题重述以“城市,让生活更美好”为主题,首次在中国举办的中国2010年上海世博会,是一次中国加强与世界交流,近距离对话世界多元文化,向世界学习的重要契机,更是实现科学发展、促进社会和谐的重要机遇.世界博览会不仅仅是为了商业性的目的,更为世界各国展示社会、经济、文化、科技各方面的成就以及发展的前景,提供了绝佳的机遇.中国申办2010年世博会获得成功,上海将获得可观的经济效益.世博会使上海的知名度再次提升,并且通过与同世界的更多接触,能使上海人民的精神面貌、素质得到提高.上海对世博会场址规划的深化和调整,世博园区面积从原来的240公顷增加到310公顷,加上60公顷的停车场和30公顷的世博村,总面积达400公顷.请你们选择感兴趣的某个侧面,建立数学模型,利用互联网数据,定量评估2010年上海世博会的影响力.二、问题的分析2010申博成功已经成为上海会展业发展的“助推器”,为整个会展业及相关行业注入了新的活力,使上海面临着建成世界级会展城市的历史机遇.会展业已经初显格局,区域化发展也进一步增强,会展的数量和收入都大幅上涨,其对于上海的发展发挥的作用也越来越大.会展业的竞争力成为城市综合竞争力的重要反映,Baker等(1993)和陈志平等(2005)提出的城市展业竞争力评价因素,可分为经济、贸易发展水平,社会、科技事业发展水平,地域、交通条件和会展业四个方面.我们可以具体从经济发展水平,商贸发展水平,会展业发展水平,社会事业发展水平,区域交通条件,地理区位条件和旅游业发展水平的评价指标来对会展业的竞争力进行定量的评估.我们根据会展业在世博会开幕前的利润收入,根据假设的增长函数,用MATLAB拟合曲线,得到近几年的增长曲线图,并且对未来的发展趋势作出预测.三、模型假设1. 世博会期间上海的其他行业平稳发展, 没有突发事件发生;2. 上海在预测年内没有举办其他的大型活动;3. 所有附件上提供的相关数据来源网可靠,真实;4. 会展业的利润收入每年的增长率为K(t).四、符号定义及说明iS-第i个城市的会展业竞争力综合评价值,竞争力随值的增大而增大;jV-第j个二级指标的权重;ijW-第i个城市第j个二级指标的标准值;m - 指标数;n - 年份;X-各评价指标原始值maxX-对应评价指标最大值minX-对应评价指标最小值t:初始年份2000t :第 2000 + t 年N 0:t年份的会展利润收入,即2000年是利润N(t):初始年份的会展利润收入K(t):第t年的增长率五、模型建立与求解模糊归一化综合分析方法模型的原理:模糊评价即在评价过程中引入模糊性概念,运用模糊数学来处理世博会影响的一些问题,以反映世博会对各行业影响的不确定性;归一化是一种简化计算的方式即将有量纲的表达式,经过变换,化为无量纲的表达式,成为纯量,从而定量计算出世博会对上海会展业竞争力的纵向的影响.(一)会展城市竞争力模糊关系评价指标体系的建立本文从动态关系出发,从时间维度分析了上海会展业竞争力的变化情况,从而表现出上海举办世博会对上海会展业竞争力的影响.1、城市会展业竞争力评价因素的确定本文采用城市会展业竞争力评级体系中的影响因素,包括经济、贸易发展水平,社会、科技事业发展水平,地域、交通条件和会展业现实水平四个方面.而具体的评价指标可被继续分解为经济发展水平、商贸发展水平、会展业发展水平、社会事业发展水平、区域交通条件、地理区位条件和旅游业发展水平七个方面,所以对会展业竞争力的评估也应从以上七个方面着手:l).经济发展水平指标衡量区域经济发展水平的最好的指标莫过于区域国内生产总值(GDP),所谓区域的国内生产总值,指的是一个区域国民经济各部门在一定时间(通常为一年)内,扣除来自国外的劳动报酬和财产收入后的全部社会最终产品和劳务价值的总和.而会展业的发展所依赖的支柱性产业的实力,从实际的情况来看多来自于工业,故可以用该地区的工业总产值来表示该地区工业发展水平,也就是会展业发展的产业基础.最后,鉴于我国会展业发展的现实情况,不仅交通条件的改善要依赖于城市政府的财政收入,展览场馆的建设也离不开政府的巨额投入,至于现在普遍存在的政府办展的问题,没有一定的财政收入,城市会展业的发展举步维艰. 2).商贸发展水平指标商贸发展水平体现的是一个地区现有商品流通、交易的状况.作为物质、文化交流的途径,会展业的发展必须有一定区域商贸发展水平为基础.我们选取批发零售贸易业商品销售总额作为城市商贸发展水平的指标,以反映批发零售贸易企业在国风市场上销售商品以及出口商品的总量.3).会展业发展水平指标我们选取国际展览会平均展览面积体现会展业发展的基础和现实水平.上海的展览会数量有所减少,但其平均规模都在不断提升.选取国际展览会平均展览面积更能体现上海会展业会展质量的提高.4).社会事业发展水平指标我们选取上海市国民经济结构中的第三产业的比重,来体现上海市第三产业发展水平;选择上海市当年的技术合同成交额来体现城市的科技水平.5).地理区位条件指标可根据城市行政级别和周边城市经济实力来体现地理区位条件指标,上海的此指标可假设不变.6).区域交通条件指标城市的交通便利的状况主要体现在城市物资、人员流动的情况之中,因此可用城市货运总量和客运总量来量化区域交通条件指标.7).旅游业发展水平指标旅游业与会展业关系最为密切,城市旅游业的发展水平直接影响着会展期间参展人员的接待能力,城市的旅游资源对参展商也有着相当的影响力.因此我们选择上海市的国内旅游人数和国内旅游者消费总收入来体现城市旅游业的接待能力和质量.2、求出上海市会展业竞争力综合评价指标权重参考网上相关专家资料,并结合实际,征询经济学院教授得到相关指标打分,然后构造两两比较的判断矩阵;求得特征根和特征向量,并进行一致性检验,得到各级指标的权重如下表一:根据各级指标的权重用Excel作出其柱状图(如图1、2):图1:第一层次指标的权重图2:第二层次指标的权重(二)模型建立通过上海统计局网站公布资料和其他统计资料整理出上地区会展行业竞争力综合评价指标的各项数据(表二):表二:上海地区会展行业竞争力综合评价指标注:其实本模型只针对上海市,地理区位指数不变.归一化处理后得(表三):注:指标的标准值,实际上是对原始数据归一化处理后得到的与原始值相对应而数值在[0,1]区间内的优化值,标准值和权值的使用能使不同的指标在总指标中占有相对应的重要程度.本文使用如下的归一化处理方法:⎩⎨⎧≥=时当--时=当min min max min min X X ,)X )/(X X (X ,0X X W ij (2)上海会展业竞争力综合评价指标体系相应的数学模型如下:),...,3,2,1(1001n i W V S mj ij j i =⨯=∑= (1)根据城市会展业竞争力综合评价指标体系相应的数学模型用matlab 计算得到上海市竞争力综合评价值(表四)和对应曲线图(图2):上海地区会展行业竞争力综合评价标准化指标图2假设法预测未来的趋势设t 年的上海的会展的利润为N(t),2000年为t=0,此时利润收入为N 0, t 年的利润增长率为K (t )(单位时间内N (t )的增量与N (t )的比例系数),根据假设可得,N (t )满足的微分方程为:()()()00dNK t N t dtN N ⎧=⎪⎨⎪=⎩(2) 若增长率K (t )为常数,设K (t )≡K 0,则(2)变为()000dNK N dtN N ⎧=⎪⎨⎪=⎩(3) 解之得:()00K t N t N e = (4)表明利润收入将按指数规律无限增长(K>0).将t 为单位离散化,(4)式表明利润收入以0k e 为公比的等比例增长.因为此时K 表示天增长率,通常K 0<=1,故可用近似关系0k e ≈1+K 0,将(4)式写为()()001tN t N K ≈+ (5)通过比较(1)和(5)可知,模型(1)不过是指数增长率模型离散形式的近似表示.因此,模型(2)式比模型(1)式更广泛.假设K (t )为常数,在世博会前是合理的,但随着世博会的谢幕,国际旅游人数的减少,展馆关闭或拆迁的影响,K (t )一般不是一个常数;为此假设K(t)是一个连续函数,可构造K (t )如下:()()()01122,00,,K t T T t T K t r t s t T t T≤≤⎧⎪<<=⎨⎪-≤≤⎩(6) 其中从0到T 1为世博会开馆的初期,在这个时期利润收入按指数增长;从T 1到T 2为开馆时期,此时由于客流量被控制在一定的范围内,利润收入尚且认为变化不明显,或就没有发生变化,这一时期是很短暂的,随之而来的是世博后效应后展馆的支出函数s(t)大于世博后会展业总的经济收入函数r(t),此一时期利润开始下降.若r(t),s(t)皆为常数,则r(t)-s(t)亦为常数.则由(4)式知当r(t)-s(t)<0时,利润收入按指数律下降.将(6)式代入(2),通过MATLAB 软件求解微分方程可得从2000—2023年的会展业利的变化曲线大致为:对应的用 MATLAB 软解得到增长率K(t)的变化曲线如下:图中显示了K(t)的变化越来越慢,当达到一定程度的时候几乎不在发生变化!但由于外界的影响,K(t)会减小.注:世博会前的展馆平均面积的变化如下表:得到近几年的平均展馆的面积的变化如下图所示: 图3:世博会前的总的展馆面积的变化如下表:假设预测法模型的推广为了准确地预测会展利润收入,利用微分方程构造的数学模型虽然能够预测会展业利润收入的增长规律,但通过与实际数据拟合发现,其精度并不高.为了提高精度,构造如下模型:()1i mt i i N t c e α==∑ (7)其中m 为某个正整数,121,,...,,,...,m m C C C αα为待定常数.为了确定待定常数,利用非先行最小二乘法确定这些常数.首先,根据统计数据(上海地区)得到每年会展业的利润收入,比如01,,(1,2,...,...)i t t i i n ===相对应的利润收入为N 0,N 1,N 2,…,N n ,…,构造函数: ()21111,...,,,...,i j nm t m m i j j i f c c c e N ααα==⎛⎫=- ⎪⎝⎭∑∑ (8)通过求解下列无约束优化问题而得到实验数据11,...,,,...,m mC C αα****()11min ,...,,,...,m m f C C αα (9) 利用()1i mt i i N t C e α**==∑ (10)预测n 年之后的利润收入,例如n+1年的利润收入为()()111i mn ii N n C eα*+*=+=∑.求解无约束优化问题(9),首先求()111,...,,,...,m m f C C C αα对,…,m C 和1,...,m αα的偏导数并令其为0得:1120,1,2,...,k ji jnm t t i j j i eC e N k m αα==⎛⎫-== ⎪⎝⎭∑∑ (11) 1120,1,2,...,k ji jnm t t k j i j j i C t eC e N k m αα==⎛⎫-== ⎪⎝⎭∑∑ (12) 这是一个具有2m 个方程2m 未知量的非线性方程组.由于上述模型(9)不易求解,故将试验函数(7)简化为:()2N t at bt c =++ (13)由()00N N =知0C N *=,下面需确定出试验参数,a b ,根据已测每年的利润收入,(1,2,...)i t i i n ==,相应的利润收入分别为(1,2,...,)iN i n =利用最小二乘法确定,ab ,即构造函数(),f a b 为()()2201,ni i f a b ai bi N N ==++-∑ (14)极小化(),f a b 可得a 和b .求(),f a b 分别对a 和b 的偏导数并令其为0得()()220120100n i i ni i i ai bi N N i ai bi N N ==⎧++-=⎪⎪⎨⎪++-=⎪⎩∑∑ 即()()4320111320111n n ni i i i n n ni i i i a i b i i N N a i b i i N N ======⎧+=-⎪⎪⎨⎪+=-⎪⎩∑∑∑∑∑∑ (15) 故()()()()4320111124231112230011114232111()n nn ni i i i i i nnn i i i n nn nii i i i i n nni i i i i NN i i N N b i i i i i NN i i N N a i ii *=======*=======⋅--⋅-=⎛⎫⋅- ⎪⎝⎭⋅--⋅-=⋅-∑∑∑∑∑∑∑∑∑∑∑∑∑∑从而.()2N t a t b t c ***=++ (16)可作为t 年会展业的利润收入,因此函数可预测第n 年以后的利润收入.六、模型比较与评价数学模型一:在市场经济条件下,会展业可以以其相对优势和绝对优势,向国内或国际市场提供有效服务从而获得比其他行业更高的市场份额的能力.竞争力评价是对竞争优势的定量化描述.通过上面的数据说明了不同年份的会展业具有不同的竞争力,这种竞争力的研究不仅说明了世博会对上海会展业的影响,也对提升其竞争力、促进与推动会展城市会展经济的可持续发展有很大地启发和帮助.模型一是对上海会展业竞争力的评价.通过实例分析证明了模型的有效性.从而进一步研究方向是建立对会展企业竞争力评价模型.数学模型二:此模型不但可以用来预测每年的利润收入,而且还可以预测会展业的未来的发展趋势.通过分析数学模型可得出世博会对会展业现状,未来的影响,从而提放政府采取相应的措施来弥补会展业对上海经济产生的影响!但是该模型不能进行长期的预测,对每年的利润收入在整个过程缺乏必要确切的信息支持,特别是假设利润收入的增长率K 已不能尽用一个常数来表示,因此模型具有明显的缺点.对于本文建立的微分方程模型,其可以对利润收入进行长期预测,该模型是一个能够预测及对政府采取措施来弥补经济的发展提供可靠和足够信息的模型,但建立该模型的困难是需要具体确定增长率函数()k t 则需要大量的数据和实验来分析.而这些具体的相关的数据及其资料却很难在网上搜索到.总体来说:在上海世博会的推动下,2010年上海会展业在国民经济中的地位得到了提高,会展业增加值占GDP 和第三产业增加值的比重都在2010年得到了提高,但是“后事件效应”即在重大事件活动举办之后呈现下降的典型特点,我们预测在2011年会呈现下降趋势.但是不能否定上海世博会在上海的会展业在国民经济中的地位超常规地获得了提高的作用.由于许多重大事件活动的内部的财务、金融等数据资料很难获得,对其影响和效应进行评估变得非常困难、甚至几乎不可能进行量化计算,我们用多个分析法从多个角度进行比较、互证,得出可以自圆其说的结论.七、参考文献[1]万中,曾金平,《数学实验》,科学出版社,2001年.[2]李继玲,沈跃月,韩鑫《数学实验基础》,清华大学出版社,2004年.[3]M.Braun,微分方程及其应用,(张鸿林译)人民教育出版社,1980年.[4]孙明贵,《会展经济学》,机械工业出版社,2006[5]韩中庚,《数学建模竞赛》,科学出版社,2007[6]/中国统计局[7]/2004shtj/tjnj/tjnj2010.htm上海统计局全国的统计数据:年份国内生产总值(亿元)工业生产总值(亿元)货运总量(亿吨公里)客运总量(亿人公里)国内旅游者消费总收入(亿元)国内旅游人数(亿人次)第三产业比重(%)2000 99214.6 40033.6 1358682 1478573 3175.54 7.44 34.8 2001 109655.2 43580.6 1401786 153**** ****.37 7.84 48.2 2002 120332.7 47431.3 1483447 1608150 3878.36 8.78 45.7 2003 135822.8 54945.5 1564492 158**** ****.27 8.7 38.1 2004 159878.3 65210 1706412 176**** ****.71 11.02 40.0 2005 183217.4 77230.8 1862066 184**** ****.86 12.12 40.3 2006 211923.5 91310.9 2037060 2024158 6229.7 13.94 41.7 2007 257305.6 110534.9 2275822 2227761 7770.6 16.1 42.4 2008 300670 129112 2587413 2867892 1.1 17.12 42.9 2009 15046.45 5408.75 76967 11136 1.24 1913.5 59.4年份技术合同成交额(亿元)财政总收入(亿元)批发零售贸易业商销售总额(亿元)国际会展次数(次)2000 \ 13395.23 154.32 \ 2001 73.90 16386.04 165.68 20002002 106.16 18903.64 179.34 30002003 120.22 21715.25 174.93 \2004 142.78 26396.47 181.252005 171.70 31649.29 195.92 38002006 231.73 38760.2 203.51 \2007 344.43 51321.78 204.46 \2008 432.64 61330.35 202.84 \2009 485.75 7760.97 205.49 \上海省统计数据:年份国内生产总值(亿元)工业生产总值(亿元)货运总量(亿吨公里)客运总量(亿人公里)国内旅游者消费总收入(亿元)国内旅游人数(亿人次)第三产业比重(%)2000 4551.15 1956.66 47954 6893 802.8 0.78 50.6 2001 4950.84 2121.19 49545 6324 1009.6 0.83 50.7 2002 5408.76 2312.77 54196 7326 993.5 0.88 51.0 2003 6250.81 2865.85 58669 7212 1113.8 0.76 48.4 2004 7450.27 3492.89 63180 8968 1216.2 0.85 47.9 2005 9164.1 4129.52 68741 9487 1308.5 0.90 50.4 2006 10366.37 4670.11 72617 9619 1419.7 0.97 50.6 2007 12188.85 5298.08 78108 10371 1611.1 1.02 52.6 2008 14069.87 5576.79 84347 10927 1612.4 1.10 53.7 2009 15046.45 5408.75 76967 11136 1913.5 1.24 59.4年份技术合同成交额(亿元) 财政总收入(亿元)批发零售贸易业商销售总额(亿元)国际会展次数(次)平均参展面积(平方米)展览总面积(万平米)第三产业产值(亿元)星级酒店总收入(亿元)2000 0.15085 1752.69 0.750985 89.12 2001 0.216715 1995.62 0.806268 278 0.58 162 2 728.94 94.23 2002 0.245417 2202.25 0.872743 314 1 316 3 038.90 97.95 2003 0.291471 2828.87 0.851282 306 1.36 417 3 404.19 96.91 2004 0.350508 3591.73 0.882038 202 1.51 306 4 097.26 139.69 2005 0.473054 4095.81 0.953428 276 1.36 376 4 620.92 152.54 2006 0.703119 4798.93 0.990364 295 1.47 434 5 244.20 154.11 2007 0.883191 7310.26 0.994988 309 1.54 475 6 408.50 159.7 2008 0.99161 7532.91 0.987104 294 2.03 597 7 350.43 154.59 2009 0 7760.97 1 243 2.33 566 8930.9 131.53。
2010年上海世博会影响力的定量评估摘要世博会是一项享誉全球的大型活动,素有“经济奥林匹克盛会”之称,其规模之大、参赛人数之多、影响力之大对东道国和举办城市的旅游业的影响是一般单项活动所不能匹敌的,这些通过历史数据和资料可以得到印证。
世博会所具有的国际影响力,为上海成为现代化国际旅游城市提供了很好的契机,其蕴含的意义和影响是极其深远的。
针对该题我们选择从上海旅游业的发展来评估上海世博会的影响力。
首先为评价上海至申办世博成功前后,世博效应对上海旅游产业的拉动作用,建立评价指标体系,取2000年到2009各年数据为样本,建立评价模型(模型一),采用投影寻踪方法,运用DPS 8.01数据处理软件。
结论如下:变量投影方向分别为x1= 0.1793,x2=0.1482,x3=0.1581,x4=0.2557,x5=0.403,x6=0.4347,x7=0.3138,x8=0.0996,x9=0.3166,x10=0.2909,x11=0.4053,x12=0.216;样本投影值为(-3.8312,-3.2739,-2.5318,-2.5318,-0.7344,0.5714,1.6351,2.9655, 3.8656,3.8656)。
从中可以看出:从2002年上海市申请世博会成功后,随着大量资金的投入,其对上海市旅游业的拉动作用越来越显著。
然后通过预测数据,对历届世博会对举办城市旅游业的影响,世博园的游客量,上海举办世博与否对上海旅游业的影响,世博会的负面影响分析等方面进行研究。
可以将上述过程分为三个阶段。
第一阶段:从已知的2010年5月到8月进世博园参观人数(图形1)分析,建立GM(1,1)模型,预测出上海世博园的游客总量约为7208.196万人次。
又查得相关数据,分析历届世博会对举办城市旅游业的影响(表1),运用文献分析法研究世博会对举办城市旅游业产生的影响。
第二阶段:结合已知的4月、5月、6月、7月上海旅游人数的数据资料,建立GM(1,1)模型,预测出2010年上海市8月、9月、10月的游客总量分别为775773人、794463人、813603人,又查出2006年到2009年各月来沪旅游总人数,建立表2:2006-2010年上海市旅游人数,使其与2010年同期作比较做出折线图(图形2),并对图形分析得:随着年份的增长,上海市的游客数量也在不停增长,且世博会期间的游客量增长较大。
2010年上海世博会经济综合评估(杨建林、熊明会、李艳梅)摘 要本文综合评估了2010年上海世博会对经济的影响,文中着重从科技进步、旅游发展、吸引外资三方面进行研究、讨论。
第一方面:科技进步对经济的影响。
在基于索洛进步模型(科技进步对经济增长的作用模型)的基础上,利用索洛进步模型函数关系式),,(L K t Y Y =对相关数据进行微分,找出科技进步率与GDP 的增长速度的关系,最后得到科技影响经济的一个关系E=%100⨯ya(a 为科技进步率、y 为GDP 增长速度、E 为科技对经济的作用),在此基础上,得到V=E ⨯m=25%⨯9%=2.25%>0(V 为世博对经济的影响、m 为工业增加值比去年增加值的增长值),说明世博会带来的科技对经济有极大的促进作用。
第二方面:世博旅游对经济的影响。
通过收集数据,用Matlab 绘图拟合得出游客人数与门票收入之间的函数关系y=18400L+N(L 为旅游人数、N 为我们假定的游客消费与支出间的一个恒量),其次,运用近几年上海旅游收入与总的财政收入数据之间进行拟合得到一个函数,其关系式为y=3.19x-816.85,通过计算得相关统计量R=∑∑∑==--=------ki ki iiki i iy x xy y x xy 111)()())((,有|R|﹥c(c 为临界值,此时相关系数r=0.01),则线性相关显著。
再运用相关实际数据计算出两个收入之间的比例,得出财政收入增长的大部分依靠旅游收入,所以旅游是提高经济收入的一个重要因素。
第三方面:世博外商投资对经济的影响。
通过1986—2006年外商投资与上海GDP 的数据,运用SPSS 对数据进行拟合,得到符合Logistic 模型的曲线,曲线方程为Y=1/((1/u)+b0*(b1^t)) (其中u=2000为函数的上限),由已知的2010年1月到7月的数据,预测出2010年部分月份的外商投资对经济增长的影响,分析2010年外商投资的趋势,假设非正常增长的外商投资是世博会带来的,从而推算出世博促进了上海经济的发展。
2010年上海世博会科技影响力的定量评估模型摘要:2010年上海世博会是首次在中国举办的世界博览会。
从1851年伦敦的“万国工业博览会”开始,世博会正日益成为各国人民交流历史文化、展示科技成果、体现合作精神、展望未来发展等的重要舞台。
“科学技术是生产力”是马克思主义的基本原理。
于是,我们放弃了大众化的旅游或经济问题,而是选择了有突出成效的科技成果,并从科技成果这一侧面,对世博会的影响力进行定量评价。
反应科技成果影响力的指标很多,本文选择了其中最重要的5个指标作为第一层评价因素,分别是实用性,创新性,严谨性,可探索性,可继承性。
又从世博会中选取了9个项目作为评价这5个指标的第二层因素,分别是世博轴,LED光源,立升直饮水,准4G技术,手机付款,物联网首秀,电子导游仪,数控水幕,农民机器人,从而建立了层次结构模型。
本文利用层次分析法,分别对两层评价因素,建立两两成对比较矩阵并进行一致性检验,进一步计算出特征向量及特征根,得出第一层及第二层个因素的权重向量。
然后,利用互联网调查得到的数据,分别对9个项目从5个方面进行评分,得到5项指标的得分向量,最后利用前面求得的权系数向量加权求和,得到上海世博会科技影响力的综合评价得分。
经过计算,综合评价得分为85.589,可见这次世博会的科技影响力让世人叹为观止,各媒体也争先报道此届世博的新科技,在百度上搜索“上海世博会科技”可得到21,800,000篇相关文章,可见其影响力之大。
关键字:层次分析法,一致性检验,权重,评分,加权求和一、 问题重述:2010年上海世界博览会(Expo 2010)是第41届世界博览会。
此次世博会是由中国举办的首届世界博览会。
上海世博会以“城市,总投资达450亿人民币,创造了世界博览会史上最大规模记录。
此次世博会以“城市,让生活更美好”为主题,展现了人们对未来生活的期盼。
其主要表现在它所包含的五个分主题:城市与经济发展关系、城市与可持续发展关系、城乡互动关系、城市与高科技发展关系、城市与多元文化发展关系。
上海世博会影响力的定量评估摘要本文是一个对上海世博会影响力的定量评估问题,首先我们收集了与世博会有关的数据,如国内来沪旅游人数,国外来沪旅游人数等。
并用灰色预测对相应的数据进行了预处理,然后我们从横向(本届世博对上海的影响)和纵向(本届世博和历届世博的影响比较)两个角度对世博影响力进行了研究,最后还应用了多目标优化模型求出在不同投资增长系数下上海世博对当地旅游经济最大影响力系数。
第一步,我们横向考虑世博会对本地旅游业的影响力,并将该影响分为对旅游经济的影响和对旅游文化的影响两方面。
首先应用本底趋势线模型得出相应数据的本底值,再分别建立对旅游经济和旅游文化的影响力系数模型,然后利用本底值和统计值得出相底值增加了579.39亿元的旅游收入。
而世博对旅游文化的影响力系数为1.29。
第二步,我们纵向考虑上海世博会与历届世博会相比的影响力。
根据收集的历届世博会相关的规模数据,将世博会影响力等级从低到高分为1-5等,从而建立了世博会综合影响力的模糊评价模型。
对历届世博会的影响力做出综合评价并得出了相应的综合影第三步,我们从环保,旅游收入以及后世博效应三个角度对上海世博的影响重新进行了思考。
综合权衡这三个方面因素,我们建立了一个多目标优化的模型。
得出了在不同投资增长系数下的一个合理的旅游经济影响力系数和世博年最优的旅游者的人数。
当投资增长系数为0.4时,其对旅游经济的影响力系数为1.297,则该年最大的旅客人数为13415.54万人。
而我们根据预测值得出2010年总旅客人数为12695万人,说明预测的旅客人数未超过最大人数限制。
最后,我们根据所求得的影响力系数,对上海世博会写了一篇影响力评估报告。
关键词:本底趋势线模型模糊评价模型多目标优化旅游文化影响力系数1.问题重述1.1问题背景中国2010年上海世界博览会(Expo 2010),是第41届世界博览会。
于2010年5月1日至10月31日期间,在中国上海市举行。