生产部产能分析表(新项目用)
- 格式:xls
- 大小:95.50 KB
- 文档页数:2
1.目的为了规范产能评估流程,确保生产线产能满足客户需求,提前识别产能瓶劲并采取措施,避免交付问题。
2.范围适用于本公司所有部门。
3.定义:无4.职责与权限4.1 计划部:负责客户订单信息,预测订单信息的收集和计划工作的安排。
4.2 营销中心:负责及时与客户的沟通协调及报警工作。
4.3 研发中心:负责技术方案制定。
4.4 PIE:负责产能提升方案制定。
4.5 采购部:负责委外资源的协调和调用,紧急物料协调。
4.6 生产部:负责计划的执行。
5.内容5.1 新项目产能分析:5.1.1在接到新项目时,零部件事业部投产经理,与研发中心、营销中心、采购等各部门人员一起将新项目特殊工艺或特殊工装设备识别,在公司没有资源的情况下,在项目前期必须确定,外协加工或公司内部采购新设备加工,内部采购新设备的,进行《设备采购流程》。
5.1.2在项目PP阶段,营销中心、研发中心、PIE、计划部根据客户预测信息;进行产能评估分析,完成产能分析报告。
5.1.3在新项目试生产启动时,PIE根据客户一年预测信息(或量产前三个月预测信息)进行产能评估分析,完成产能分析报告。
5.2 周产能评估分析每周五上午PMC主管组织相关人员,开月周产销协调会议,将下周及下下周客户的预测发布,并由主计划人员确定目前实际产能情况,生产部各科室进行下两周的产能评估,会议中若有不能完成的,及时提出,进行计划变更或资源调整等,确保客户交付。
5.3 月产能评估每月(25-30号)PMC主管组织相关人员,开月度产销协调会议,将下月及下下月客户的预测发布,并由主计划人员确定目前实际产能情况,生产部各科室进行下两周的产能评估,会议中若有不能完成的,及时提出,进行计划变更或资源调整等,确保客户交付。
5.4 年产能评估每年12月中旬,业务部将客户下一年预测发布给计划部,计划部将信息反馈给生产部,其中包括第二年要停产的项目和重新量产的项目的年预测量和月预测量,生产部组织相关人员,对所有项目进行产能分析,完成《年度产能分析报告》。
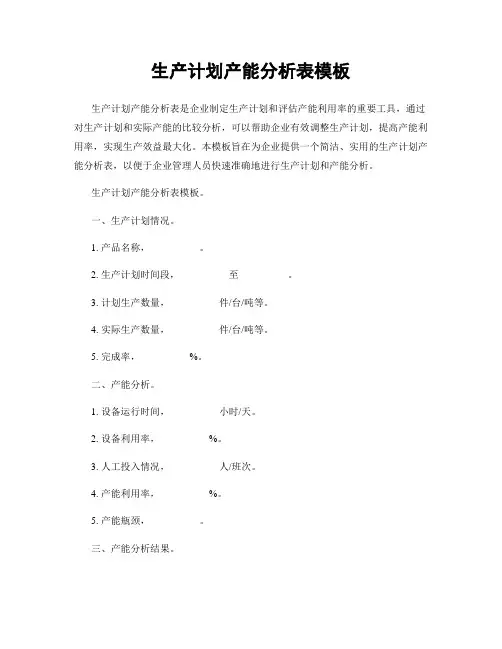
生产计划产能分析表模板生产计划产能分析表是企业制定生产计划和评估产能利用率的重要工具,通过对生产计划和实际产能的比较分析,可以帮助企业有效调整生产计划,提高产能利用率,实现生产效益最大化。
本模板旨在为企业提供一个简洁、实用的生产计划产能分析表,以便于企业管理人员快速准确地进行生产计划和产能分析。
生产计划产能分析表模板。
一、生产计划情况。
1. 产品名称,__________。
2. 生产计划时间段,__________至__________。
3. 计划生产数量,__________件/台/吨等。
4. 实际生产数量,__________件/台/吨等。
5. 完成率,__________%。
二、产能分析。
1. 设备运行时间,__________小时/天。
2. 设备利用率,__________%。
3. 人工投入情况,__________人/班次。
4. 产能利用率,__________%。
5. 产能瓶颈,__________。
三、产能分析结果。
根据以上生产计划和产能分析数据,对比计划生产数量和实际生产数量,结合设备运行时间、设备利用率、人工投入情况和产能利用率,得出以下产能分析结果:1. 产能利用率较低的原因,__________。
2. 产能瓶颈所在,__________。
3. 产能提升方案,__________。
四、改进措施。
1. 调整生产计划,根据产能分析结果,合理安排生产计划,避免产能浪费和闲置。
2. 设备维护保养,加强设备维护保养工作,提高设备运行稳定性和利用率。
3. 人力资源调配,合理安排人工投入,提高人工利用率,减少人力浪费。
4. 技术改进,引进先进生产技术和设备,提高生产效率和产能利用率。
五、总结与展望。
通过生产计划产能分析表的填写和分析,企业可以及时发现产能问题,制定合理的改进措施,提高产能利用率,实现生产效益最大化。
同时,也可以为未来的生产计划和产能规划提供重要参考依据,促进企业持续健康发展。
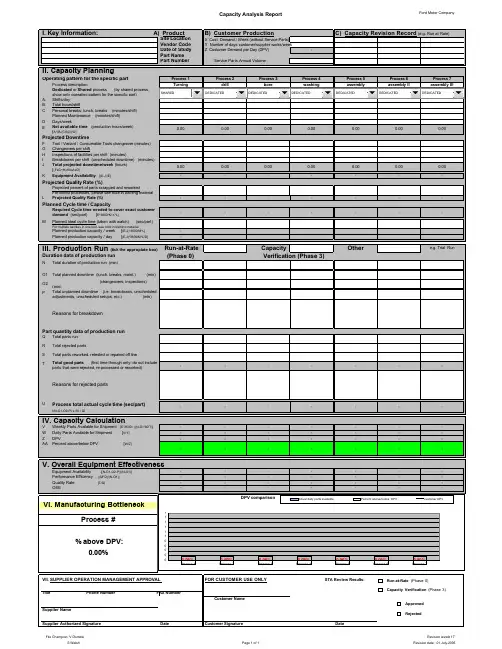
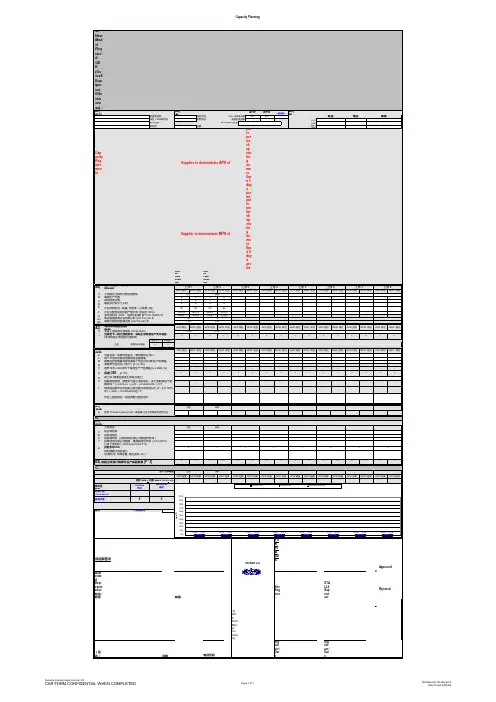
Capacity Analysis Report Ford Motor CompanyFile Champion: V DomdeiS Walsh Page 1 of 1Revision level# 17 Revision date : 01.July.2005General Information - Capacity Analysis ReportCapacity VerificationThe Capacity Analysis Report consists of two elements, Capacity Planning (verification of production readiness) and Performance of Capacity Verification.The Capacity Anaysis Report is though divided into 7 areas for ease of use. Each area has a heading at the top of the box. The headings are:· Key Information - Product / Customer Production / Capacity Revision Record· Capacity Planning· Production Run· Capacity Calculation· Original Equipment Effectiveness (OEE)· Manufacturing Bottleneck· Supplier Operation Management ApprovalData inputThe Capacity Analysis Report worksheet has been divided into a number of easy to identify information boxes. Each box has a main heading to allow easy recognition. Within each box the user is required to input a variety of data forms. This manual will explain how to complete each section in turn.Input & Calculation Cells: Data can only be input into the workbook in the cells on each sheet that require data. This ensures that the headings, or other information cannot be accidentally erased or modified. These cells (input cells) are clearly identified as white in colour and with a solid outline around the box.Cells that are grey in colour are calculation cells. The user cannot enter data into these cells. They calculate values according to specific formula using data entered into the input cells.KEY INFORMATION - Product & Production Information / Capacity Revision RecordProduct InformationThe first Step in completing the Capacity Analysis Report is to enter details of the part being analysed. These Cells hold the basic information on the supplier and the part analysed within the worksheet. Production InformationBefore the Capacity verification can take place, the Program Volume must be verified. This information will be available through the Request for Quote and the Purchase Order or other official information from the Launch teams. Please note that the RFQ may include 10% uplift for Service parts.Input Cell: Customer Demand per Week. Note: Weekly volumes in RFQ include a 10% uplift for service parts.Input Cell: Number of days customer / supplier works per week, this is per default 5, but could be changed to address complex supplier shift patterns e.g. 4 day full work, 5th day 5 hours. Please note that the supplier should work always in or above Tact with the PTO / VO plant.Input Cell: Service Parts: Please enter the number of service parts required for this component. This is for information only. The daily volume should be calculated without 10% uplift factor.Capacity Analysis Report - Revision RecordRecord any changes of this document in this fields for follow up. If a ramp up period to full production capacity is required, where the line will achieve full capacity over a number of stages,then this area will be where these changes are recorded. The proven capacity is entered together with the date. Any revisions to the capacity of the machine must be tracked using this box.CAPACITY PLANNINGThe Capacity Planning element will assess if suppliers have a "true production environment" in place and have a adequately prepared their organization and their suppliers for the start of production and ramp-up.A cut of the Operating pattern is shown above with an example of a data input for a process with five operations. The Operating pattern gives the opportunity to give each operation a different operation pattern. The operating pattern input should mirror the true dedicated manufacturing time for each operation, e.g. by shared machines.Input Cells: Process Description: Enter a brief Description of a process (e.g. final assembly, or inspection)Input Cells: Dedicated or Shared Process: Identify from a drop-down box, the process type – dedicated / shared.Dedicated MachinesA “dedicated” machine is one, which is solely used for the part being analysed in this worksheet. For example, a test station may be a dedicated machine. A machine, which is used by this part, and one or two others, with a short changeover time can also be categorized as a "dedicated" machine. An example is a manually operated projection nut welder.A “shared” facility is one which has many different parts manufactured on the facility, and a more significant tool changeover time. It would be usual for such a machine to manufacture parts in a batch production mode.Examples of a shared facility are:· stamping press· injection moulding machine· heat treatment facilityThe operating pattern should only show the real production time to the part in question.In addition to identifying the process as "shared" in the Capacity Analysis Report, a Shared Capacity Analysis of the "shared" facility should be calculated, identifying all Ford parts,Non-Ford parts volume and other production hours produced on the manufacturing line, determining if the capacity or time available is oversold. (See also attached excel sheet for Shared production lines)· Input Cells: Shifts per day: - indicate the number of shifts in which each process operates per day.· Input Cells: Gross hours per shift– total number of hours for each shift.· Input Cells:Personal Breaks – If the machine stops during personal breaks enter the length of time over one shift that the machine will notbe operating. If the machine operates during personal breaks then enter "0".· Input Cells:Planned Maintenance – this is the length of time that is planned for the machine to be down during a shift for a maintenance.· Input Cells:Days per Week – indicate the number of days in which each process operates per week. Example: Supplier's working 4 days 3shifts each and on Friday only 1 shift should just enter: 4 working days plus 0,333 working day = 4,333 days / week· Input Cells: Tool / Modul changover– Enter the changeover time for tool changes or module changes for the part in question. Changeover time is defined as the total time from last off previous part to checked first off new part.· Input Cells:Changeovers per shift– Enter the frequency of tool / module change per shift.· Input Cells: Inpections per shift - Enter the time required for inpections or adjustments during a shift· Input Cells:Downtime – Enter all other projected / planned downtime during a shift.· Calculation Cell: The Equipment Availability is calculated automatically by using previous data.Equipment Availability= (Total Planned Production Time – Breakdown) / Total Planned Production Time· Input Cells: Projected Scrap Rate – Enter the values for this machines losses. Note: This sheet does not address scrap rate loss of linked processes. To evalute output of linked processes the scrap· Input Cell: Planned Cycle time – Please provide the best estimate of the cycle time of the part on each process. The worksheet will use this data to calculate the Planned Production Capacity. This could be also a time taken with the stop watch at the bottleneck process. The process taken should always be considered including the time for loading / unloading and inspection. Note: For multiple cavities in one tool the actual cycle time of the tool must be devided by the number of cavities in the tool.· Calculation Cell: Required Cycle time needed to cover exact customer demand - For information only the worksheet displays the Cycle time needed to cover exact customer demand, calculated from planned opperating pattern, projected downtime and quality rate. This is to be compared to the Planned cycle time· Calculation Cells:Planned production capacity per week and Planned production capacity per day. This is to be compared with the Customer Demand per Week or Day.PRODUCTION RUNPrior to performing Run-at-Rate (Phase 0) or Capacity Verification (Phase 3), the supplier and customer should be in agreement on the following key parameters: quantity of parts to produce, selection of characteristics to measure, process set-ups, review of personnel involved, data analysis and reporting.The intent of the Production Run is to determine if the supplier can produce quality parts at production feeds and speeds. No direct data from the Capacity Planning chapter is used in the Production Run calculation.· Input Cells: Duration of production run – Please enter the amount of time that is used for the production run. If the production run covers one shift of 8 hours, the total minutes run would therefore by 480 minutes (8*60min).· Input Cells:Total planned downtime (lunch,breaks,maint.) – Please list all real downtimes during production run which have previously been planned according to the capacity planning - opperating pattern, i.e. lunch, breaks, maintanence.· Input Cells:The Planned downtime – (changeovers, inspections) - Please list all real downtimes during production run which have previously been planned according to the capacity planning -projected downtime, i.e. changovers, inpsections and adjustments.These downtimes will be subtracted from the Duration of production run in the Actual Cycle Time calculation.· Input Cells: Total unplanned downtime - List all unplanned downtime, i.e. breakdowns or other unsceduled adjustments or setups. The time of the breakdowns will not be subtracted from the duration of production run.· Input Cells:Total parts run, the Total rejected parts and Total parts reworked from production run need to be listed.· Calculation Cell: Total good parts - Only the total good parts will be used for the Actual Cycle time calculation.Please list in detail the Reasons for breakdown and Reasons for rejected parts.· Calculation Cell: Process a ctual cycle time – The Worksheet will automatically calculate the cycle time based on minutes run of production run and total parts produced. This will give the Procuction Run actual cycle time.For validation, compare the Actual process cycle time with the Planned ideal cycle time from the Capacity Planning.This cycle time used for the Capacity Analysis includes though only the good parts produced and excludes the unplanned breakdown time. This higher cycle time gives the realistic available capacity.CAPACITY CALCULATIONThis part of the Production Run is the analysis of the results. The Cycle time of each process from the Capacity Verification Run is compared with the Customer Demand of the part.If a process does not cover the customer demand on the daily production volume, the process is highlighted RED and marked as the bottleneck process.OVERALL EQUIPMENT EFFECTIVENESSThe Overall Equipment Effectiveness (OEE) is calculated from previous data from Production Verification Run. For the calculation of a Performance Efficiency is through the planned cycle time required. This information is taken from the Cell Planned ideal cycle time from Capacity Planning.If a calculation cell shows 100% or more, the cell is highlighted RED and data input should be validated.B81Capacity Analysis ReportFord Motor CompanyFile Champion: V. Domdei S. WalshPage 1 of 1Revision: #17Revision date: 01.July.2005Shared Production Line Information SheetSupplier / Process InformationCapacity Revison Record DateDesciptionLoadingSupplier Name:ABC SystemsOriginal Capacity submissionSite Location Vendor CodeProcess DescriptionBlank Assy. Line (Focus)Capacity Analysis Sheet Ford Motor CompanyFile Champion: V DomdeiS Walsh Page 1 of 1Revision level# 17Revision date : 1.July.2005 Capacity Verification (Check One)OperationProcessProcess DescriptionCapacity Verification Data Collection。

产能分析报告表格模板概述本文档旨在为制定产能分析报告提供表格模板,以便用户可以更加方便和高效地进行产能分析。
1. 产能分析指标在进行产能分析之前,首先需要确定合适的产能分析指标。
以下是一些常用的产能分析指标:1.1 产能利用率产能利用率是指实际产能与理论产能之间的比率,用于衡量企业在特定时间段内实现产品或服务的能力。
产能利用率的计算公式如下:产能利用率 = 实际产能 / 理论产能1.2 产能率产能率是指在特定时间段内实际产出的产品或服务数量与理论产能之间的比率。
产能率的计算公式如下:产能率= 实际产出量 / 理论产能1.3 产能缺口产能缺口是指实际产出量与市场需求量之间的差距。
产能缺口可以帮助企业确定是否需要增加产能或调整生产计划。
产能缺口的计算公式如下:产能缺口 = 实际产出量 - 市场需求量2. 表格模板下面是一个使用表格展示产能分析报告的模板。
用户只需要根据实际情况填入相应数据即可。
时间段理论产能实际产能产能利用率实际产出量产能率市场需求量产能缺口2020年1月1000 900 90% 800 80% 1000 -2002020年2月1200 1100 91.7% 1000 83.3% 1200 -2002020年3月1300 1200 92.3% 1100 84.6% 1300 -2002020年4月1500 1400 93.3% 1300 86.7% 1500 -2002020年5月1600 1500 93.8% 1400 87.5% 1600 -200 ……………………3. 使用说明用户只需要按照自己的需求填入表格模板中的数据即可。
具体步骤如下:1.将时间段填写在“时间段”一栏中;2.将相应时间段的理论产能填写在“理论产能”一栏中;3.将相应时间段的实际产能填写在“实际产能”一栏中;4.根据实际情况计算并填写相应时间段的产能利用率、实际产出量、产能率、市场需求量和产能缺口。
4. 结论通过使用本表格模板进行产能分析,用户可以更好地了解企业在特定时间段内的产能状况,并根据产能指标进行相应的调整和决策。
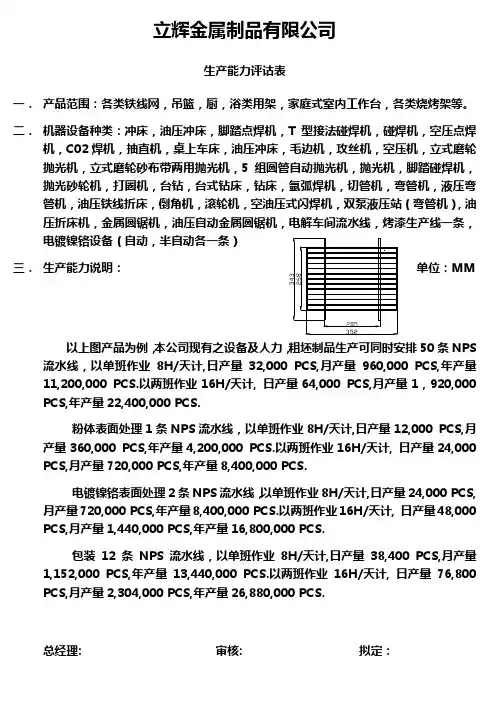
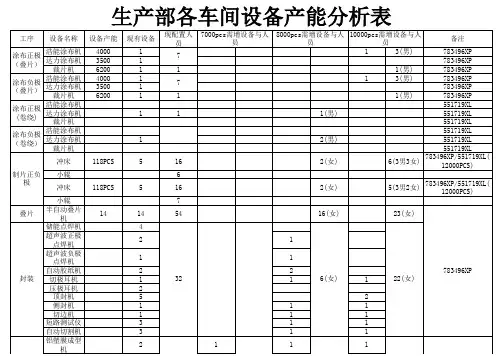
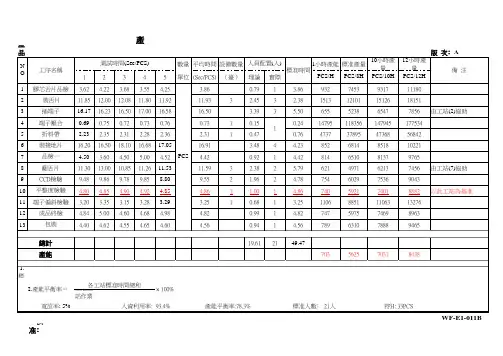
立辉金属制品有限公司生产能力评诂表一.产品范围:各类铁线网,吊篮,厨,浴类用架,家庭式室内工作台,各类烧烤架等。
二.机器设备种类:冲床,油压冲床,脚踏点焊机,T型接法碰焊机,碰焊机,空压点焊机,C02焊机,抽直机,桌上车床,油压冲床,毛边机,攻丝机,空压机,立式磨轮三.生产能力说明:11,200,000 PCS.以两班作业16H/天计, 日产量64,000 PCS,月产量1,920,000 PCS,年产量22,400,000 PCS.粉体表面处理1条NPS流水线,以单班作业8H/天计,日产量12,000 PCS,月产量360,000 PCS,年产量4,200,000 PCS.以两班作业16H/天计, 日产量24,000 PCS,月产量720,000 PCS,年产量8,400,000 PCS.电镀镍铬表面处理2条NPS流水线,以单班作业8H/天计,日产量24,000 PCS,月产量720,000 PCS,年产量8,400,000 PCS.以两班作业16H/天计, 日产量48,000 PCS,月产量1,440,000 PCS,年产量16,800,000 PCS.包装12条NPS流水线,以单班作业8H/天计,日产量38,400 PCS,月产量1,152,000 PCS,年产量13,440,000 PCS.以两班作业16H/天计, 日产量76,800 PCS,月产量2,304,000 PCS,年产量26,880,000 PCS.总经理: 审核: 拟定:注:以下修改处均划线5.6.1 核算生产能量:(增加5.6.1.3)5.6.1.3生管在接到订单后,针对老产品在3天内依据技术文件将订单产品之机台设备,作业人员,生产流程,工序产能等基础资料录入月份生产工时统计表,新产品在技术文件下发后3天内录入月份生产工时统计表。
5.9 (剩)余(劳动)力管理:(删除5.9.1 , 5.9.3原内容,改为5.9.1/2/3/4 ,5.9.2改为5.9.5 原内容:5.9.1 因产能的增加或工序的改善造成人员多余或须补充人员时,生产单位应及时申报至生管处,生管依实际生产能量及订单交期进行人员调整。
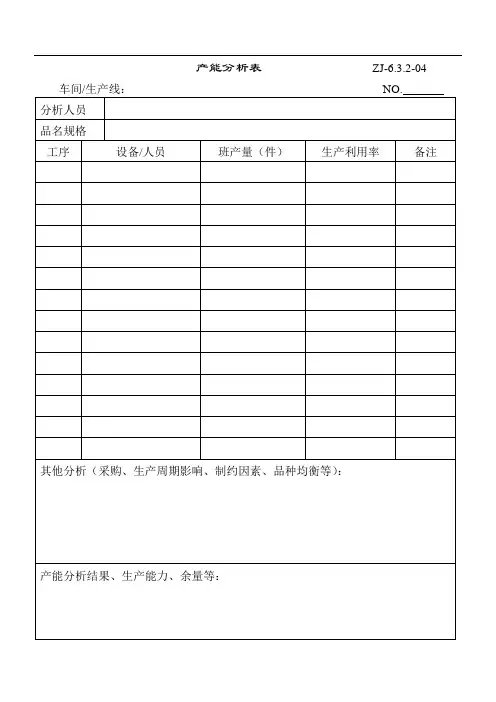
产能分析表ZJ-6.3.2-04审核/日期:制表/日期:初始材料清单审核:制表:过程更改记录ZJ-7.1-10制表:过程流程图批量生产总结报告ZJ-7.1-07特殊特性清单编制:审核:批准:日期:特殊特性清单编制:审核:批准:日期:项目布置图ZJ-7.1-09项目建议书制表:项目小组名单审批/日期:编制/日期:出师表两汉:诸葛亮先帝创业未半而中道崩殂,今天下三分,益州疲弊,此诚危急存亡之秋也。
然侍卫之臣不懈于内,忠志之士忘身于外者,盖追先帝之殊遇,欲报之于陛下也。
诚宜开张圣听,以光先帝遗德,恢弘志士之气,不宜妄自菲薄,引喻失义,以塞忠谏之路也。
宫中府中,俱为一体;陟罚臧否,不宜异同。
若有作奸犯科及为忠善者,宜付有司论其刑赏,以昭陛下平明之理;不宜偏私,使内外异法也。
侍中、侍郎郭攸之、费祎、董允等,此皆良实,志虑忠纯,是以先帝简拔以遗陛下:愚以为宫中之事,事无大小,悉以咨之,然后施行,必能裨补阙漏,有所广益。
将军向宠,性行淑均,晓畅军事,试用于昔日,先帝称之曰“能”,是以众议举宠为督:愚以为营中之事,悉以咨之,必能使行阵和睦,优劣得所。
亲贤臣,远小人,此先汉所以兴隆也;亲小人,远贤臣,此后汉所以倾颓也。
先帝在时,每与臣论此事,未尝不叹息痛恨于桓、灵也。
侍中、尚书、长史、参军,此悉贞良死节之臣,愿陛下亲之、信之,则汉室之隆,可计日而待也。
臣本布衣,躬耕于南阳,苟全性命于乱世,不求闻达于诸侯。
先帝不以臣卑鄙,猥自枉屈,三顾臣于草庐之中,咨臣以当世之事,由是感激,遂许先帝以驱驰。
后值倾覆,受任于败军之际,奉命于危难之间,尔来二十有一年矣。
先帝知臣谨慎,故临崩寄臣以大事也。
受命以来,夙夜忧叹,恐托付不效,以伤先帝之明;故五月渡泸,深入不毛。
今南方已定,兵甲已足,当奖率三军,北定中原,庶竭驽钝,攘除奸凶,兴复汉室,还于旧都。
此臣所以报先帝而忠陛下之职分也。
至于斟酌损益,进尽忠言,则攸之、祎、允之任也。
愿陛下托臣以讨贼兴复之效,不效,则治臣之罪,以告先帝之灵。

产能与负荷分析实施规范(含表格)产能与负荷分析实施规范(ISO9001:2015)1. 总则1.1. 制定⽬的规范⽣产计划安排前对制造产能与⽣产负荷之间是否平衡的分析,使⽣产计划合理、可靠、并可作为事前之设备、⼈⼒申请的依据。
1.2. 适⽤范围⽣管部安排中⽇程⽣产计划(⼀般指⽉度⽣产计划)时适⽤,也可共制造部作为⼈⼒、设备分析的参考。
1.3. 权责单位1) ⽣管部负责本办法制定、修改、废⽌之起草⼯作。
2) 总经理负责本办法制定、修改、废⽌之核准。
2. 定义2.1. ⼯作中⼼区分1) 为⽅便产能预估计算,由⽣管部将制造部门依功能别区分为若⼲个“⼯作中⼼”(⼀般以⽣产线别、课别为单位),作为产能与负荷的管制单位,并予编号区别。
2) 凡为必须连续作业之相连的不同设备,应将其整体视为⼀个⼯作中⼼。
3) 凡为⼯作性质相同,且规格类似或相同之各不同个别设备(如注塑机),其⽣产批作业可以互相替换者,应视为同⼀“⼯作中⼼”。
4) 凡为⼯作性质相同之班组(⼈员),应视为同⼀⼯作中⼼,不另依熟练度或更细⼯序再划分为不同的⼯作中⼼。
2.2. 产能与负荷分析管制表⽣管部将各⼯作中⼼每⼀时段(⼀般为⽉度或周次)的产能与负荷分别换算成相同之可⽐单位,如时间或产量(⼀般⽤时间来衡量),填⼊同⼀张表单,以⽐较分析制造能⼒与⽣产任务之间可否平衡。
此表即称为产能与负荷分析管制表,⼀般应包括下列内容:1) ⼯作中⼼之名称、编号。
2) 分析评估期间(⼀般为⼀个⽉或⼀周)。
3) 产能状况,含正常上班及加班,⼀般包括可稼动天数、可出勤⼈数、可稼动设备数、每⽇班次、产能系数及产能时间等项⽬。
4) 负荷状况,含⽣产批号、⽣产产品、⽣产预定量、标准⼯时、负荷⼯时等项⽬。
5) 分析结论及对策。
3. 产能预估分析3.1. ⽉份产能预估分析1) 每⽉24⽇前,⽣管部依各⼯作中⼼别分别填写产能状况。
2) 正常产能,指该⽉份依公司规定正常上班的总时间内的产能状况,依次填⼊可稼动天数、可出勤⼈数、可稼动设备数、每⽇班次。