一个简单的Matlab_GUI编程实例
- 格式:doc
- 大小:124.00 KB
- 文档页数:5

今天由于要帮一朋友用matlab处理一幅图片,处理图片的要求其实很简单,就是把图片加载进matlab中,然后显示出想要的某一列的趋势图来。
如果用代码写的话,程序如下:x=imread(‘文件路径\*.jpg’);figure(1);plot(x(:,100)); %假如要显示的是图像的第100列的趋势图显示效果如下图所示:虽然用M文件写两句很简单,不过带着感情,追求更好是我们永恒的动力,首先用M文件时候人机界面不友好,的看很多的代码,尤其对不太熟悉M编程的的人而言即使很简单也看着比较郁闷,因此我们接下来用matlab中的GUI来完成这个简单的例子,当然编程起来比这个复杂多,但是对使用者而言确很简单清楚。
这个就如同VC中的MFC和WINDOWSFORMS一样。
做成的都是人机交互界面。
不废话了,看例子。
首先打开MATLAB,要新建一个MATLAB GUI 程序有三种方法,这里我直接在命令窗口里输入guide,新建一个空的GUI程序,选择如下图:新建好的GUI编程界面如下图,上面无非就是菜单,工具,还有编程用到的控件,还有编程的用户窗口。
这个和LABVIEW有点像。
不过LABVIEW的前面板都是用控件拖出来的,后面板也是拖控件画出来的。
而GUI的显示界面是拖控件画出来的,其中一些属性参数要设置下,而后面的执行这些控件的都是写的M函数,即后面板都是要写代码的,这个比LABVIEW单纯的画程序要难,当然灵活性也大,不过个人感觉没一个简单的,都难呀。
至于上面控件的意思,怎么拖请自己看吧,若学过MFC或者WINDOWSFORMS的人就会很容易理解的,这之间是太像了,呵呵。
我们的目的是显示图片,并且显示需要的某一列的趋势图。
为了使人机交互更好点,我们可以使加载图片时和我们选择打开文件夹那样完成,即自己选择路径,而不用每次在M文件里改路径。
还有我们要求在加载图片完成时立马显示出这幅图片的大小信息,即多少行,多少列。
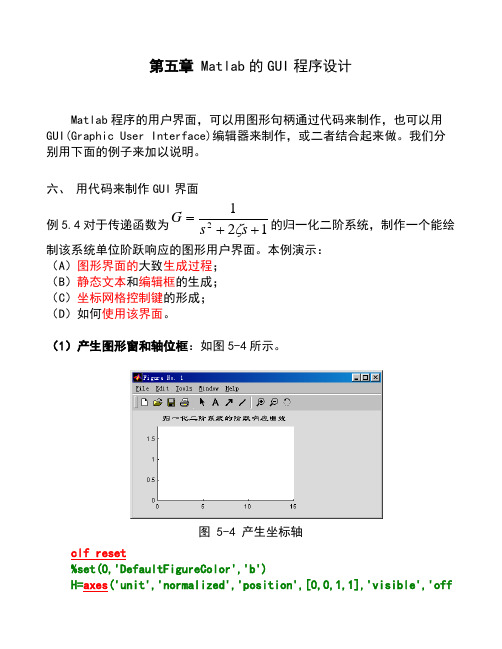
第五章 Matlab 的GUI 程序设计Matlab 程序的用户界面,可以用图形句柄通过代码来制作,也可以用GUI(Graphic User Interface)编辑器来制作,或二者结合起来做。
我们分别用下面的例子来加以说明。
六、 用代码来制作GUI 界面例5.4对于传递函数为1212++=s s G ζ的归一化二阶系统,制作一个能绘制该系统单位阶跃响应的图形用户界面。
本例演示:(A )图形界面的大致生成过程;(B )静态文本和编辑框的生成;(C )坐标网格控制键的形成;(D )如何使用该界面。
(1)产生图形窗和轴位框:如图5-4所示。
图 5-4 产生坐标轴 clf reset%set(0,'DefaultFigureColor','b')H=axes ('unit','normalized','position',[0,0,1,1],'visible','off'); %建立轴,并取轴句柄Hset(gcf,'currentaxes',H); %在当前图形窗口上安置坐标轴Hstr='\fontname{隶书}归一化二阶系统的阶跃响应曲线';text(0.12,0.93,str,'fontsize',13); %在H上,相对于左下角的取值h_fig=get(H,'parent'); %取H的父句柄h_fig=gcfset(h_fig,'unit','normalized','position',[0.1,0.2,0.7,0.4]);%设置图形窗口h_fig的位置[0.1,0.2,0.7,0.4](相对于屏幕)h_axes=axes('parent',h_fig,...'unit','normalized','position',[0.1,0.15,0.55,0.7],...'xlim',[0 15],'ylim',[0 1.8],'fontsize',8);%在H窗口上指定位置画新轴(2)在坐标框右侧生成作解释用的“静态文本”和可接收输入的“编辑框”:如图5-5所示。

MATLAB图像用户界面1、GUI入门示例(1)3种方式打开GUIDE开发环境:●在指令窗中运行guide指令。
●菜单:新建—>GUI。
●使用GUIDE按钮。
(2)使控件、组件图标带其名称一起显示,应采用以下步骤:●选择界面编辑器菜单项:File > Preference,引出GUIDE选项设置界面。
●勾选“show names in component palette”项。
(3)界面组件●GUI界面右下角“小黑块”,即“界面缩放句柄”●轴:点击“轴”图标,然后在工作区中的适当位置,拉出适当大小的“轴位框”,以供绘制响应曲线使用。
●静态文本框:;●可编辑文本框:;(4)界面组件参数的设置:●在”窗属性编辑器“设置:Resize on %图形窗是否可缩放Uints normalized %采用“归一化”单位计量窗口大小●“静态文本框”设置:FontUnits normalized %采用相对度量单位,缩放时保持字体比例FontSize 0.5 %字体大小String 归一化二阶系统的阶跃响应%Units normalized %采用相对度量单位,缩放时保持该区比例●轴:Box on %轴框封闭Units normalized %采用相对度量单位,缩放时保持比例XLim [0,15] %X轴范围YLim [0,2] %Y轴范围●可编辑文本框:FontUnits normalized %采用相对度量单位,缩放时保持字体比例FontSize 0.5 %字体大小String %删除缺省字符Units normalized %采用相对度量单位,缩放时保持该区比例(5)初步设计界面的保存在进行保存时,在指定的文件夹下会同时生成2个伴生文件ex0801.m和ex0801.fig。
(6)回调程序的编写Ex0801.m所包含的回调子函数函数体是空的。
插入下面代码:function edit1_Callback(hObject, eventdata, handles)% hObject handle to edit1 (see GCBO)% eventdata reserved - to be defined in a future version of MATLAB% handles structure with handles and user data (see GUIDATA)% Hints: get(hObject,'String') returns contents of edit1 as text% str2double(get(hObject,'String')) returns contents of edit1 as a doubleget(hObject,'String'); %从编辑框读取输入字符zeta=str2double(get(hObject,'String')); %把字符转换成双精度数handles.t=0:0.05:15; %定义时间采样数组handles.y=step(tf(1,[1,2*zeta,1]),handles.t); %计算响应cla %清空坐标轴line(handles.t,handles.y) %在已有轴上绘制曲线。

matlab练习(创建GUI)matlab创建GUI⽅法1:使⽤GUIDE菜单式操作在matlab中输⼊guide,可以打开guide创建GUI的图形界⾯,按菜单操作即可注:matlab未来版本可能会取消掉这种⽅式⽅法2:编写代码创建GUI下⾯是⼀个简单的以代码⽅式创建GUI的例⼦,其中关键的⼀些点包括1. 创建⼀个figure object作为container2. 通过`uicontrol`创建container内的控件,通过`'Callback'`属性关联回调函数3. 回调函数参数⼀般是由两部分组成`(source,eventdata,handles)`,分别表⽰引起回调产⽣的控件的handle和(点击)事件的数据function simple_gui2% SIMPLE_GUI2 Select a data set from the pop-up menu, then% click one of the plot-type push buttons. Clicking the button% plots the selected data in the axes.% Create and then hide the UI as it is being constructed.f = figure('Visible','off','Position',[360,200,450,285]);% Construct the components.hsurf = uicontrol('Style','pushbutton','String','Surf',...'Position',[315,220,70,25],...'Callback',{@surfbutton_Callback});hmesh = uicontrol('Style','pushbutton',...'String','Mesh','Position',[315,180,70,25],...'Callback',@meshbutton_Callback);hcontour = uicontrol('Style','pushbutton',...'String','Contour','Position',[315,135,70,25],...'Callback',@contourbutton_Callback);htext = uicontrol('Style','text','String','Select Data',...'Position',[325,90,60,15]);hpopup = uicontrol('Style','popupmenu',...'String',{'Peaks','Membrane','Sinc'},...'Position',[300,50,100,25],...'Callback',@popup_menu_Callback);ha = axes('Units','pixels','Position',[50,60,200,185]);align([hsurf,hmesh,hcontour,htext,hpopup],'Center','None');% Initialize the UI.% Change units to normalized so components resize automatically.f.Units = 'normalized';ha.Units = 'normalized';hsurf.Units = 'normalized';hmesh.Units = 'normalized';hcontour.Units = 'normalized';htext.Units = 'normalized';hpopup.Units = 'normalized';% Generate the data to plot.peaks_data = peaks(35);membrane_data = membrane;[x,y] = meshgrid(-8:.5:8);r = sqrt(x.^2+y.^2) + eps;sinc_data = sin(r)./r;% Create a plot in the axes.current_data = peaks_data;surf(current_data);% Assign a name to appear in the window title. = 'Simple GUI';% Move the window to the center of the screen.movegui(f,'center')% Make the UI visible.f.Visible = 'on';% Pop-up menu callback. Read the pop-up menu Value property to% determine which item is currently displayed and make it the% current data. This callback automatically has access to% current_data because this function is nested at a lower level. function popup_menu_Callback(source,eventdata) % Determine the selected data set. str = source.String; val = source.Value; % Set current data to the selected data set. switch str{val}; case 'Peaks' % User selects Peaks. current_data = peaks_data; case 'Membrane' % User selects Membrane. current_data = membrane_data; case 'Sinc' % User selects Sinc. current_data = sinc_data; end end% Push button callbacks. Each callback plots current_data in the% specified plot type. function surfbutton_Callback(source,eventdata) % Display surf plot of the currently selected data. surf(current_data); end function meshbutton_Callback(source,eventdata) % Display mesh plot of the currently selected data. mesh(current_data); end function contourbutton_Callback(source,eventdata) % Display contour plot of the currently selected data. contour(current_data); endendGUI展⽰⽅法3:利⽤AppDesigner和⽅法⼀的Guide类似总结我们有三种不同⽅式在matlab中创建简单的GUI程序,其中⽐较推荐的是使⽤编程的⽅式。

matlab gui 实例以下是一个简单的Matlab GUI实例,用于计算两个数的平均值:```matlabfunction myGUI% 创建主窗口fig = uifigure('Name', '计算平均值', 'Position', [100 100 300 200]);% 创建两个输入框和按钮input1 = uieditfield(fig, 'numeric', 'Position', [20 150 100 30]);input2 = uieditfield(fig, 'numeric', 'Position', [180 150 100 30]);button = uibutton(fig, 'Position', [120 100 60 30],'Text', '计算');% 添加按钮的回调函数button.ButtonPushedFcn = @(src,event)calculateAverage(src, input1, input2);end% 计算平均值的函数function calculateAverage(src, input1, input2)% 获取输入框的值num1 = input1.Value;num2 = input2.Value;% 计算平均值average = (num1 + num2) / 2;% 显示结果对话框uialert(src.Parent, sprintf('平均值为:%g', average), '结果', 'Icon', 'info');end```你可以将以上代码保存为一个.m文件,然后在Matlab命令窗口中运行`myGUI`函数,即可启动GUI应用程序。

题目要求:在窗口中添加“按钮”控件和“文本”控件,在按下按钮时,文本控件显示“this is my work”
1.在command widows中输入guide,调出guide控制窗口
2.在出现的窗口中新建一个空白的GUI,即BLANK GUI
3.拖入push button 控件和Edit Text 控件
4.设置Edit Text的属性string改成空白,style改成text, tag改为txthello
这是要注意tag是句柄的意思,句柄是编写程序时要用到的,看后边就知道了
5.保存文件,注意这里一定要先保存,文件名取为“c2figu1”保存之后才会有属性栏中callback 的变化
上图是没有保存时的callback
上图是保存后的callback
保存后弹出一个M文件编辑窗口,如下图。
注意这个窗口中的内容都是不可删除的。
6.在此M文件窗口中找到此段话:
在它的下边写入这段话:
set(handles.txthello,'string','this is my work');
然后保存
7.在command windows中输入文件名:c2figu1
出现如下窗口:
点击push botton,出现这样的情况:
OK!演示完成。
实验名称: Matlab GUI设计一、实验题目:自行设计一个GUI界面,在界面中描绘函数的图像。
基本要求:1)可以通过按钮,动态让该图像旋转起来2)可以通过输入文本框,控制该图像旋转的时间二、实验内容描绘函数:x=-10:0.1:10;y=-10:0.1:10;[xx,yy]=meshgrid(x,y);zz=sin(sqrt(xx.*xx.*xx+yy.*yy)).\sqrt(xx.*xx.*xx+yy.*yy); plot3(xx,yy,zz);旋转函数(1):axis vis3dshading facetedfor i=1:36camorbit(10,0,'camera')M=getframe(gcf);End旋转函数(2):for i=1:36camorbit(10,0)drawnowend控制时间函数:a=get(handles.txt,'String');t=2.*str2double(a);按钮修饰函数:I=imread('1.jpg');set(handles.pushbutton1,'cdata',I);I=imread('1.jpg');set(handles.pushbutton2,'cdata',I);附加功能(输出gif文件,可用于ppt)nn=frame2im(M);[nn,cm]=rgb2ind(nn,256);if i==1imwrite(nn,cm,'out.gif','gif','LoopCount',inf,'DelayTime',0.1);elseimwrite(nn,cm,‘out.gif’,‘gif’,‘WriteMode’,‘append’,‘DelayTime’,0.1); endGUI设计界面:三、实验分工:负责旋转函数,描绘函数,输出gif文件函数及GUI界面的设计执行,编写整理实验报告。
matlab gui界面设计实例
以下是一个简单的MATLAB GUI界面设计实例:
1. 打开MATLAB软件并创建一个新的GUI文件,首先需要添加一个静态文本标签来说明该程序的用途。
2. 在接下来的步骤中,我们将添加一个单选按钮和一组复选框,允许用户选择他们的喜好和选项。
3. 其他元素可添加日期选择器,文本框和按钮等等。
4. 最后,我们需要添加一个事件处理程序,以便处理用户点击“提交”按钮时的操作。
通过这样一个简单的实例,我们可以学习到MATLAB GUI界面的基本设计原则和步骤,以及如何处理用户交互事件并使用MATLAB功能实现功能。
基于MATLAB-GUI的简单计算器设计题目:计算器完成一个简单的计算器。
要求(但不限于):GUI上具有数字键盘输入区域,能够进行加、减、乘、除、三角函数等基础运算。
界面简洁、美观可能需要的控件:Push ButtonEdit TextPop-up Menu1 功能介绍本程序是一个简单的计算器程序,使用MATLAB软件编写完成。
主要具有加、减、乘、除、三角函数等基础运算,并通过GUI进行程序使用的交互。
程序交互界面如下:图1 程序的交互界面2 功能实现首先用MATLAB GUI功能,在绘制一个动态文本框和一个文本编辑框,以及25个命令按钮,调整好各控件大小、颜色,整体布局如图所示:备注:软件版本:MATLAB R2011b2.1 布局GUI1、打开MATLAB,在Guide中新建FIG文件2、然后双击“Blank GUI(Default)”或单击OK键出现GUI窗口3、添加按钮和动态文本框4、根据按钮的作用及视觉效果做一定的修改对按钮的字符串大小、颜色进行设置,对按钮的位置进行排布,尽量使按钮集中在动态文本框下面。
最终设置的动态文本框为灰色,其他按钮均为蓝色。
5、保存、添加功能函数将做好的按钮及动态文本框保存后自动弹出Editor的M文本,然后对相应的pushbutton添加功能函数。
以下是相应按钮的功能函数。
(1)数字按键编写。
在function pushbutton1_Callback(hObject, eventdata, handles)下输入:global jja=get(handles.edit1,'String');if(strcmp(a,'0.')==1)&&(jj==0)set(handles.edit1,'String','0.')elsea=strcat(a,'0')set(handles.edit1,'String',a)endjj=0这是使用句柄handles指向对象edit1,并以字符串形式来存储数据文本框edit1的内容,并存储数个“0”,然后由set(handles.edit1,'String',a)在edit1中输出。
Matlab 中Gui的应用小例什么都不说,先上图,后面带程序1111111111111function [] = GUI_1()% Demonstrate how to delete an entry from a uicontrol string.% Creates a listbox with some strings in it and a pushbutton. When user % pushes the pushbutton, the selected entry in the listbox will be deleted. %% Suggested exercise: Modify the GUI so when the user deletes a certain % string, the 'value' property is set to the previous string instead of to% the first string.%%% Author: Matt Fig% Date: 7/15/2009S.fh = figure('units','pixels',...'position',[500 500 200 260],...'menubar','none',...'name','GUI_1',...'numbertitle','off',...'resize','off');S.ls = uicontrol('style','list',...'unit','pix',...'position',[10 60 180 180],...'min',0,'max',2,...'fontsize',14,...'string',{'one';'two';'three';'four'});S.pb = uicontrol('style','push',...'units','pix',...'position',[10 10 180 40],...'fontsize',14,...'string','Delete String',...'callback',{@ed_call,S});function [] = ed_call(varargin)% Callback for pushbutton, adds new string from edit box.S = varargin{3}; % Get the structure.L = get(S.ls,{'string','value'}); % Get the users choice.% We need to make sure we don't try to assign an empty string.if ~isempty(L{1})L{1}(L{2}(:)) = []; % Delete the selected strings.set(S.ls,'string',L{1},'val',1) % Set the new string.End2222222222222222222function [] = GUI_2()% Demonstrate how to add a new entry to a uicontrol string.% Creates a listbox with some strings in it, an editbox and a pushbutton. % User types some text into the editbox, then pushes the pushbutton. The % user's text will be added to the top of the listbox.%% Suggested exercise: Modify the code so that hitting return after a% string is typed performs the same task as pushing the pushbutton.%%% Author: Matt Fig% Date: 7/15/2009S.fh = figure('units','pixels',...'position',[500 500 200 300],...'menubar','none',...'name','GUI_2',...'numbertitle','off',...'resize','off');S.ls = uicontrol('style','list',...'unit','pix',...'position',[10 110 180 180],...'min',0,'max',2,...'fontsize',14,...'string',{'one';'two';'three';'four'});S.ed = uicontrol('style','edit',...'unit','pix',...'position',[10 60 180 30],...'fontsize',14,...'string','New String');S.pb = uicontrol('style','push',...'units','pix',...'position',[10 10 180 40],...'fontsize',14,...'string','Add String',...'callback',{@ed_call,S});function [] = ed_call(varargin)% Callback for pushbutton, adds new string from edit box.S = varargin{3}; % Get the structure.oldstr = get(S.ls,'string'); % The string as it is now.addstr = {get(S.ed,'string')}; % The string to add to the stack.% The order of the args to cat puts the new string either on top or bottom. set(S.ls,'str',cat(1,addstr,oldstr{:})); % Put new string on top, OR:% set(S.ls,'str',cat(1,oldstr{:},addstr)); % Put new string on bottom. 3333333333333333333333function [] = GUI_3()% Demonstrate how to hide a uicontrol from the user.% Creates a textbox and a checkbox. The state of the checkbox determines % whether or not the textbox is visible.%%% Author: Matt Fig% Date: 7/15/2009S.fh = figure('units','pixels',...'position',[300 300 200 130],...'menubar','none',...'name','GUI_3',...'numbertitle','off',...'resize','off');S.tx = uicontrol('style','text',...'unit','pix',...'position',[10 70 180 40],...'string','Hello',...'backgroundcolor','r',...'fontsize',23);S.ch = uicontrol('style','check',...'unit','pix',...'position',[10 20 180 35],...'string',' Check2hide',...'fontsize',14);set(S.ch,'callback',{@ch_call,S}) % Set callback.function [] = ch_call(varargin)% Callback for pushbutton.S = varargin{3}; % Get the structure.switch get(S.tx,'visible')case 'on' % The text is visible, make it invisible.set(S.ch,'string',' Uncheck2show');set(S.tx,'visible','off')case 'off' % The text is invisible, make it visible.set(S.ch,'string',' Check2hide');set(S.tx,'visible','on')otherwise % This should never happen!disp('Matlab entered the twilight zone, aborting.')close(gcbf)quitend4444444444444444444444function [] = GUI_4()% Demonstrate how to make a multiline editbox.% Produces a GUI with an editbox on the left and a listbox on the right.% The user is invited to enter text into the editbox, either hitting return% at the end of each line or letting it wrap automatically. When the% button is pushed, each line of text from the editbox is placed as an% entry into the listbox. Notice the difference between how a wrapped line % is treated and a returned line is treated in the lisbox.%%% Author: Matt Fig% Date: 7/15/2009S.fh = figure('units','pixels',...'position',[450 450 400 200],...'menubar','none',...'name','Verify Password.',...'resize','off',...'numbertitle','off',...'name','GUI_4');S.ed = uicontrol('style','edit',...'units','pix',...'position',[10 60 190 120],...'min',0,'max',2,... % This is the key to multiline edits.'string',{'Enter text here'; 'then push the button.'},...'fontweight','bold',...'horizontalalign','center',...'fontsize',11);S.ls = uicontrol('style','list',...'units','pix',...'position',[210 60 180 120],...'backgroundcolor','w',...'HorizontalAlign','left');S.pb = uicontrol('style','push',...'units','pix',...'position',[10 10 380 40],...'HorizontalAlign','left',...'string','Transfer',...'fontsize',14,'fontweight','bold',...'callback',{@pb_call,S});uicontrol(S.ed) % Give the editbox control.function [] = pb_call(varargin)% Callback for edit.S = varargin{3};E = get(S.ed,'string'); % Get the editbox stringEc = cellstr(E); % Turn the character array into a cell array.set(S.ls,'string',Ec)6~~~~6666666666666666666666666666function [] = GUI_6()% Demonstrate how to update one uicontrol with data from others.% Creates two radiobuttons and a pushbutton. The pushbutton, when clicked % shows which radio button (or both or none) is currently selected. See% GUI_8 for similar radiobuttongroup GUI.%%% Author: Matt Fig% Date: 7/15/2009S.fh = figure('units','pixels',...'position',[400 400 120 100],...'menubar','none',...'name','GUI_6',...'numbertitle','off',...'resize','off');S.pb = uicontrol('style','push',...'unit','pix',...'position',[10 10 100 20],...'string','None Selected',...'tooltip','Push to find out which radio button is selected');S.rd(1) = uicontrol('style','rad',...'unit','pix',...'position',[10 40 100 20],...'string',' Button A');S.rd(2) = uicontrol('style','rad',...'unit','pix',...'position',[10 70 100 20],...'string',' Button B');set(S.pb,'callback',{@pb_call,S}); % Set the callback, pass hands.function [] = pb_call(varargin)% Callback for pushbutton.S = varargin{3}; % Get structure.R = [get(S.rd(1),'val'), get(S.rd(2),'val')]; % Get state of radios.str = 'Both selected'; % Default string.if R(1)==1 && R(2)==0str = 'A selected';elseif R(1)==0 && R(2)==1str = 'B selected';elseif ~any(R)str = 'None selected';endset(S.pb,'string',str) 77777777777777777777777777777777777777function [] = GUI_7()% Demonstrate how to store choice counters for multiple user choices.% Creates a popup with two choices and a textbox to display the number of % times each choice has been made.%%% Author: Matt Fig% Date: 7/15/2009S.fh = figure('units','pixels',...'position',[300 300 300 100],...'menubar','none',...'name','GUI_7',...'numbertitle','off',...'resize','off');S.tx = uicontrol('style','tex',...'unit','pix',...'position',[10 15 280 20],...'backgroundcolor',get(S.fh,'color'),...'fontsize',12,'fontweight','bold',...'string','OPTION 1: 0 OPTION 2: 0');S.pp = uicontrol('style','pop',...'unit','pix',...'position',[10 60 280 20],...'backgroundc',get(S.fh,'color'),...'fontsize',12,'fontweight','bold',...'string',{'option 1';'option 2'},'value',1);T = [0 0]; % Holds the number of times each option has been called. set(S.pp,'callback',{@pp_call,S}); % Set the callback.function [] = pp_call(varargin)% Callback for popupmenu.S = varargin{3}; % Get the structure.P = get(S.pp,'val'); % Get the users choice from the popup.T(P) = T(P) + 1; % Increment the counter.set(S.tx, 'string', sprintf('OPTION 1: %i OPTION 2: %i', T)); set(S.pp,'callback',{@pp_call,S}); % Save the new count. 888888888888888888888888888888888888888888888888888function [] = GUI_8()% Demonstrate how to tell which button in a uibuttongroup is selected.% Similar to GUI_6 except that a uibuttongroup which enforces exclusivity % is used.%% Suggested exercise: Make the editbox change the selected radiobutton. % Be sure to check that user input is valid.%%% Author: Matt Fig% Date: 7/15/2009S.fh = figure('units','pixels',...'position',[300 300 250 200],...'menubar','none',...'name','GUI_8',...'numbertitle','off',...'resize','off');S.bg = uibuttongroup('units','pix',...'pos',[20 100 210 90]);S.rd(1) = uicontrol(S.bg,...'style','rad',...'unit','pix',...'position',[20 50 70 30],...'string','Radio 1');S.rd(2) = uicontrol(S.bg,...'style','rad',...'unit','pix',...'position',[20 10 70 30],...'string','Radio 2');S.rd(3) = uicontrol(S.bg,...'style','rad',...'unit','pix',...'position',[120 50 70 30],...'string','Radio 3');S.rd(4) = uicontrol(S.bg,...'style','rad',...'unit','pix',...'position',[120 10 70 30],...'string','Radio 4');S.ed = uicontrol('style','edit',...'unit','pix',...'position',[100 60 50 30],...'string','1');S.pb = uicontrol('style','push',...'unit','pix',...'position',[75 20 100 30],...'string','Get Current Radio',...'callback',{@pb_call,S});function [] = pb_call(varargin)% Callback for pushbutton.S = varargin{3}; % Get the structure.% Instead of switch, we could use num2str on:% find(get(S.bg,'selectedobject')==S.rd) (or similar)% Note the use of findobj. This is because of a BUG in MATLAB, whereby if % the user selects the same button twice, the selectedobject property will% not work correctly.switch findobj(get(S.bg,'selectedobject'))case S.rd(1)set(S.ed,'string','1') % Set the editbox string.case S.rd(2)set(S.ed,'string','2')case S.rd(3)set(S.ed,'string','3')case S.rd(4)set(S.ed,'string','4')otherwiseset(S.ed,'string','None!') % Very unlikely I think.End999999999999999999999999999999999999999function [] = GUI_9()% Demonstrate one way to let the user know a process is running.% Creates a pushbutton which, when pushed, simulates some process running % in the background and lets the user know this is happening by a text and% color change. When the process is finished, the button returns to% normal.%%% Author: Matt Fig% Date: 7/15/2009S.fh = figure('units','pixels',...'position',[300 300 200 100],...'menubar','none',...'name','GUI_9',...'numbertitle','off',...'resize','off');S.pb = uicontrol('style','push',...'unit','pix',...'position',[20 20 160 60],...'string','Push Me',...'callback',{@pb_call},...'backgroundc',[0.94 .94 .94],...'busyaction','cancel',...% So multiple pushes don't stack.'interrupt','off');function [] = pb_call(varargin)% Callback for pushbutton.h = varargin{1}; % Get the caller's handle.col = get(h,'backg'); % Get the background color of the figure.set(h,'str','RUNNING...','backg',[1 .6 .6]) % Change color of button.% Here is where you put whatever function calls or processes that the% pushbutton is supposed to activate. Use pause to simulate a process. pause(1) % Simulate some process which takes time.set(h,'str','Push Me','backg',col) % Now reset the features. 10101010101111111111111111111111111111111111111111111111function [] = GUI_10()% Demonstrate how to control the mouse pointer from a GUI.% Just for fun, show how to manipulate the mouse pointer. To close the% figure, use the regular window x in the upper right corner.%%% Author: Matt Fig% Date: 7/15/2009S.fh = figure('units','pixels',...'position',[300 300 300 160],...'menubar','none',...'name','GUI_10',...'numbertitle','off',...'resize','off');S.UN = get(0,'units'); % We need to temporarily change this.S.pb = uicontrol('style','push',...'units','pix',...'position',[20 30 260 100],...'string', 'Push Me To Close Figure',...'fontsize',12,'fontweight','bold',...'callback',{@pb_call,S});set(S.fh,'WindowButtonMotionFcn',{@fh_wbmf,S})function [] = fh_wbmf(varargin)S = varargin{3}; % Get the structure.set(0,'units','normalized') % Temporary, see below.% Move the mouse pointer to a random position.set(0, 'PointerLocation', [rand rand])set(0,'units',S.UN) % Undo change to user's system. Good courtesy. 11111111111111111111111111111111111111111111111111111111111111111111 function [] = GUI_11()% Demonstrate how to display & change a slider's position with an edit box. % Slide the slider and it's position will be shown in the editbox.% Enter a valid number in the editbox and the slider will be moved to that% position. If the number entered is outside the range of the slider,% the number will be reset.%%% Author: Matt Fig% Date: 7/15/2009S.fh = figure('units','pixels',...'position',[300 300 300 100],...'menubar','none',...'name','GUI_11',...'numbertitle','off',...'resize','off');S.sl = uicontrol('style','slide',...'unit','pix',...'position',[20 10 260 30],...'min',1,'max',100,'val',50);S.ed = uicontrol('style','edit',...'unit','pix',...'position',[20 50 260 30],...'fontsize',16,...'string','50');set([S.ed,S.sl],'call',{@ed_call,S}); % Shared Callback.function [] = ed_call(varargin)% Callback for the edit box and slider.[h,S] = varargin{[1,3]}; % Get calling handle and structure.switch h % Who called?case S.edL = get(S.sl,{'min','max','value'}); % Get the slider's info.E = str2double(get(h,'string')); % Numerical edit string.if E >= L{1} && E <= L{2}set(S.sl,'value',E) % E falls within range of slider.elseset(h,'string',L{3}) % User tried to set slider out of range.endcase S.slset(S.ed,'string',get(h,'value')) % Set edit to current slider.otherwise% Do nothing, or whatever.End 1212121212111111111111111111111111111111111111111111111111111 function [] = GUI_12()% Demonstrate colored text in a listbox, & how extract user's choice.% Creates a listbox which has words of different colors. When the% pushbutton is pushed, the users choice is printed to the screen.% Notice the use of the 'listboxtop' property in the callback.%%% Author: Matt Fig% Date: 7/15/2009S.fh = figure('units','pixels',...'position',[300 300 230 40],...'menubar','none',...'name','GUI_12',...'numbertitle','off',...'resize','off');% We will get different colors by using HTML.STR = {'<HTML><FONT COLOR="#66FF66">Green</BODY></HTML>',...'<HTML><FONT COLOR="red">Red</FONT></HTML>',...'<HTML><FONT COLOR="blue">Blue</FONT></HTML>',...'<HTML><FONT COLOR="#FF00FF">violet</FONT></HTML>',...'<HTML><FONT COLOR="black">Black</FONT></HTML>',...'<HTML><FONT COLOR="yellow">Yellow</FONT></HTML>'}; S.COL = {'Green','Red','Blue','Violet','Black','Yellow'}; % Lookup table.S.ls = uicontrol('style','list',...'units','pix',...'position',[10 10 90 20],...'string', STR,...'fontsize',10);S.pb = uicontrol('style','push',...'units','pix',...'posit',[120 10 100 20],...'string', 'Print Choice',...'callback',{@pb_call,S});function [] = pb_call(varargin)% Callback for pushbutton. Displays user's choice at command line.S = varargin{3}; % Get structure.% If the 'value' property was used below, the user's choice might not show% correctly if the selection was made with the arrows on the listbox.L = get(S.ls,'listboxtop'); % Get the user's choice.disp(['Your color choice is: ' S.COL{L}]) % Print to command line. 131313131111111111111111111111111111111111111111111111111111111111 function [] = GUI_13()% Demonstrate an edit text which has copyable but unchangeable text.% Also creates a pushbutton which will print the contents of the% editbox to the command line.%% Suggested exercise: Notice that the text can be cut (as well as copied).% Alter the keypressfcn to eliminate this.%% Author: Matt Fig% Date: 7/15/2009S.fh = figure('units','pixels',...'position',[300 300 400 120],...'menubar','none',...'name','GUI_13',...'numbertitle','off',...'resize','off');S.ed = uicontrol('style','edit',...'unit','pix',...'position',[30 70 340 30],...'string','This text can be copied but not changed');S.pb = uicontrol('style','push',...'unit','pix',...'position',[30 30 340 30],...'string','Print to screen');set([S.ed,S.pb],{'callback'},{{@ed_call,S};{@pb_call,S}}) % Set callbacks. set(S.ed,'keypressfcn',{@ed_kpfcn,S}) % set keypressfcn.function [] = pb_call(varargin)% callback for pushbuttonS = varargin{3}; % Get the structure.disp(get(S.ed,'string')) % Print to the command line.function [] = ed_call(varargin)% Callback for editS = varargin{3}; % Get the structure.set (S.ed,'string','This text can be copied but not changed');function [] = ed_kpfcn(varargin)% Keypressfcn for edit[K,S] = varargin{[2 3]};if isempty(K.Modifier)uicontrol(S.pb)set (S.ed,'string','This text can be copied but not changed');elseif ~strcmp(K.Key,'c') && ~strcmp(K.Modifier{1},'control')uicontrol(S.pb)set (S.ed,'string','This text can be copied but not changed');end 14141414111111111111111111111111111111111111111111111111111111 function [] = GUI_35()% Demonstrate how to save and load the state of a GUI system.% Creates a GUI which allows the user to plot one of four types of% polynomials. When the pushbutton is pressed, a new GUI is created which% displays the coefficients used to create the polynomial, and another% figure is made which plots the polynomial over a simple range. The main % GUI has two menus which allow the user to save the state of the system% and load the state of the system.%% Suggested exercise: Modify the code so that the coefficients in the% second GUI can be user defined. You will have to ensure that the% radiobutton in the first GUI accurately reflects the user's choice, and% the plot gets updated after the edit.%%% Author: Matt Fig% Date: 7/30/09%S.X = -10:.01:10; % The X values for plotting.S.fh = figure('units','pixels',...'position',[200 250 250 200],...'menubar','none',...'name','GUI_35',...'numbertitle','off',...'resize','off',...'closerequestfcn',{@fh_crfcn});S.bg = uibuttongroup('units','pix',...'pos',[20 70 210 90]);S.rd(1) = uicontrol(S.bg,...'style','rad',...'unit','pix',...'position',[20 50 70 30],...'string','Linear');S.SEL = 1; % The selectedobject property of S.bgS.rd(2) = uicontrol(S.bg,...'style','rad',...'unit','pix',...'position',[20 10 70 30],...'string','Quadratic');S.rd(3) = uicontrol(S.bg,...'style','rad',...'unit','pix',...'position',[120 50 70 30],...'string','Cubic');S.rd(4) = uicontrol(S.bg,...'style','rad',...'unit','pix',...'position',[120 10 70 30],...'string','Quartic');S.pb = uicontrol('style','push',...'unit','pix',...'position',[75 20 100 30],...'string','Plot & Get Coeffs',...'callback',{@pb_call});S.fm = uimenu(S.fh,...'label','Save State',...'callback',{@fm_call},...'enable','off');S.fm(2) = uimenu(S.fh,...'label','Load State',...'callback',{@fm_call},...'enable','on');function [] = pb_call(varargin)% Callback for the pushbutton.S.RP = round((rand(1,5)*5-rand(1,5)*5)*100)/100; % Ran polynomial.sel = findobj(get(S.bg,'selectedobject')); % See BUG note in GUI_8S.SEL = find(S.rd==sel); % Store current radiobutton.set(S.fm,{'enable'},{'on';'off'}) % Switch available menu ops.switch selcase S.rd(1) % LinearS.RP(1:3) = 0;S.COL = 'r';case S.rd(2) % QuadraticS.RP(1:2) = 0;S.COL = 'k';case S.rd(3) % CubicS.RP(1) = 0;S.COL = 'b';case S.rd(4) % QuarticS.COL = 'm';otherwise% Very unlikely I think.endS.STR = num2str(S.RP','%3.2f'); % Get a string representation.if length(S.fh)==1 % We haven't been here before.% This is where we make the other two figures.S.fh(2) = figure('name','GUI_35_Plotter',...'numbertitle','off',...'closerequestfcn',{@fh_crfcn});S.ax = axes;S.fh(3) = figure('units','pixels',...'position',[470 250 250 230],...'name','GUI_35_Fitter',...'menubar','none',...'numbertitle','off',...'closerequestfcn',{@fh_crfcn});S.tx = uicontrol('units','pixels',...'style','text',...'unit','pix',...'position',[20 185 210 25],...'string','Ax^4 + Bx^3 + Cx^2 + Dx + E',...'fontweight','bold',...'backgroundcolor',get(S.fh(3),'color'));S.ed(1) = uicontrol('units','pixels',...'style','edit',...'unit','pix',...'position',[50 10 150 25]);S.ed(2) = uicontrol('units','pixels',...'style','edit',...'unit','pix',...'position',[50 45 150 25]);S.ed(3) = uicontrol('units','pixels',...'style','edit',...'unit','pix',...'position',[50 80 150 25]);S.ed(4) = uicontrol('units','pixels',...'style','edit',...'unit','pix',...'position',[50 115 150 25]);S.ed(5) = uicontrol('units','pixels',...'style','edit',...'unit','pix',...'position',[50 150 150 25]);end% Display polynomial coefficients.set(S.ed(1),'string',['E = ',S.STR(5,:)]);set(S.ed(2),'string',['D = ',S.STR(4,:)]);set(S.ed(3),'string',['C = ',S.STR(3,:)]);set(S.ed(4),'string',['B = ',S.STR(2,:)]);set(S.ed(5),'string',['A = ',S.STR(1,:)]);。
Matlab GUI编程教程(适用于初学者)
1.首先我们新建一个GUI文件:File/New/GUI 如下图所示;
选择Blank GUI(Default)
2.进入GUI开发环境以后添加两个编辑文本框,6个静态文本框,和一个按钮,布置如下
图所示;
布置好各控件以后,我们就可以来为这些控件编写程序来实现两数相加的功能了。
3.我们先为数据1文本框添加代码;
点击上图所示红色方框,选择edit1_Callback,光标便立刻移到下面这段代码的位置。
1.
2.
3.function edit1_Callback(hObject, eventdata, handles)
4.% hObject handle to edit1 (see GCBO)
5.% eventdata reserved - to be defined in a future version of MATLAB
6.% handles structure with handles and user data (see GUIDATA)
7.% Hints: get(hObject,'String') returns contents of edit1 as text
8.% str2double(get(hObject,'String')) returns contents of edit1 as a double
复制代码
然后在上面这段代码的下面插入如下代码:
1.
2.%以字符串的形式来存储数据文本框1的内容. 如果字符串不是数字,则现实空白内容input =
str2num(get(hObject,'String')); %检查输入是否为空. 如果为空,则默认显示为0if
(isempty(input)) set(hObject,'String','0')endguidata(hObject, handles);
复制代码
这段代码使得输入被严格限制,我们不能试图输入一个非数字。
4.为edit2_Callback添加同样一段代码
5
现在我们为计算按钮添加代码来实现把数据1和数据2相加的目的。
用3中同样的方法在m文件中找到pushbutton1_Callback代码段
如下;
1.function pushbutton1_Callback(hObject, eventdata, handles)
2.% hObject handle to pushbutton1 (see GCBO)
3.% eventdata reserved - to be defined in a future version of MATLAB
4.% handles structure with handles and user data (see GUIDATA)
复制代码
在上面这段代码后添加以下代码;
1. a = get(handles.edit1,'String');
2. b = get(handles.edit12,'String');
3.% a and b are variables of Strings type, and need to be converted
4.% to variables of Number type before they can be added together total = str2num(a) + str2num(b);
5. c = num2str(total);
6.% need to convert the answer back into String type to display it
7.set(handles.text1,'String',c);
8.guidata(hObject, handles);
复制代码
下面我们来对上面这段程序分析一下;
1. a = get(handles.edit1,'String'); b = get(handles.edit2,'String');
复制代码
上面这行代码把用户输入的数据存入到变量a,变量b中;
1.% a,b是字符型变量,在计算两者相加之前需把他们转换为数字型total = str2num(a) + str2num(b);
复制代码
这段代码实现两数相加c = num2str(total);
1.set(handles.text3,'String',c);guidata(hObject, handles);
复制代码
以上两行代码分别用来更新计算结果文本框和图形对象句柄,一般Callback回调函数都以guidata(hObject, handles);j结束以更新数据
程序运行如下:
下载 (11.15 KB)
2009-5-31 22:19。