C++_CHAP5
- 格式:ppt
- 大小:144.00 KB
- 文档页数:73


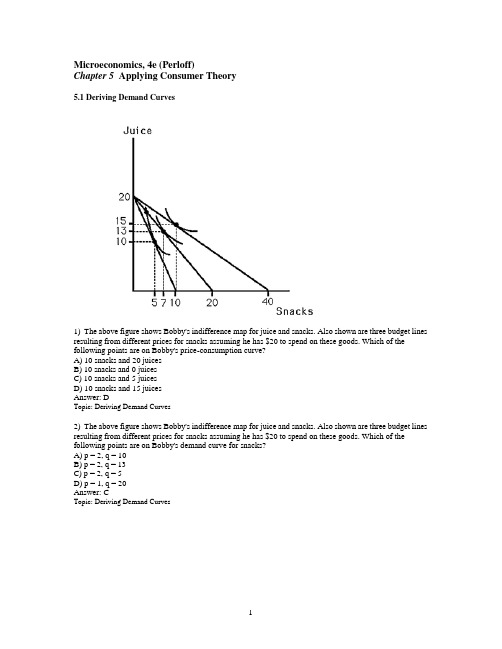
Microeconomics, 4e (Perloff)Chapter 5 Applying Consumer Theory5.1 Deriving Demand Curves1) The above figure shows Bobby's indifference map for juice and snacks. Also shown are three budget lines resulting from different prices for snacks assuming he has $20 to spend on these goods. Which of the following points are on Bobby's price-consumption curve?A) 10 snacks and 20 juicesB) 10 snacks and 0 juicesC) 10 snacks and 5 juicesD) 10 snacks and 15 juicesAnswer: DTopic: Deriving Demand Curves2) The above figure shows Bobby's indifference map for juice and snacks. Also shown are three budget lines resulting from different prices for snacks assuming he has $20 to spend on these goods. Which of the following points are on Bobby's demand curve for snacks?A) p = 2, q = 10B) p = 2, q = 13C) p = 2, q = 5D) p = 1, q = 20Answer: CTopic: Deriving Demand Curves3) The above figure shows Bobby's indifference map for juice and snacks. Also shown are three budget lines resulting from different prices for snacks. This information could be used to determineA) the slope of Bobby's demand curve for juice.B) the amount by which Bobby's demand curve for juice shifts when his income rises.C) the amount by which Bobby's demand curve for juice shifts when the price of snacks rises.D) All of the above.Answer: CTopic: Deriving Demand Curves4) The above figure shows Bobby's indifference map for juice and snacks. Also shown are three budget lines resulting from different prices for snacks. As the price of snacks rises, Bobby's utilityA) stays the same.B) increases.C) decreases.D) might change, but there is not enough information to determine.Answer: CTopic: Deriving Demand Curves5) The above figure shows Bobby's indifference map for juice and snacks. Also shown are three budget lines resulting from different prices for snacks. Bobby's demand for snacks isA) unit elastic.B) elastic.C) inelastic.D) perfectly elastic.Answer: CTopic: Deriving Demand Curves6) The above figure shows Bobby's indifference map for juice and snacks. Also shown are three budget lines resulting from different prices for snacks. As the price of snacks rises, the price for juiceA) stays the same.B) increases.C) decreasesD) might change, but there is not enough information to determine.Answer: ATopic: Deriving Demand Curves7) An individual's demand curve for a good can be derived by measuring the quantities selected asA) the price of the good changes.B) the price of substitute goods changes.C) income changes.D) All of the above.Answer: ATopic: Deriving Demand Curves8) As the price of a good rises, the consumer will experienceA) a desire to consume a different bundle.B) a decrease in utility.C) a southwesterly movement on the indifference map.D) All of the above.Answer: DTopic: Deriving Demand Curves9) An increase in the price of a good causesA) a change in the slope of the budget line.B) an increase in the consumption of that good.C) a rightward shift of the demand curve for that good.D) a parallel rightward shift of the budget line.Answer: ATopic: Deriving Demand Curves10) Suppose a graph is drawn to show a consumer's preferences for football tickets and basketball tickets. The quantity of football tickets is measured on the horizontal axis. If the price-consumption curve is horizontal when the price of football tickets changes, thenA) football tickets are an inferior good.B) the demand for football tickets is perfectly elastic.C) the demand for football tickets is unit elastic.D) the demand curve for football tickets will be horizontal.Answer: CTopic: Deriving Demand Curves11) In the relevant price range a demand curve for a Giffen good would beA) upward sloping.B) downward sloping.C) horizontal.D) vertical.Answer: ATopic: Deriving Demand Curves12) Suppose the quantity of x is measured on the horizontal axis. If the price consumption curve is vertical when the price of x changes, then the demand for x isA) perfectly elastic.B) perfectly inelastic.C) unit elastic.D) There is not enough information to determine the price elasticity of demand for x.Answer: BTopic: Deriving Demand CurvesFor the following, please answer "True" or "False" and explain why.13) If the price-consumption curve is upward sloping when the price of the good measured on the horizontal axis changes, then the demand curve for that good will be upward sloping.Answer: False. An upward-sloping price-consumption curve indicates that as the price of the good falls, more of both goods will be purchased. So, the demand curve for the good measured on the horizontal axis slopes downward.Topic: Deriving Demand Curves14) Draw two graphs, one directly above the other. On the upper graph, label the vertical axis Good X and label the horizontal axis Good Y. On the lower graph, label the vertical axis the Price of good Y and label the horizontal axis Good Y. In the upper graph, show the income and substitution effects of a decrease in the Price of good Y when Y is a Giffen good. Draw the corresponding demand curve for Good Y in the lower graph.Answer:See the above figure. Point A is the original consumption point. The movement from point A to point B is the substitution effect. The movement from point B to point C is the income effect.Topic: Deriving Demand Curves15) The above figure shows a consumer's indifference curves for soda and all other goods. Assuming a budget of $100, derive the consumer's demand for soda for prices of $4 and $10 per case of soda. Estimate the price elasticity of demand for soda.Answer: At a price of $4, 15 cases are purchased, At a price of $10, 6 cases are purchased. In both cases, the same total amount, $60, is spent on soda. This implies unit elasticity.Topic: Deriving Demand Curves16) Use the Slutsky equation to show that a Giffen good must be an inferior good, BUT an inferior good need not be a Giffen good.Answer: The Slutsky equation may be written as dQ/dp Total dp Total = dQ/ dp subs - _(dQ/dI). For a Giffen good, dQ/dp Total is positive, which implies that - _(dQ/dI) must be positive and large enough to offset dQ/ dp subs, which is always negative. For any inferior good, however, - _(dQ/dI) is positive but not necessarily large enough to make dQ/ dp Total positive.Topic: Deriving Demand Curves5.2 How Changes in Income Shift Demand Curves1) A movement upward along an upward sloping Engel curve corresponds toA) upward sloping indifference curves.B) crossing indifference curves.C) a rotation in the budget constraint.D) a parallel shift in the budget constraint.Answer: DTopic: How Changes in Income Shift Demand Curves2) When deriving an Engel curve the prices of both goodsA) are held constant.B) increase by the same percentage as income.C) decrease by the same percentage as income.D) can either decrease, increase or stay the same.Answer: ATopic: How Changes in Income Shift Demand Curves3) The above figure shows Larry's indifference map and budget lines for ham and pork. Which of the following statements is TRUE?A) Pork is an inferior good.B) Ham is an inferior good.C) Neither pork nor ham is an inferior good.D) Both ham and pork are inferior goods.Answer: BTopic: How Changes in Income Shift Demand Curves4) The above figure shows Larry's indifference map and budget lines for ham and pork. Which of the following statements is TRUE?A) Larry's Engel curve for pork will be upward sloping.B) Larry's Engel curve for pork will be downward sloping.C) Larry's Engel curve for pork will be backward bending.D) Larry's Engel curve for pork cannot be derived from the information provided.Answer: ATopic: How Changes in Income Shift Demand Curves5) The above figure shows Larry's indifference map and budget lines for ham and pork. Which of the following statements is TRUE?A) Larry's demand curve for pork shifts rightward when his income increases.B) Larry's income elasticity of demand for pork is greater than zero.C) Pork is a normal good.D) All of the above.Answer: DTopic: How Changes in Income Shift Demand Curves6) After Joyce and Larry purchased their first house, they made additional home improvements in response to increases in income. After a while, their income rose so much that they could afford a larger home. Once they realized they would be moving, they reduced the amount of home improvements. Their Engel curve for home improvements on their current home isA) negatively sloped.B) flat.C) positively sloped.D) backward bending.Answer: DTopic: How Changes in Income Shift Demand Curves7) Suppose the quantity of x is measured on the horizontal axis. If the income consumption curve is vertical, then the income elasticity of demand for x isA) 0.B) 1.C) -1.D) There is not enough information to determine the income elasticity of demand for x.Answer: ATopic: How Changes in Income Shift Demand Curves8) An inferior good exhibitsA) a negative income elasticity.B) a downward sloping Engel curve.C) a decline in the quantity demanded as income rises.D) All of the above.Answer: DTopic: How Changes in Income Shift Demand Curves9) When John's income was low, he could not afford to dine out and would respond to a pay raise by purchasing more frozen dinners. Now that his income is high, a pay raise causes him to dine out more often and buy fewer frozen dinners. Which graph in the above figure best represents John's Engel curve for frozen dinners?A) Graph AB) Graph BC) Graph CD) Graph DAnswer: ATopic: How Changes in Income Shift Demand Curves10) When John's income was low, he could not afford to dine out and would respond to a pay raise by purchasing more frozen dinners. Now that his income is high, a pay raise causes him to dine out more often and buy fewer frozen dinners. Which graph in the above figure best represents John's Engel curve for dining out?A) Graph AB) Graph BC) Graph CD) Graph DAnswer: BTopic: How Changes in Income Shift Demand Curves11) Even though Mary's income is very low, she makes sure that she purchases enough milk for her family to drink. As her income rises, she does buy more milk. Which graph in the above figure best represents Mary's Engel curve for milk?A) Graph AB) Graph BC) Graph CD) Graph DAnswer: CTopic: How Changes in Income Shift Demand Curves12) When John was in college and his income was low, he drank "Red Ribbon" beer. As his income increased, he purchased better-quality beer and less "Red Ribbon." Which graph in the above figure best represents John's Engel curve for "Red Ribbon" beer?A) Graph AB) Graph BC) Graph CD) Graph DAnswer: DTopic: How Changes in Income Shift Demand Curves13) Which graph in the above figure best represents a good that is an inferior good at some income levels, and a normal good at other income levels?A) Graph AB) Graph BC) Graph CD) Graph DAnswer: ATopic: How Changes in Income Shift Demand Curves14) If consumer income and prices increase by the same percentageA) the consumer will buy more of both goods.B) the consumer will buy more of both goods if they are both normal goods.C) the consumer will buy less of both goods if they are both inferior goods.D) the consumer's utility maximizing bundle stays the same.Answer: DTopic: How Changes in Income Shift Demand CurvesFor the following, please answer "True" or "False" and explain why.15) An increase in income (all else equal) will ALWAYS lead to a parallel shift of the budget line. Answer: True. Since prices are unchanged the relative prices of the goods stays the same and thus the slope of the budget line.Topic: How Changes in Income Shift Demand Curves16) Explain what the slope of the income consumption curve shows about the income elasticity of demand. Answer: A positive slope of the income consumption curve is associated with a positive income elasticity of demand, and a negatively sloped income consumption curve is associated with a negative income elasticity of demand. The income consumption curve represents how consumption changes with an increase in income. An upward sloping income consumption curve represents an increase in consumption as income rises, as does a positive income elasticity.Topic: How Changes in Income Shift Demand Curves17) Why can't all goods be inferior?Answer: If all goods were inferior, an increase in income would lead to a decline in the quantity demanded for all goods. This, however, would leave the consumer below the budget line and therefore not achieving the highest utility possible.Topic: How Changes in Income Shift Demand Curves18) The above figure shows three different Engel curves. Rank them in terms of income elasticity. Answer: Engel curve A implies that a certain level of income is required before any of the good is purchased. Engel curve B implies that the quantity demanded is proportional to income (unit elastic). Engel curve C implies that the good is a necessity since it would be consumed even if income were zero. Thus _A > _B > _C.Topic: How Changes in Income Shift Demand Curves19) When income increases by 1%, the quantity demanded of a good decreases by 2%. What is the income elasticity of the good? Is the good normal or inferior? Why?Answer: The income elasticity is -2. The good is inferior because the income elasticity is negative.Topic: How Changes in Income Shift Demand Curves20) Why would you expect the demand for diamond jewelry to fall faster than plastic, costume jewelry when all incomes fall?Answer: The income elasticities differ for the two goods. Diamond jewelry most likely has a larger income elasticity than costume jewelry.Topic: How Changes in Income Shift Demand Curves21) Draw budget constraints, indifference curves, and the income consumption curve for a good that has an income elasticity that is perfectly inelastic.Answer:See the above figure.Topic: How Changes in Income Shift Demand Curves5.3 Effects of a Price Change1) Median household income is $50,000 per year. The typical household spends about $125 per year on milk, which has an income elasticity of about 0.07. From this information, we can conclude thatA) milk is a luxury.B) milk is a Giffen good.C) the income effect from a change in the price of milk is very large.D) the income effect from a change in the price of milk is very small.Answer: DTopic: Effects of a Price Change2) When the price of a good changes, the total effect of the price change on the quantities purchased can be found by comparing the quantities purchasedA) on the old budget line and the new budget line.B) on the original indifference curve when faced with the original prices and when faced with the new prices.C) on the new budget line and a hypothetical budget line that is a parallel shift back to the original indifference curve.D) on the new indifference curve.Answer: ATopic: Effects of a Price Change3) When the price of a good changes, the substitution effect can be found by comparing the equilibrium quantities purchasedA) on the old budget line and the new budget line.B) on the original indifference curve when faced with the original prices and when faced with the new prices.C) on the new budget line and a hypothetical budget line that is a shift back to the original indifference curve parallel to the new budget line.D) on the new indifference curve.Answer: BTopic: Effects of a Price Change4) When the price of a good changes, the income effect can be found by comparing the equilibrium quantities purchasedA) on the old budget line and the new budget line.B) on the original indifference curve when faced with the original prices and when faced with the new prices.C) on the new budget line and a hypothetical budget line that is a shift back to the original indifference curve parallel to the new budget line.D) on the new indifference curve.Answer: CTopic: Effects of a Price Change5) The substitution effect can be measured holding ________ constant.A) incomeB) utilityC) the price of one goodD) the price of all goodsAnswer: BTopic: Effects of a Price Change6) Suppose that frozen dinners were once a normal good for John, but now frozen dinners are an inferior good for him. John's demand curve for frozen dinnersA) has become steeper as a result.B) has become flatter as a result.C) has not changed as a result.D) has disappeared as a result.Answer: ATopic: Effects of a Price Change7) One characteristic of a Giffen good is that itA) is a luxury good.B) is an inferior good.C) has an upward-sloping Engel curve.D) All of the above.Answer: BTopic: Effects of a Price Change8) A Giffen good hasA) a positive substitution effect.B) a negative income effect.C) a larger income effect than substitution effect.D) All of the above.Answer: DTopic: Effects of a Price Change9) If a good is an inferior good, then itsA) demand curve will be upward sloping.B) income effect reinforces the substitution effect.C) income elasticity is negative.D) Engel curve cannot be drawn.Answer: CTopic: Effects of a Price Change10) Suppose Lisa spends all of her money on books and coffee. When the price of coffee decreases, theA) substitution effect on coffee is positive, and the income effect on coffee is positive.B) substitution effect on coffee is ambiguous, and the income effect on coffee is ambiguous.C) substitution effect on coffee is positive, and the income effect on coffee is ambiguous.D) substitution effect on coffee is ambiguous, and the income effect on coffee is positive.Answer: CTopic: Effects of a Price Change11) In the case of a normal goodA) demand curves always slope downward.B) the income effect and substitution effect are in the same direction.C) the Engel curve slopes upward.D) All of the above.Answer: DTopic: Effects of a Price Change12) The above figure shows Bobby's indifference map for soda and juice. B1 indicates his original budget line. B2 indicates his budget line resulting from a decrease in the price of soda. What change in quantity best represents his substitution effect?A) 3B) 10C) 15D) 7Answer: ATopic: Effects of a Price Change13) The above figure shows Bobby's indifference map for soda and juice. B1 indicates his original budget line. B2 indicates his budget line resulting from a decrease in the price of soda. What change in quantity best represents his income effect?A) 3B) 10C) 15D) 7Answer: DTopic: Effects of a Price Change14) The above figure shows Bobby's indifference map for soda and juice. B1 indicates his original budget line. B2 indicates his budget line resulting from an increase in the price of soda. From the graph, one can conclude thatA) Bobby views soda as an inferior good.B) Bobby's demand for soda is perfectly inelastic.C) Bobby views soda as a normal good.D) the income elasticity of demand for soda is 1.Answer: CTopic: Effects of a Price Change15) When measuring the substitution effect one uses the change alongA) the old indifference curve.B) the new indifference curve.C) either the old or the new indifference curve.D) the budget constraint.Answer: CTopic: Effects of a Price Change16) The Slutsky equation shows that, holding the total effect constant, the income effect will be larger for goods thatA) have a smaller substitution effect.B) make up a larger percentage of a household's budget.C) have perfectly inelastic demand curves.D) All of the above.Answer: BTopic: Effects of a Price Change17) Suppose that the interest rate paid to savers increases. As a result, Tom wishes to save less. This suggests that, for Tom,A) the substitution effect is greater than the income effect.B) the income effect is greater than the substitution effect.C) utility maximization is not occurring.D) future consumption is a luxury.Answer: BTopic: Effects of a Price Change18) Suppose that the interest rate paid to savers increases. As a result, Tom wishes to save more. This suggests that, for Tom,A) the substitution effect is greater than the income effect.B) the income effect is greater than the substitution effect.C) utility maximization is not occurring.D) future consumption is a luxury.Answer: ATopic: Effects of a Price ChangeFor the following, please answer "True" or "False" and explain why.19) If a consumer is compensated for the income effect that occurs when the price of a good increases, then his demand curves can never slope upward.Answer: True. The demand curve would only include the substitution effect. Even for Giffen goods, dq/dp is negative holding utility constant.Topic: Effects of a Price Change20) A good may be inferior at some income levels and normal at others.Answer: True. A consumer may demand more of the good at low income levels and less of the good at higher income levels. Hamburger or macaroni and cheese dinners may be examples of such goods.Topic: Effects of a Price Change21) If the Engel curve for a good is upward sloping, the demand curve for that good must be downward sloping.Answer: True. If the Engel curve is upward sloping, the good is normal. As a result, the income effect will reinforce the substitution effect and guarantee a downward-sloping demand curve.Topic: Effects of a Price Change22) Suppose Joe earns $1,000 in year 1 and $0 in year 2. Any amount he saves will earn interest at a rate of 10%. Draw Joe's budget line. (Hint: He can either consume all $1000 this year or consume nothing this year and have $1,100 next year.) Assuming convex indifference curves, show that an increase in the rate of interest can cause Joe's savings to either increase or decrease. Explain in terms of income and substitution effect.Answer:See the above figure. On the graph, his original bundle is e1 so that his savings equal 1000 - C1*. A higher interest rate rotates the budget line so that, depending on the shape of his indifference map, he may choose either e2, which means savings increase, or e3, which means savings decrease. One plus the interest rate represents the price of current consumption. A higher interest rate has two effects. The substitution effect means that Joe will save more because current consumption has become more expensive. The income effect says Joe will save less because, with the higher interest rate, lower savings could actually generate more future consumption.Topic: Effects of a Price Change23) Many manufacturers sell products labeled as having imperfections at a discount at their factory outlets but do not ship these imperfect goods to regular retail outlets. Why?Answer: There is some substitutability between the goods, but imperfects sell for a lower price. Suppose, for example, the good sells for $2, but imperfects sell for $1. Both goods cost the same to ship, say $1. As a result, the relative price of an imperfect at a factory outlet is (1/2) but rises to (2/3) at the retail outlet, where imperfects will not sell because of the higher relative price.Topic: Effects of a Price Change5.4 Cost-of-Living Adjustments1) Due to inflation, nominal prices are usuallyA) equal to real prices.B) smaller than real prices.C) larger than real prices.D) a constant proportion different from real prices.Answer: CTopic: Cost-of-Living Adjustments2) A consumer price index adjustment overcompensates for inflation because it ignoresA) the income effect when relative prices change.B) the substitution effect when relative prices change.C) that some goods are inferior.D) that the substitution effect may offset the income effect.Answer: BTopic: Cost-of-Living Adjustments3) Employing a fixed-weight index like the Consumer Price Index to adjust a person's salary in response to inflation will overcompensate this person because doing so will allow this person toA) buy the same bundle of goods as he did before the inflation.B) achieve a higher level of utility than he did before the inflation.C) achieve the same level of utility as before the inflation.D) buy more of all goods.Answer: BTopic: Cost-of-Living Adjustments4) Under which of the following conditions will there be no substitution bias in the CPI?A) Indifference curves are convex.B) Indifference curves are L-shaped.C) Indifference curves are linear.D) Indifference curves are downward sloping.Answer: BTopic: Cost-of-Living Adjustments5) Under which of the following conditions will there be no substitution bias in the CPI?A) Lower-priced goods increase in price by a greater percentage than do higher-priced goods.B) Higher-price goods increase in price by a greater percentage than do lower-priced goods.C) All goods change in price by the same amount.D) All goods change in price by the same percentage.Answer: DTopic: Cost-of-Living Adjustments6) A true cost-of-living adjustment in response to a change in prices would compensate consumers so that they would be able toA) purchase the same bundle they purchased before prices changed.B) achieve the same level of utility they did before prices changed.C) face the same choices they did before prices changed.D) achieve an increase in utility that is equal to the rate of inflation.Answer: BTopic: Cost-of-Living Adjustments7) Richard receives government transfer payments and currently consumes 5 guns and 6 goose livers. Assume the price of guns decreases by 10% and the price of goose liver increases by 20%. The government raises Richard's transfer payments so he can still afford 5 guns and 6 goose livers. Does this constitute a true cost-of-living adjustment?A) No. Richard is overcompensated.B) No. Richard is undercompensated.C) Yes. The payment just achieves the right level of compensation.D) Not enough information.Answer: ATopic: Cost-of-Living Adjustments8) Before an uneven rise in prices Allan consumed 5 bread and 6 juice. After the price increase and with an increased welfare payment from the government Allan consumes 4 bread and 7 juice. Does the government payment represent a true cost-of-living adjustment?A) Yes, if the two consumption bundles lie on the same indifference curve.B) Yes, if the second bundle yields more utility than the first.C) No, the first bundle is clearly preferred.D) Not enough information.Answer: ATopic: Cost-of-Living AdjustmentsFor the following, please answer "True" or "False" and explain why.9) Inflation over time necessarily makes consumers worse off.Answer: False. Wages also increase over time. Workers may earn the price of some goods in less time than in the past.Topic: Cost-of-Living Adjustments10) Using the CPI to compensate workers for inflation is appropriate because, in the face of a change in relative prices, people should be allowed to purchase the same bundle as they did before the price changes. Answer: False. This assumes that people would still prefer the original bundle. Because they are facing a new set of relative prices, compensating people so that they could purchase the original bundle will allow them to be able to achieve a higher level of utility than they did before the price changes.Topic: Cost-of-Living Adjustments11) Suppose the typical consumer only purchases food and clothing, and her utility can be expressed as U =F * C. Currently, food costs $5 per unit and clothing costs $2 per unit. Her income is $70. If the price of food increases to $6, compare the resulting Laspyre's price index with a true cost of living index.Answer: Maximizing utility subject to the initial constraint (5F + 2C = 70) yields C/F = 5/2 or F = 7 and C = 17.5. The Laspyre's price index calculates the ratio of the income necessary to achieve the original bundle relative to the original income. In this case [(6 * 7) + (2 * 17.5)]/70 = 1.10. The true cost of living index calculates the ratio of the income necessary to achieve the original level of utility relative to the original income. Utility is held constant when C * F = 17.5 * 7 = 122.5. The consumer is on the new budget line when C/F = 3. Combining yields F = 6.39 and C = 19.17. At the new prices, this requires an income of 76.68 and a resulting cost of living index of 76.68/70 = 1.095.Topic: Cost-of-Living Adjustments。


Chap 5 薄壁空间结构n本章主要内容:n1、概述n2、圆顶n3、筒壳n4、折板n5、双曲扁壳n6、双曲抛物面扭壳n7、薄壁空间结构的其他形式n自然界中存在着丰富多彩的壳体结构,如植物的果壳、种子、茎杆等等,以及动物界的蛋壳、蚌壳、蜗牛、脑壳等等。
它们的形态变化万千,曲线优美,且厚度之薄,用料之少,而结构之坚,着实让人惊叹!万灵之首的人类仿生于自然界,又造出了各种各样的壳体结构为自所用,如锅、碗、杯、瓶、坛、罐,以及灯泡、安全帽、轮船、飞机等。
n以上所列种种壳体结构一般是由上下两个几何曲面构成的空间薄壁结构。
两个曲面之间的距离即为壳体的厚度(δ),当δ比壳体其它尺寸(如曲率半径R,跨度l 等)小得多时,称为薄壳结构。
现代建筑工程中所采用的壳体一般为薄壳结构。
n薄壳结构为双向受力的空间结构,在竖向均布荷载作用下,壳体主要承受曲面内的轴向力(双向法向力)和顺剪力作用,曲面轴力和顺剪力都作用在曲面内,又称为薄膜内力。
而只有在非对称荷载(风,雪等)作用下,壳体采承受较小的弯矩和扭矩。
n由于壳体内主要承受以压力为主的薄膜内力,且薄膜内力沿壳体厚度方向均匀分布,所以材料强度能得到充分利用;而且壳体为曲面,处于空间受力状态,各向刚度都较大,因而用薄壳结构能实现以最少之材料构成最坚之结构的理想。
例如6m×6m 的钢筋混凝土双向板,最小厚度需130mm,而35m×35m的双向扁壳屋盖,壳板厚度仅需80mm。
n薄壳的薄膜内力n由于壳体强度高,刚度大,用料省,自重轻;覆盖大面积,无需中柱;而且其造型多变,曲线优美,表现力强,因而深受建筑师们的青睐,故多用于大跨度的建筑物,如展览厅,食堂,剧院,天文馆,厂房,飞机库等。
n不过,薄壳结构也又其自身的不足之处,由于体形多为曲线,复杂多变,采用现浇结构时,模板制作难度大,会费模费工,施工难度较大;一般壳体既作承重结构又作屋面,由于壳壁太薄,隔热保温效果不好;并且某些壳体(如球壳、扁壳)易产生回声现象,对音响效果要求高的大会堂、体育馆、影剧院等建筑不适宜。