汤森路透 Thomson Reuters Electronic Trading
- 格式:ppt
- 大小:2.79 MB
- 文档页数:24


- Search for InstrumentsRetrieving Data using “Thomson Reuters Datastream” TabHow to search for instruments in Excel by using “Thomson Reuters Datastream” t ab1.Choose Static Request button – for retrieving data on a specific point-of-time, or fundamentaldataOr Choose Time Series Request button – for retrieving historical data2.Search for instruments bya.Typing name and select from auto-suggestionb.Find Series buttoni.After clicking “Find Series” button, there will be “New pop-up window”•Then, search by typing keyword•Can also add more filters by different categories on the left pane, e.g. asset classes, sources of information, etc.•Then, select wanted instruments by clicking on the code of Symbol column “@AAPL” or check the box and click “Use”•Details of instrument can be found in the space below of the searched list (source, codes, time span, definition, exchange name, etc.)•Or can search instruments by clicking on “Explore” tab with in the same window•Then select the wanted Asset class, Country, Category, Industry, and Instruments accordinglyExample: On Explore menu, select Equities → Thailand → and select first 7 industries which included 140 stocks in Thailand marketNew window will show stocks in those industries. Then check boxes for stocks in Alternative Energy sector and Krung Thai Bank and click “Use”.All selected stock codes will show up in the first window of “Time Series Request”, which included the first one, APPLE, that we selected earlier.- Data types & DisplayRetrieving Data using “Thomson Reuters Datastream” TabHow to search for data types, and select display in Excel by using “Thomson Reuters Datastream” tab Refer to “How to search for instruments in Excel by using “Thomson Reuters Datastream” tab” manual before proceeding on the following steps.1.Select Data typeThis step will be a selection of different data types: prices, fundamental, financial statement items, ratios, etc.•Select the related Asset class first – in this case is Equities•Search by typing key word and click search•Filter for more specific data on the left pane categories•Select data that would like to retrieve• 3-stars means the most related data to your key word•Description and details are available by click on the name of data type Example: Select Equities and search for Total Return of stockDescription and methodology will be shown once click on the name of data typeThen check the box in front of stars and click “Use”.Or click on the data type code “RI”.2.Select time period of historical data, and frequencyTime period – can be input as default format: Start of Week, End of Week, and etc.Also can be input as exact date: DD/MM/YYYY (28/07/2015) Frequency – should select the suitable frequency that related to data typeFor example; Economic data with Monthly or Quarterly frequencyFinancial items data with Quarterly or Yearly frequencyExample: Frequency detail of each instrument can be found on the Frequency column to avoid mismatch of frequency while retrieving data. Also, it can be filtered on the left pane to search for specific frequency data.3.Design your display options, by checking the box of each itemThe recommended items to choose for display arei.Display Row & Column titlesii.Display codeiii.Display currency (currency by default will normally be local currency of those instruments)iv.Display latest value first (this will sort value to show latest period first)v.Hyperlink to Series Metadata (this will show link to open pop-up page with description of each instrument)vi.Check “Embed Formula” box (This will allow user to edit this request again in the future)4.Result of data retrievali.Formula will be embedded on first cell that we selected before clicking “Time SeriesRequest” button (screenshot shows cell A1 with formula)ii.Formula can also be edited manually on the fx bar (same as normal Excel formula) iii.Or click “Edit Request” then edit detail from the pop-up window again- Last 12 Months Dividend YieldRetrieving Data using “Thomson Reuters Datastream” TabHow to search for data types, and select display in Excel by using “Thomson Reuters Datastream” tabRetrieving Last 12 months -Dividend Yield for an instrumentRefer to “How to search for for data types, and select display in Excel by using “Thomson Reuters Datastream” tab ” manual before proceeding on the following steps.1. Select Static Request button2. After input the instruments (Stocks),i. Press Datatypes buttonii. Search for Equities category on the drop box iii. Search for Dividend or Dividend Yield keywordiv.Select check box and click use, or click on code directly (DY)3.Select time period of static data to be Latest value or any other wanted dateIf selected back date, dividend yield will be 12 months back date from the selected date 4.Design your display options, by checking the box of each itemThe recommended items to choose for display arei.Display Row & Column titlesii.Display currency (currency by default will normally be local currency of those instruments)iii.Display latest value first (this will sort value to show latest period first)iv.Hyperlink to Series Metadata (this will show link to open pop-up page with description of each instrument)v.Check “Embed Formula” box (This will allow user to edit t his request again in the future)Dividend Yield unit is percentage- PriceRetrieving Data using “Thomson Reuters Datastream” TabHow to search for data types, and select display in Excel by using “Thomson Reuters Datastream” tab Retrieving Price for an instrument over a specific time periodRefer to “How to search for for data types, and select display in Excel by using “Thomson Reuters Datastream” tab” manual before proceeding on the following steps.We have 2 options to display Price of each stock1.Leave data types blankAfter input the instruments (Stocks), leave data types to be blank and click submitPrice (closed price) will be default data that display from this request2.Search for “Price”v.Press Datatypes buttonvi.Search for Equities category on the drop boxvii.Search for Price keywordviii.Select check box and click use, or click on code directly (P)3.Select time period of historical data, and frequencyTime period – can be input as default format: Start of Week, End of Week, and etc.Also can be input as exact date: DD/MM/YYYY (28/07/2015) Frequency – should select the suitable frequency that related to data typeFor example; Economic data with Monthly or Quarterly frequencyFinancial items data with Quarterly or Yearly frequencyStock price for any frequency4.Design your display options, by checking the box of each itemThe recommended items to choose for display arei.Display Row & Column titlesii.Display codeiii.Display currency (currency by default will normally be local currency of those instruments)iv.Display latest value first (this will sort value to show latest period first)v.Hyperlink to Series Metadata (this will show link to open pop-up page with description of each instrument)vi.Check “Embed Formula” box (This will allow user to edit this request again in the future)- Total ReturnRetrieving Data using “Thomson Reuters Datastream” TabHow to search for data types, and select display in Excel by using “Thomson Reuters Datastream” tab Retrieving Total Return for an instrument over a specific time periodRefer to “How to search for for data types, and select display in Excel by using “Thomson Reuters Datastream” tab” manual before proceeding on the following steps.Since RI (Total Return) is the Total Return from the first listed date of stock in the market.Therefore, we need to apply formula of percent change to calculate for return on specificperiod1.Apply formula on data typei.Click Edit Request to edit formulaii.Click to add Percent ChangeThis function will be able to apply Excel calculation formula on your selected data types.This will save your time instead of pulling out historical data and manually calculate by Excel Example: Average (AVG#), Percent change (PCH#), Number of decimals to be shown (DPL#)iii.Search for percent change formulaiv.Type in X(RI) in the expression boxv.Type in period D = Day, W = Week, M = Month, Q = Quarter, Y= Year vi.Formula will show up as PCH#(X(RI),1Y)Example: -13.43% is the Total Return of APPLE stock for the past 1 year from 28/07/2015 to 28/07/2016- Multiple InstrumentsRetrieving Data using “Thomson Reuters Datastream” TabHow to retrieve multiple instruments in Excel by using “Thomson Reuters Datastream” tab Refer to “How to search for instruments in Excel by using “Thomson Reuters Datastream” tab”manual before proceeding on the following steps.1.Retrieving multiple instruments in one requestThis will help to input many instruments and save time for requesting each time series data.User needs to find list of instruments first.a.Find Seriesi.Click Find Series button to search for specific instrumentse key word search or Explore button (same method as after clicking findseries button when search for instruments)iii.This example we search the same method;Explore → Equities → Thailand → select first 7 sectorsThen export all 140 stocks from 7 sectors to ExcelOr can check boxes of all wanted instrument and click use to retrieve multiple instruments in one timeb. Create Listi.After exporting the list of wanted stocks into new Excel sheet, next step is to save thislist in the systemii.Click “Lists (Create from Range)” buttoniii.Then click “C hange selection” to refer to column B (with codes of 140 stocks)iv.Input your name in the Mnemonic (L#) Box - format must be L# and follow by name Example: Name this new list as L#TEST1Check “Validate on upload”, this will validate whether your stocks have data or not.This is an option and can choose not to check “Validate” alsoYour list now will be saved as L#TEST1 nameThen, starting to get a new data set. The request step can be only input the list name that we have created.v.By search for your created list L#TEST1vi.Pop-up window will show result of list in the system and detailsvii.Double click name L#TEST1 to use and start retrieving dataviii.Retrieve L#TEST1ix.Data type P = Price, MV = Market Capital Valuex.Check box of “TS for each item in list” to show data of TS (Time Series for all 140 stocks in list TEST1) →if this box hasn’t been checked, time series of list L#TEST1 couldn’t be retrievedResult: Price and Market cap for all stocks will be shown for 2 years historical data。

是什么?影响因子(Impact Factor,IF)是汤森路透(Thomson Reuters)出品的期刊引证报告(Journal Citation Reports,JCR)中的一项数据。
影响因子现已成为国际上通用的期刊评价指标(注意是期刊而非单篇论文),它不仅是一种测度期刊有用性和显示度的指标,而且也是测度期刊的学术水平,乃至论文质量的重要指标。
哪里来?在1998年,美国科技信息研究所所长尤金•加菲尔德(Eugene Garfield)博士在《科学家》(The Scientists)杂志中叙述了影响因子的产生过程。
说明他最初提出影响因子的目的是为《现刊目次,Current Contents》评估和挑选期刊。
人们所说的影响因子一般是指从1975年开始,《期刊引用报告》(Journal Citation Reports,JCR)每年提供上一年度世界范围期刊的引用数据,给出该数据库收录的每种期刊的影响因子。
JCR是一个世界权威性的综合数据库,它的引用数据来自世界上3000多家出版机构的7000多种期刊,专业范围包括科学、技术和社会科学。
JCR是世界上评估期刊一个综合性工具,它收集了全世界各个专业的期刊的引用数据,可以告诉人们:哪些是最有影响力的期刊,哪些是最常用的期刊,哪些是最热门的期刊,对文献计量学意义重大。
怎么算?* 2015年发表2014年的影响因子报告,一般在6、7月份;* 2014年的影响因子是看2012-2013年的期刊文章在2014年被引用的情况;举例:某刊2012-2013的文章在2014年的被引次数总计:985该刊2012-2013年的发文量总计:211该刊2014年的影响因子:4.6682 = 985÷211该数据将在2015年6、7月份发布哪里查?最官方的数据可以访问外文数据库Web of Science中的JCR(Journal Citation Reports)部分,其中JCR Science Edition用于查询自然科学类期刊,JCR Social Sciences Edition用于查询人文社会科学类期刊。

汤森路透是什么问题一:汤森路透的介绍汤森路透(Thomson Reuters)成立于2008年4月17日,是由加拿大汤姆森公司(The Thomson Corporation)与英国路透集团(Reuters Group PLC)合并组成的商务和专业智能信息提供商。
主要为专业企业、金融机构和消费者提供财经信息服务,例如电子交易系统、企业管理系统和风险管理系统、桌面系统、新闻,以及为在法律、税务和会计、科学、医疗保健和媒体市场的专业人员提供智能信息及解决方案。
问题二:汤森路透和路透的区别通常说的路透是指路透社,业务media传媒,虽然更有名气,其实只是整个大公司下面的一个小公司,其收入占的全公司利润份额也不高汤森路透就是整个公司了,自从汤森收购了路透,现在就只有汤森路透,旗下10多个不同领域的公司和业务问题三:“路透”是什么意思?既然你已经知道路透社的由来了,那么路透的意思就是快讯呀,或者更简单点说就是最新时讯消息,片场路透就是片场快讯,直击片场最新消息问题四:汤森路透集团的公司简介汤森路透集团是全球最大的专业信息服务提供商。
我们将专业知识与创新科技相结合,为金融、法律、税务与财会、科学技术、知识产权、医疗保健和媒体等领域的专业人员和决策者提供重要的信息。
集团总部位于纽约,主要分支机构设于英国伦敦、美国明尼苏达州伊根等地。
集团在100 个国家和地区设有分支机构,共有5万多名员工。
集团股票在美国纽约证券交易所(NYSE:TRI)、加拿大多伦多股票交易所(TSX:TRI) 上市交易。
信息来源于若邻问题五:汤森路透的在中国发展路透社在中国的运营始于1871年。
目前,汤森路透在整个中国雇用了超过1500名员工,在中国大陆的雇员总人数超过900人,在北京、上海、深圳、广州、香港和台湾省均设有办事处。
2002年,汤森路透法律信息集团正式在中国设立办事机构。
汤森路透法律信息集团为来自法律、税务、会计、知识产权、合规管理等领域和 ... 部门的专业人士提供智能的、贴近实际工作的产品和专业的服务。
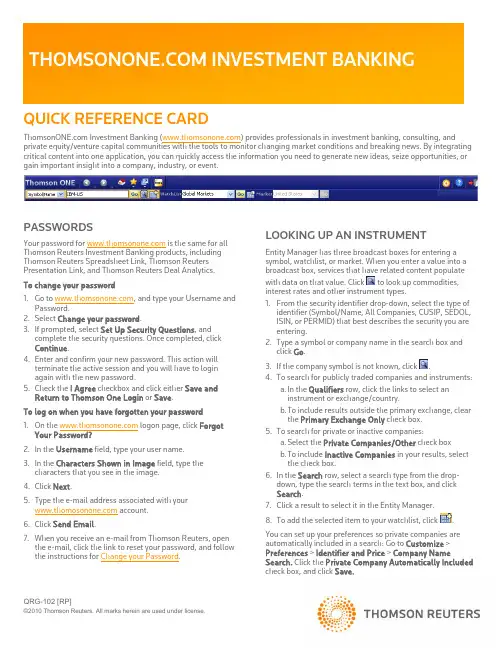
QRG-102 [RP]PASSWORDSYour password for is the same for all Thomson Reuters Investment Banking products, including Thomson Reuters Spreadsheet Link, Thomson Reuters Presentation Link, and Thomson Reuters Deal Analytics. To change your password1. Go to , and type your Username and Password.2. Select Change your password .3. If prompted, select Set Up Security Questions , and complete the security questions. Once completed, click Continue .4. Enter and confirm your new password. This action will terminate the active session and you will have to login again with the new password.5. Check the I Agree checkbox and click either Save and Return to Thomson One Login or Save . To log on when you have forgotten your password 1. On the logon page, click Forgot Your Password? 2. In the Username field, type your user name. 3. In the Characters Shown in Image field, type the characters that you see in the image. 4. Click Next .5. Type the e-mail address associated with your account.6. Click Send Email .7. When you receive an e-mail from Thomson Reuters, open the e-mail, click the link to reset your password, and follow the instructions for Change your Password .LOOKING UP AN INSTRUMENTEntity Manager has three broadcast boxes for entering a symbol, watchlist, or market. When you enter a value into a broadcast box, services that have related content populate with data on that value. Click to look up commodities, interest rates and other instrument types.1. From the security identifier drop-down, select the type of identifier (Symbol/Name, All Companies, CUSIP, SEDOL, ISIN, or PERMID) that best describes the security you are entering.2. Type a symbol or company name in the search box and click Go .3. If the company symbol is not known, click .4. To search for publicly traded companies and instruments:a. In the Qualifiers row, click the links to select an instrument or exchange/country.b. T o include results outside the primary exchange, clear the Primary Exchange Only check box. 5. To search for private or inactive companies:a. Select the Private Companies/Other check boxb. T o include Inactive Companies in your results, select the check box.6. In the Search row, select a search type from the drop-down, type the search terms in the text box, and click Search .7. Click a result to select it in the Entity Manager. 8. To add the selected item to your watchlist, click.You can set up your preferences so private companies are automatically included in a search: Go to Customize > Preferences > Identifier and Price > Company NameSearch. Click the Private Company Automatically Included check box, and click Save.SETTING AND ORGANIZING FAVORITESWhen you set up a service as a Favorite, it appears under for easy access. To add a service to your Favorites, open the page, click, and then select Add to Favorites . To organize your favorites1. Click , and select Organize Favorites .2. If you want to create and name folders, click Create Folder , and type in a name.3. Drag a favorite into any folder, or click up or down arrows to move it to a different place in the list.4. Click OK .To set any page as your Home Page• Click , and select Set as Home .To return to your home page at any time• Click .AUTOMATIC SYMBOL ENTRY OR“LISTENING”When a symbol (e.g., IBM-US) appears in the broadcast box, automatically applies this symbol(“Listens”) when you switch to a different page and populates it with related data.To turn off automatic symbol entry• Click the yellow icon in the service title bar so that it turnsgray (indicating “Not Listening” to the broadcast box).You may want to turn off automatic symbol entry when you want to freeze content on a page.MONITORING A COVERAGE LISTFlex Monitor allows you to create and save an unlimited number of symbol lists so you can easily monitor the latest quotes data. Each symbol list can include up to 1024 stocks, bonds, options, commodities, market indexes, and statistics. To create a Symbol Watchlist• Click , and give your list a name. Click OK .To add a symbol to Flex Monitor• Left-click within a Flex Monitor cell, and type a symbol. Click outside the entry field to activate. To delete a symbol from Flex MonitorSelect a symbol in your list, right-click it, and then choose Delete .To sort columns in Flex Monitor• Right-click the column head that you want to use as the sortcriterion, choose Sort and then choose Ascending or Descending . You can also work with your coverage list under Tools & Tips > My Watchlists . Select a watchlist (My Watchlists, Shared Watchlists, Market Indexes, or Industry Lists) from the View drop down and then click Go .Access Watchlist Views > Watchlist Activity to view News, Research, Deals, Events, and Filings headlines; as well as Transcripts and Briefs, Estimates Guidance, and the ability to download research on the coverage watchlist.To select a watchlist (personal or shared), an Index or an Industry Classification, go to Watchlist Views and select a watchlist from the Watchlist dropdown in the top toolbar.SETTING ALERTSYou can set alerts on Price & Volume, News, and Filings.When an alert is triggered, you have the option of viewing the alert in your inbox, receiving an e-mail, or showing a pop-up alert indicator.To set alerts1. You can access the Alert Manager by: • Clicking Alerts in Flex Monitor.• Tools & Tips > My Alerts > Alert Manager.• My Pages > Alert Inbox > Go to Alert Manager2. Select the content set and criteria for your alerts (Price & Volume, News, and/or Filings).3. Select a company or a watchlist.4. Set your delivery options.5. Click Save . To access alertsGo to one of the following: • My Pages > Alert Inbox .• Tools & Tips > My Alerts > Alert Manager- Click Go to Inbox .You can also receive e-mail notices on Events, Briefs,Transcripts and Delta Reports based on a time period you determine. Go to Tools & Tips > My Alerts > Event Alerting .USING THE DRILL DOWN CAPABILITYDrill down fields are the underlined fields in Flex Monitor that link to other windows, known as target windows. Clicking a drill down field activates the target window and retrieves a display for the symbol selected. To create/edit a drill down1. Right-click in Flex Monitor, and select Drill Downs .2. Select a field from the Fields box.3.Select a service to link to from the Available Services tolink to box.4.Click Link to create a link or Unlink to disable a link.5.Click OK.USING MY PAGESMy Pages allows you to configure and customize a set of pages of your own choosing in your workspace. It has been pre-set with the following:•My Thomson ONE – Contains useful information including the latest enhancements, hints and tips.•My News – A sample (set to A/) shows all news. Another sample (set to N/TMN) shows news on acquisitions, andmergers & takeovers. You can change these displays byentering codes for your preferred settings. These components are set to “Not Listen” to the broadcast box so they willmaintain your current settings.To set up and manage your custom pages1.Click Customize, and choose Organize Workspace.2.To add a group or page to My Pages, select My Pages, andclick Add Group or Add Page. the page, and then drag a service from the InsertOption menu. You can add multiple services to a page. 4.To change the order of a page, right-click it and chooseMove Up or Move Down.5.To move a group or page into a different group, click it,and then drag it to the target group. MODIFYING THE APPEARANCE OF A PAGEYou can change the appearance of the Market Views > Market Monitor page and the My Pages page by rearranging and resizing the service.•To move a service section, click its title bar and drag it to a new location.•To resize a service, use the cursor to drag the bottom (or top) border of the service to shrink or expand its viewing area. •To hide the title bar of a service, right-click within the service and choose Hide Titlebar.FLOATING SERVICESFloating services are services that are displayed in separate browser windows while is running, even when it is minimized. To add a new floating service•Right-click within a service in your workspace, and click Open as Floating.To view a menu of your floating services•Click .To access a floating service•Click , and then click the service.SETTING PREFERENCESYou can set navigation and user preferences for several pages including Advanced Filings, Deals, Estimates, Private Equity and Watchlist Activity.To set preferences1.Click .2.Click Preferences.COMMONLYUSED NEWS SYMBOLSCommonly Used Industry CodesEXCHANGE SPECIFIC QUOTESTo access a quote from a specific exchange, type a symbol-exchange qualifier as a suffix to a symbol(e.g., IBM-P, for IBM trading on ArcaEx).FREQUENTLY USED INDICES AmericasFREQUENTLY USED RATESUS RatesONLINE HELP & CUSTOMER SUPPORTClick to open the Help/Supportmenu:•Help Contents – Opens Help forthe currently displayed feature andother help topics.•Customer Support –Contains support e-mail address and contact phonenumbers for global customer support.Clickhttps:///kccontactus/tele phone.aspx. Select Former Thomson Financial Products and then the country to locate the correct number forsupport.。

REUTERS“法雷奥的理想是将最具创新意义的技术融入到数亿人驾驶的车辆之中。
目录引言 (4)观察与发现....................................................................................................................................................................................5-6航空航天与国防................................. 7-12信息技术..........................................43-48汽车....................................................13-18医疗器械..........................................49-54生物技术...........................................19-24石油和天然气..................................55-60化妆品与健康..................................25-30制药...................................................61-66食品、饮料、烟草..........................31-36半导体.............................................. 67-72家电.................................................. 37-42通讯...................................................73-78颠覆性创新推动实现两位数增长在当今社会中,许多事情都需要群策群力才能完成,创新也不例外。
QRG-102 [RP]PASSWORDSYour password for is the same for all Thomson Reuters Investment Banking products, including Thomson Reuters Spreadsheet Link, Thomson Reuters Presentation Link, and Thomson Reuters Deal Analytics. To change your password1. Go to , and type your Username and Password.2. Select Change your password .3. If prompted, select Set Up Security Questions , and complete the security questions. Once completed, click Continue .4. Enter and confirm your new password. This action will terminate the active session and you will have to login again with the new password.5. Check the I Agree checkbox and click either Save and Return to Thomson One Login or Save . To log on when you have forgotten your password 1. On the logon page, click Forgot Your Password? 2. In the Username field, type your user name. 3. In the Characters Shown in Image field, type the characters that you see in the image. 4. Click Next .5. Type the e-mail address associated with your account.6. Click Send Email .7. When you receive an e-mail from Thomson Reuters, open the e-mail, click the link to reset your password, and follow the instructions for Change your Password .LOOKING UP AN INSTRUMENTEntity Manager has three broadcast boxes for entering a symbol, watchlist, or market. When you enter a value into a broadcast box, services that have related content populate with data on that value. Click to look up commodities, interest rates and other instrument types.1. From the security identifier drop-down, select the type of identifier (Symbol/Name, All Companies, CUSIP, SEDOL, ISIN, or PERMID) that best describes the security you are entering.2. Type a symbol or company name in the search box and click Go .3. If the company symbol is not known, click .4. To search for publicly traded companies and instruments:a. In the Qualifiers row, click the links to select an instrument or exchange/country.b. T o include results outside the primary exchange, clear the Primary Exchange Only check box. 5. To search for private or inactive companies:a. Select the Private Companies/Other check boxb. T o include Inactive Companies in your results, select the check box.6. In the Search row, select a search type from the drop-down, type the search terms in the text box, and click Search .7. Click a result to select it in the Entity Manager. 8. To add the selected item to your watchlist, click.You can set up your preferences so private companies are automatically included in a search: Go to Customize > Preferences > Identifier and Price > Company NameSearch. Click the Private Company Automatically Included check box, and click Save.SETTING AND ORGANIZING FAVORITESWhen you set up a service as a Favorite, it appears under for easy access. To add a service to your Favorites, open the page, click, and then select Add to Favorites . To organize your favorites1. Click , and select Organize Favorites .2. If you want to create and name folders, click Create Folder , and type in a name.3. Drag a favorite into any folder, or click up or down arrows to move it to a different place in the list.4. Click OK .To set any page as your Home Page• Click , and select Set as Home .To return to your home page at any time• Click .AUTOMATIC SYMBOL ENTRY OR“LISTENING”When a symbol (e.g., IBM-US) appears in the broadcast box, automatically applies this symbol(“Listens”) when you switch to a different page and populates it with related data.To turn off automatic symbol entry• Click the yellow icon in the service title bar so that it turnsgray (indicating “Not Listening” to the broadcast box).You may want to turn off automatic symbol entry when you want to freeze content on a page.MONITORING A COVERAGE LISTFlex Monitor allows you to create and save an unlimited number of symbol lists so you can easily monitor the latest quotes data. Each symbol list can include up to 1024 stocks, bonds, options, commodities, market indexes, and statistics. To create a Symbol Watchlist• Click , and give your list a name. Click OK .To add a symbol to Flex Monitor• Left-click within a Flex Monitor cell, and type a symbol. Click outside the entry field to activate. To delete a symbol from Flex MonitorSelect a symbol in your list, right-click it, and then choose Delete .To sort columns in Flex Monitor• Right-click the column head that you want to use as the sortcriterion, choose Sort and then choose Ascending or Descending . You can also work with your coverage list under Tools & Tips > My Watchlists . Select a watchlist (My Watchlists, Shared Watchlists, Market Indexes, or Industry Lists) from the View drop down and then click Go .Access Watchlist Views > Watchlist Activity to view News, Research, Deals, Events, and Filings headlines; as well as Transcripts and Briefs, Estimates Guidance, and the ability to download research on the coverage watchlist.To select a watchlist (personal or shared), an Index or an Industry Classification, go to Watchlist Views and select a watchlist from the Watchlist dropdown in the top toolbar.SETTING ALERTSYou can set alerts on Price & Volume, News, and Filings.When an alert is triggered, you have the option of viewing the alert in your inbox, receiving an e-mail, or showing a pop-up alert indicator.To set alerts1. You can access the Alert Manager by: • Clicking Alerts in Flex Monitor.• Tools & Tips > My Alerts > Alert Manager.• My Pages > Alert Inbox > Go to Alert Manager2. Select the content set and criteria for your alerts (Price & Volume, News, and/or Filings).3. Select a company or a watchlist.4. Set your delivery options.5. Click Save . To access alertsGo to one of the following: • My Pages > Alert Inbox .• Tools & Tips > My Alerts > Alert Manager- Click Go to Inbox .You can also receive e-mail notices on Events, Briefs,Transcripts and Delta Reports based on a time period you determine. Go to Tools & Tips > My Alerts > Event Alerting .USING THE DRILL DOWN CAPABILITYDrill down fields are the underlined fields in Flex Monitor that link to other windows, known as target windows. Clicking a drill down field activates the target window and retrieves a display for the symbol selected. To create/edit a drill down1. Right-click in Flex Monitor, and select Drill Downs .2. Select a field from the Fields box.3.Select a service to link to from the Available Services tolink to box.4.Click Link to create a link or Unlink to disable a link.5.Click OK.USING MY PAGESMy Pages allows you to configure and customize a set of pages of your own choosing in your workspace. It has been pre-set with the following:•My Thomson ONE – Contains useful information including the latest enhancements, hints and tips.•My News – A sample (set to A/) shows all news. Another sample (set to N/TMN) shows news on acquisitions, andmergers & takeovers. You can change these displays byentering codes for your preferred settings. These components are set to “Not Listen” to the broadcast box so they willmaintain your current settings.To set up and manage your custom pages1.Click Customize, and choose Organize Workspace.2.To add a group or page to My Pages, select My Pages, andclick Add Group or Add Page. the page, and then drag a service from the InsertOption menu. You can add multiple services to a page. 4.To change the order of a page, right-click it and chooseMove Up or Move Down.5.To move a group or page into a different group, click it,and then drag it to the target group. MODIFYING THE APPEARANCE OF A PAGEYou can change the appearance of the Market Views > Market Monitor page and the My Pages page by rearranging and resizing the service.•To move a service section, click its title bar and drag it to a new location.•To resize a service, use the cursor to drag the bottom (or top) border of the service to shrink or expand its viewing area. •To hide the title bar of a service, right-click within the service and choose Hide Titlebar.FLOATING SERVICESFloating services are services that are displayed in separate browser windows while is running, even when it is minimized. To add a new floating service•Right-click within a service in your workspace, and click Open as Floating.To view a menu of your floating services•Click .To access a floating service•Click , and then click the service.SETTING PREFERENCESYou can set navigation and user preferences for several pages including Advanced Filings, Deals, Estimates, Private Equity and Watchlist Activity.To set preferences1.Click .2.Click Preferences.COMMONLYUSED NEWS SYMBOLSCommonly Used Industry CodesEXCHANGE SPECIFIC QUOTESTo access a quote from a specific exchange, type a symbol-exchange qualifier as a suffix to a symbol(e.g., IBM-P, for IBM trading on ArcaEx).FREQUENTLY USED INDICES AmericasFREQUENTLY USED RATESUS RatesONLINE HELP & CUSTOMER SUPPORTClick to open the Help/Supportmenu:•Help Contents – Opens Help forthe currently displayed feature andother help topics.•Customer Support –Contains support e-mail address and contact phonenumbers for global customer support.Clickhttps:///kccontactus/tele phone.aspx. Select Former Thomson Financial Products and then the country to locate the correct number forsupport.。

基于ESI数据库的国内外化学研究机构分析化学研究机构是科学研究的重要力量,对于推动化学领域的发展和创新具有重要作用。
本文将基于ESI数据库对国内外化学研究机构进行分析,探讨其研究方向、影响力和合作情况等方面的信息。
ESI数据库(Essential Science Indicators)是汤森路透公司(Thomson Reuters)开发的一个评估研究机构和学者影响力的工具,通过对全球各领域科学研究论文的引用分析,提供了一系列详细的统计数据和排名信息。
本文将以化学领域为例,分析ESI数据库中的国内外化学研究机构。
首先,我们可以通过查找ESI数据库中的“化学”领域,获取相关的信息。
从论文数量来看,国内外化学研究机构的发文数量呈现出一定的差距,国外机构在发文数量上明显领先于国内机构。
但并不代表国内机构的研究水平较低,而是反映了国外机构历史较长、资源较丰富等客观因素。
同时,国内化学研究机构在一些特定的研究领域也有较高的发表数量和影响力。
其次,我们可以通过ESI数据库中的“热点论文”来了解化学研究机构的研究方向。
热点论文是指被广泛引用的研究成果,在相应领域具有较大影响力。
通过对国内外化学研究机构热点论文的分析,可以发现不同机构在研究方向上的差异。
国外化学研究机构在有机合成、配位化学、材料化学等领域相对较为突出,而国内机构在环境化学、天然产物化学、药物化学等领域也有很好的研究表现。
此外,值得注意的是,化学研究机构的合作情况。
通过ESI数据库中的合作论文分析,可以发现不同机构在合作方面的情况。
合作关系既可以是国内外不同机构之间的合作,也可以是机构内部的不同团队之间的合作。
合作论文的数量和质量既反映了机构的合作能力,也反映了机构之间的合作积极性和合作共识。
通过对合作论文的分析,可以发现一些研究机构之间存在密切的合作关系,这种合作模式有助于资源共享、经验交流和研究成果的共同发表。
总结来说,基于ESI数据库的国内外化学研究机构分析是了解化学领域研究机构的重要手段。

加拿大的汤姆森公司于2008年4月收购英国路透社后,两家公司合并成为汤森路透集团。
对于具有150多年历史的路透社来说,这是其发展史上第一次由一个家族企业来控制经营,汤森路透也由此名声鹤起。
但合并后的汤森路透如何在竞争对手如林的市场上创新开拓、经营自己的细分市场业务?如何保持自己在市场上的竞争优势?这些问题是本选题的研究缘起。
从大数据视角来看,汤森路透的创新经营可以归结为三点,即专业知识数据化、电子信息服务精细化和客户群体高端化。
一、专业知识数据化汤森路透创新经营的第一个重要表现就是将专业知识数据化。
汤森路透拥有庞大的专业知识数据库、软件应用工具及服务,可以便捷、快速地将这些数据化的知识信息发送给客户,客户再利用这些数据信息并将之转化为其所追求的经济价值和社会价值。
随着社会产业和职业的知识化发展、社会运行节奏的加快以及社会竞争的加强,对专业知识信息传递的要求必定也越来越高。
从信息的发展趋势来看,未来将是一个“大数据”引领的智慧科技的时代。
大数据(big data)泛指巨量的数据集,它实质上是一种从各种海量数据中快速获有价值信息的能力。
最早提出“大数据”时代到来的是全球知名咨询公司麦肯锡,它声称:“数据已经渗透到当今每一个行业和业务职能领域,成为重要的生产因素。
”因此,汤森路透将专业知识数据化,无疑顺应了信息发展的趋势。
在如今的信息时代,人们被信息洪流所包围,而这些信息绝大部分都是以数字数据的形式存在。
据有关数据表明,到2013年,世界上存储的数据预计能达到1.2泽字节,其中非数字数据值占不到2%,而其他98%的都是数字数据。
这些庞大的数字数据可以被计算机读取,使得存储和处理这些数据变得既便宜又容易,不仅可以大大提高数据管理和分析的效率,而且便于挖掘这些数据的潜在价值,因为信息只有被数据化后,其巨大的潜在价值才会释放出来。
现在,越来越多的企业已经意识到,如果不能及时获得有价值的信息,就无法预测出潜在的市场机遇或业务风险,从而导致商业机会的流失或使企业遭受损失。
Thomson Reuters Pharma整合性信息平台功能与价值
Thomson Reuters Pharma 是世界领先的综合医药信息平台,客户遍及全球Top100药企及国内各大新药研发企业及单位。
Thomson Reuters Pharma 提供10个面向的信息,包括:药物;专利;公司;化学;临床试验方案;临床试验报告;靶标;
基因序列;交易;文献和新闻。
Thomson Reuters Pharma 直接以报告的方式提供以上10个方面的信息,其中每一份报告都由专业人员围绕主题将所有相关信息进行了整合和综合,并附有业界专家撰写的综述和评论,并且十大报告之间可以很好的相互链接。
通过Thomson Reuters Pharma 可以帮助山东绿叶制药集团:✓制定公司的战略决策;
✓进行新药的项目调研;
✓识别新的药物靶标、药物和基因序列;
✓研究并评估相关的临床试验;
✓寻找有利的注册时机;
✓获得竞争对手产品及交易活动的详细信息;
✓研究当前的药物销售和市场份额数据及对未来的预测数据;
✓查明药物专利何时在某些国家失效;。

rankFull Journal Title Total CitesJournalImpact FactorEigenfactorScore1CA-A CANCER JOURNALFOR CLINICIANS16130162.50.060272NEW ENGLANDJOURNAL OF MEDICINE25746954.420.659163CHEMICAL REVIEWS12446345.6610.21764REVIEWS OF MODERNPHYSICS3764742.860.128785NATURE59032442.351 1.604196Annual Review ofImmunology1665341.3920.047887NATURE REVIEWSGENETICS2635839.7940.126998LANCET17652839.2070.381689NATUREBIOTECHNOLOGY4215639.080.1439810NATURE REVIEWSCANCER3605237.9120.1120911NATURE REVIEWS DRUGDISCOVERY2145437.2310.0632512NATURE REVIEWSMOLECULAR CELLBIOLOGY3412436.4580.1337513NATURE MATERIALS5496236.4250.2003814NATURE REVIEWSIMMUNOLOGY2702433.8360.1034915Nature Nanotechnology2785833.2650.15695 16CELL19122633.1160.59956 17SCIENCE53703531.477 1.276318NATURE REVIEWSNEUROSCIENCE3012031.3760.089119CHEMICAL SOCIETYREVIEWS6307130.4250.2138820JAMA-JOURNAL OF THEAMERICAN MEDICALASSOCIATION12482230.3870.2517421Nature Photonics1862329.9580.11878 22NATURE GENETICS8154829.6480.2758323PHYSIOLOGICALREVIEWS2397429.0410.0416924NATURE MEDICINE6000228.0540.1630825PROGRESS IN POLYMERSCIENCE1744626.8540.0305826Annual Review ofBiochemistry2007026.5340.0498127NATURE METHODS2456025.9530.1531728PROGRESS INMATERIALS SCIENCE690325.870.0150629NATURE IMMUNOLOGY3476524.9730.14263 30LANCET ONCOLOGY2056524.7250.093131SURFACE SCIENCEREPORTS441024.5620.0082832ACCOUNTS OFCHEMICAL RESEARCH4700524.3480.1117833Annual Review ofAstronomy andAstrophysics831224.0370.0224834CANCER CELL2492923.8930.1148735NATURE REVIEWSMICROBIOLOGY1677423.3170.0689636Nature Chemistry1244023.2970.0721337PHYSICS REPORTS-REVIEW SECTION OFPHYSICS LETTERS2138622.910.0394838Annual Review ofNeuroscience1334522.660.0278239Cell Stem Cell1549222.1510.1174540Annual Review ofPathology-Mechanisms ofDisease276722.1280.0144141LANCET NEUROLOGY1753421.8230.0672642TRENDS IN COGNITIVESCIENCES1807621.1470.043942TRENDS IN COGNITIVESCIENCES1807621.1470.043944Nature Physics2032120.6030.1733645Annual Review ofPsychology1181020.5330.0245845Annual Review ofPsychology1181020.5330.0245847Annual Review of Cell andDevelopmental Biology922420.2410.0248548NATURE CELL BIOLOGY3448220.0580.14265 49IMMUNITY3478719.7480.1403450LANCET INFECTIOUSDISEASES1171019.4460.0403651ENDOCRINE REVIEWS1362319.3580.0206852Annual Review of PlantBiology1522818.90.0255953PHARMACOLOGICALREVIEWS1106918.5510.017154Annual Review ofPharmacology andToxicology737318.5230.0121355Nano Today385518.4320.01466 56Annual Review of Genetics701518.1150.02496 57ADVANCES IN PHYSICS502618.0620.010258JOURNAL OF CLINICALONCOLOGY13099117.8790.3711959Alzheimers & Dementia382117.4720.0160660PROGRESS IN ENERGYAND COMBUSTIONSCIENCE597816.9090.0130961Cell Metabolism1563616.7470.07873 62Living Reviews in Relativity160016.5260.0063463Annual Review of MarineScience162816.3810.0124364BMJ-British Medical Journal 8543416.3780.1606765ALDRICHIMICA ACTA106616.3330.0024366ANNALS OF INTERNALMEDICINE4730916.1040.1028567CLINICALMICROBIOLOGYREVIEWS12781160.0194668NEURON7198915.9820.22641 69Cancer Discovery221015.9290.017570Nature Reviews ClinicalOncology352315.6960.0228671Annual Review of PhysicalChemistry757015.6780.01572REPORTS ONPROGRESS IN PHYSICS1142115.6330.0344773Annual Review of MaterialsResearch583315.6290.0115574Energy & EnvironmentalScience2242815.490.087375Annual Review of Medicine556015.4780.0148 76ADVANCED MATERIALS10756715.4090.2752877TRENDS IN ECOLOGY &EVOLUTION2680615.3530.0543878JOURNAL OF THEAMERICAN COLLEGE OFCARDIOLOGY7923515.3430.2001479Nature Climate Change287115.2950.02112 79Nature Climate Change287115.2950.0211281MICROBIOLOGY ANDMOLECULAR BIOLOGYREVIEWS954715.2550.0162382JNCI-Journal of theNational Cancer Institute3790315.1610.072583MOLECULARPSYCHIATRY1390215.1470.0393884NATURENEUROSCIENCE 4609514.9760.1515185BEHAVIORAL AND BRAINSCIENCES701714.9620.0096985BEHAVIORAL AND BRAINSCIENCES701714.9620.0096987CIRCULATION15866114.9480.2880288EUROPEAN HEARTJOURNAL3661314.7230.1113689Annual Review ofPhysiology824614.6960.0158490MOLECULAR CELL5203314.4640.2256391Science TranslationalMedicine922214.4140.0700592PSYCHOLOGICALBULLETIN3408014.3920.0318792PSYCHOLOGICALBULLETIN3408014.3920.0318794Advanced Energy Materials543314.3850.0220595MOLECULAR BIOLOGYAND EVOLUTION3497114.3080.0873296ASTROPHYSICALJOURNAL SUPPLEMENTSERIES2371814.1370.0846497Nature Reviews Neurology325714.1030.01898 98Molecular Systems Biology719514.0990.03999 99PLOS MEDICINE16975140.074 100GASTROENTEROLOGY6244513.9260.14739101JOURNAL OFEXPERIMENTALMEDICINE6419113.9120.13872102GENOME RESEARCH3099513.8520.14207103FEMS MICROBIOLOGYREVIEWS882713.8060.02255104JOURNAL OF CLINICALINVESTIGATION9690813.7650.19352105ARCHIVES OF GENERALPSYCHIATRY3862213.7470.05477105ARCHIVES OF GENERALPSYCHIATRY3862213.7470.05477107AMERICAN JOURNAL OFPSYCHIATRY4319313.5590.04942107AMERICAN JOURNAL OFPSYCHIATRY4319313.5590.04942109TRENDS INBIOCHEMICAL SCIENCES1591013.5220.03767110TRENDS IN PLANTSCIENCE1536713.4790.03429111GUT3305913.3190.0654112ASTRONOMY ANDASTROPHYSICS REVIEW107113.3120.00662113ARCHIVES OF INTERNALMEDICINE3973413.2460.08584114Nature Chemical Biology1249513.2170.06653 115ECOLOGY LETTERS2051913.0420.06471116Annual Review ofEntomology954613.0210.01048117Annual Review ofMicrobiology915913.0180.01719118PROGRESS IN LIPIDRESEARCH438212.9630.00883119Nature ReviewsEndocrinology275312.9580.01608120NANO LETTERS10339912.940.37513121Annual Review of ClinicalPsychology254212.9210.00947121Annual Review of ClinicalPsychology254212.9210.00947123IMMUNOLOGICALREVIEWS1301812.9090.04899124TRENDS INNEUROSCIENCES1852312.9020.03691125World Psychiatry145912.8460.00379 125World Psychiatry145912.8460.00379127Psychological Science inthe Public Interest58412.8330.00216128ADVANCED DRUGDELIVERY REVIEWS2382012.7070.03938129GENES & DEVELOPMENT5923412.6390.16574 130EUROPEAN UROLOGY1938912.480.0564131Annual Review ofBiomedical Engineering 348612.450.00778132TRENDS IN CELL BIOLOGY1114412.3140.03868133Annual Review of Biophysics197512.250.01724134Cell Host & Microbe 762212.1940.05316135MOLECULAR INTERVENTIONS 107312.1430.00197136COORDINATIONCHEMISTRY REVIEWS 2792212.0980.03644137ACS Nano 5844612.0330.27094138TRENDS IN IMMUNOLOGY 863812.0310.02783139AMERICAN JOURNAL OF RESPIRATORY AND CRITICAL CARE MEDICINE5156411.9860.09514140CELL RESEARCH808311.9810.03778141ANNALS OF NEUROLOGY 3367011.910.06321142Annual Review ofCondensed Matter Physics 84511.9090.00854143Living Reviews in Solar Physics58211.8330.00391144MATERIALS SCIENCE &ENGINEERING R-REPORTS515411.7890.00765145PLOS BIOLOGY 2432411.7710.11227146Nature Geoscience1022411.6680.0919147NATURE STRUCTURAL &MOLECULAR BIOLOGY 2569111.6330.11795148JOURNAL OFPHOTOCHEMISTRY AND PHOTOBIOLOGY C-PHOTOCHEMISTRY REVIEWS223911.6250.00372149TRENDS IN GENETICS 1101511.5970.03149150BULLETIN OF THE AMERICANMETEOROLOGICAL SOCIETY1350511.5740.03257151SYSTEMATIC BIOLOGY 1222611.5320.02871152JOURNAL OF THEAMERICAN CHEMICAL SOCIETY 46251011.4440.81912153Autophagy782911.4230.03566154ANGEWANDTE CHEMIE-INTERNATIONAL EDITION21540811.3360.50392155Annual Review of FluidMechanics753811.260.01496156JOURNAL OF ALLERGYAND CLINICALIMMUNOLOGY3638911.2480.07898157HEPATOLOGY5305211.190.12712158CIRCULATIONRESEARCH4718511.0890.09281159Oceanography and MarineBiology218011.0830.00198160Annual Review ofPhytopathology5920110.00826161AMERICAN JOURNAL OFHUMAN GENETICS3394410.9870.08038162Annual Review of EcologyEvolution and Systematics1639610.9770.01861163Materials Today473910.850.014164Nature ReviewsGastroenterology &Hepatology234210.8070.01377165EMBO JOURNAL7617610.7480.15325 166Nature Communications1719310.7420.12343167NATURAL PRODUCTREPORTS715810.7150.01728168GENOME BIOLOGY1968710.4650.08275 169Annual Review of Nutrition484610.4590.0058170ADVANCED FUNCTIONALMATERIALS4224410.4390.12081171JOURNAL OFHEPATOLOGY2455110.4010.06827172REVIEWS OFGEOPHYSICS741810.40.01264173DEVELOPMENTAL CELL2143910.3660.09938174MOLECULAR ASPECTSOF MEDICINE348610.3020.00845175PROGRESS INNEUROBIOLOGY1131010.3010.02122176NEUROSCIENCE ANDBIOBEHAVIORALREVIEWS1511110.2840.03843177Nature ReviewsRheumatology259610.2520.01562178BRAIN4445710.2260.0902179Nano Energy97110.2110.00282180Annual Review of Earthand Planetary Sciences545710.1880.01268181Nature Reviews Cardiology219610.1540.01314182TRENDS IN MOLECULARMEDICINE665910.110.0209183QUARTERLY REVIEWSOF BIOPHYSICS252910.0830.00546184TRENDS INBIOTECHNOLOGY1076710.040.02049185TRENDS INPHARMACOLOGICALSCIENCES109129.9880.02406186Perspectives onPsychological Science31229.9550.01964187EXERCISE IMMUNOLOGYREVIEW5139.9290.00118188CURRENT BIOLOGY460379.9160.15525 189NPG Asia Materials6549.9020.00333190PROGRESS IN RETINALAND EYE RESEARCH38759.8970.00845191PROCEEDINGS OF THENATIONAL ACADEMY OFSCIENCES OF THEUNITED STATES OF 聽AMERICA5659349.809 1.50118192TRENDS INMICROBIOLOGY87639.8080.0211193Advances in AnatomyEmbryology and CellBiology3999.80.00053194BIOLOGICAL REVIEWS72619.790.01426195ACTANEUROPATHOLOGICA122849.7770.03093196BLOOD1498659.7750.41182197PROGRESS INPHOTOVOLTAICS62069.6960.01613198Advances in Optics andPhotonics6609.6880.0048198JOURNAL OF CELLBIOLOGY714919.6880.14947200ATHEROSCLEROSISSUPPLEMENTS7449.6670.00094201PLANT CELL446999.5750.08771 202Physics of Life Reviews8289.4780.00274203BIOLOGICALPSYCHIATRY 406879.4720.08177204JOURNAL OF THEAMERICAN SOCIETY OFNEPHROLOGY310839.4660.06359205CLINICAL INFECTIOUS DISEASES496299.4160.12905206ACM Transactions on Intelligent Systems andTechnology10289.390.00683207CURRENT OPINION IN PLANT BIOLOGY 107369.3850.02855208LEUKEMIA194319.3790.05716209PSYCHOTHERAPY AND PSYCHOSOMATICS 30739.370.00558209PSYCHOTHERAPY AND PSYCHOSOMATICS30739.370.00558211Laser & Photonics Reviews 21149.3130.01196212STUDIES IN MYCOLOGY 14619.2960.00269213CANCER RESEARCH1429709.2840.25773214ANNALS OF THE RHEUMATIC DISEASES 293379.270.07422215ISME Journal83099.2670.04025216AMERICAN JOURNAL OF GASTROENTEROLOGY 289959.2130.06233217INTERNATIONAL JOURNAL OFEPIDEMIOLOGY159859.1970.03884218SEMINARS IN CANCER BIOLOGY47319.1430.01322219SLEEP MEDICINE REVIEWS35129.1410.00922220Annual Review of Genomics and Human Genetics 23459.1320.01042221Wiley Interdisciplinary Reviews-ComputationalMolecular Science 11769.0410.00526222BIOTECHNOLOGY ADVANCES 81848.9050.02099223TRENDS INENDOCRINOLOGY ANDMETABOLISM60478.8680.01917224DRUG RESISTANCE UPDATES21138.8160.00483225NUCLEIC ACIDS RESEARCH1263568.8080.33438226IEEE Transactions onIndustrial Informatics26448.7850.00823227FISH AND FISHERIES22438.7550.00818228CURRENT OPINION INSTRUCTURAL BIOLOGY104658.7470.03492229CURRENT OPINION INCELL BIOLOGY140698.7360.04667230PROGRESS IN NUCLEARMAGNETIC RESONANCESPECTROSCOPY21958.7110.00437231HUMAN REPRODUCTIONUPDATE57998.6570.01346232ADVANCES IN COLLOIDAND INTERFACESCIENCE78918.6360.01381233SCHIZOPHRENIABULLETIN131888.6070.02955233SCHIZOPHRENIABULLETIN131888.6070.02955235Chemical Science93038.6010.04009 236DIABETES CARE527718.570.10565237CURRENT OPINION INGENETICS &DEVELOPMENT81658.5680.03152238THORAX187808.5620.03777 239ONCOGENE626038.5590.12625240CHEMISTRY OFMATERIALS797448.5350.13293241KIDNEY INTERNATIONAL367318.520.06367 242eLife7228.5190.00277243Light-Science &Applications2668.4760.00114244DIABETES498018.4740.09335245Journal of Molecular CellBiology10118.4320.00572246FRONTIERS IN ECOLOGYAND THE ENVIRONMENT53628.4120.01917247CELL DEATH ANDDIFFERENTIATION155528.3850.04351247Physical Review X11308.3850.01023249Nature Reviews Nephrology 19158.3680.01157250BIOMATERIALS812298.3120.13731 251CEREBRAL CORTEX247088.3050.07676 252NEUROLOGY768458.3030.11936253METABOLICENGINEERING38338.2580.01015254Geochemical Perspectives348.250.00034 255EMBO Molecular Medicine21888.2450.0134256Cold Spring HarborPerspectives in Biology54198.2260.04533257GLOBAL CHANGEBIOLOGY229878.2240.06802258CLINICAL CANCERRESEARCH683118.1930.18711259PROGRESS IN SOLIDSTATE CHEMISTRY16088.1820.00116260PLoS Genetics275818.1670.18782 261Advances in Catalysis14338.1430.00057262MEDICINAL RESEARCHREVIEWS35118.1310.00576263GONDWANA RESEARCH58798.1220.01679264Annual Review of Chemicaland BiomolecularEngineering5898.1090.0034265PLoS Pathogens256138.0570.14214266MASS SPECTROMETRYREVIEWS39048.0530.00796267CURRENT OPINION INBIOTECHNOLOGY102898.0350.02415268ARTHRITIS ANDRHEUMATISM468847.8710.0897269CURRENT OPINION INIMMUNOLOGY87147.8670.03193270Obesity Reviews63887.8590.02105 271EMBO REPORTS108677.8580.03964272CRITICAL REVIEWS INBIOTECHNOLOGY16527.8370.00293273NEUROPSYCHOPHARMACOLOGY215677.8330.05761274Theranostics11127.8270.00365275ACADEMY OFMANAGEMENT REVIEW177077.8170.01441276Annual Review ofAnalytical Chemistry13207.8140.01452277JOURNAL OF PINEALRESEARCH61367.8120.00753278Nature Protocols203997.7820.08865 279CLINICAL CHEMISTRY271927.7680.0376280PHARMACOLOGY &THERAPEUTICS111807.7450.02208281PHYSICAL REVIEWLETTERS3785687.728 1.00952282PSYCHOLOGICALREVIEW222437.7190.01853282PSYCHOLOGICALREVIEW222437.7190.01853284ANTIOXIDANTS & REDOXSIGNALING142737.6670.04464285CURRENT OPINION INCHEMICAL BIOLOGY90667.6520.02522286HYPERTENSION347517.6320.06457287AGEING RESEARCHREVIEWS23997.6280.00728288NEUROSCIENTIST35947.6180.00918289BIOCHIMICA ETBIOPHYSICA ACTA-REVIEWS ON CANCER36727.5840.01089290FRONTIERS INNEUROENDOCRINOLOGY30707.5810.00932291Journal of BiomedicalNanotechnology34747.5780.00677292ACS Catalysis44467.5720.01764293Cold Spring HarborPerspectives in Medicine12407.5590.00799294PERSONALITY ANDSOCIAL PSYCHOLOGYREVIEW35097.5450.00866295Mucosal Immunology24207.5370.01345 296Small224837.5140.07769297JOURNAL OFPSYCHIATRY &NEUROSCIENCE25197.4920.0066297JOURNAL OFPSYCHIATRY &NEUROSCIENCE25197.4920.0066299JACC-CardiovascularInterventions45587.440.02873300BMC BIOLOGY32147.4310.01637301Journal of CachexiaSarcopenia and Muscle5167.4130.00188302PLANT PHYSIOLOGY693457.3940.09957303CLINICALPHARMACOLOGY &THERAPEUTICS151067.390.03442304BRITISH JOURNAL OFPSYCHIATRY223647.3430.02925304BRITISH JOURNAL OFPSYCHIATRY223647.3430.02925306Nanotoxicology20157.3360.00625307Academy of ManagementAnnals7787.3330.00713307EPIDEMIOLOGICREVIEWS29537.3330.00514309JOURNAL OFPATHOLOGY148977.330.03607310EMERGING INFECTIOUSDISEASES243647.3270.06399311MUTATION RESEARCH-REVIEWS IN MUTATIONRESEARCH28207.3260.00678312BMC Medicine40527.2760.01741313JOURNAL OFCONTROLLED RELEASE316507.2610.05261314MOLECULAR &CELLULAR PROTEOMICS154917.2540.05307315GLOBAL ECOLOGY ANDBIOGEOGRAPHY61997.2420.01719316ACTACRYSTALLOGRAPHICASECTION D-BIOLOGICALCRYSTALLOGRAPHY143107.2320.06393317CURRENT OPINION INMICROBIOLOGY79177.2160.02586318Cell Reports24167.2070.01927 319ANNALS OF SURGERY382977.1880.06601320CLINICAL PSYCHOLOGYREVIEW89807.1790.02261321CURRENT OPINION INSOLID STATE &MATERIALS SCIENCE27107.1670.00456322EARTH-SCIENCEREVIEWS74607.1350.0186323STEM CELLS203997.1330.06148 324CHEST456517.1320.07787325EUROPEANRESPIRATORY JOURNAL274637.1250.05615326ChemSusChem69137.1170.02602327ECOLOGICALMONOGRAPHS90927.1070.00991328AUTOIMMUNITY REVIEWS 54567.0950.01633329ENVIRONMENTALHEALTH PERSPECTIVES313637.0290.0549330JOURNAL OFAUTOIMMUNITY42647.0180.0114331ARCHIVES OFNEUROLOGY221217.0080.04173332CRITICAL REVIEWS INCLINICAL LABORATORYSCIENCES114370.00177333Particle and FibreToxicology1934 6.9870.00601334JACC-CardiovascularImaging3744 6.9860.02309335Circulation-CardiovascularInterventions2311 6.9820.01584336Nano Research4140 6.9630.01919 337FUNGAL DIVERSITY2120 6.9380.0064 338HUMAN BRAIN MAPPING14858 6.9240.0418339AMERICAN JOURNAL OFCLINICAL NUTRITION52237 6.9180.08323340DIABETOLOGIA26485 6.880.05552 341mBio2747 6.8750.01705342JOURNAL OFMANAGEMENT9110 6.8620.01798343GREEN CHEMISTRY18513 6.8520.03992 344PLANT JOURNAL36475 6.8150.07366 345STRUCTURE13343 6.7940.04742346CURRENT OPINION INNEUROBIOLOGY12062 6.7650.03592347Circulation-CardiovascularImaging2341 6.7520.01403348Health Psychology Review302 6.750.00109349JOURNAL OFNEUROSCIENCE167915 6.7470.41376350Nanoscale16387 6.7390.05605351NEW ASTRONOMYREVIEWS790 6.7220.0029352CHEMICALCOMMUNICATIONS139193 6.7180.31646353Journal of PhysicalChemistry Letters13562 6.6870.06759354HUMAN MOLECULARGENETICS35897 6.6770.10701355BULLETIN OF THEAMERICAN MUSEUM OFNATURAL HISTORY2461 6.640.00256356Neuron Glia Biology561 6.6360.00161357Annual Review of PublicHealth3779 6.6270.00698357Annual Review of PublicHealth3779 6.6270.00698357Oncotarget2217 6.6270.01103360JOURNAL OF MATERIALSCHEMISTRY83225 6.6260.22697361TRAC-TRENDS INANALYTICAL CHEMISTRY8346 6.6120.01792362Molecular Plant3444 6.6050.01622 363Polymer Reviews1267 6.5930.00398364JOURNAL OF BONE ANDMINERAL RESEARCH23020 6.5890.04442365CHEMISTRY & BIOLOGY10344 6.5860.02944 366ANNALS OF ONCOLOGY24363 6.5780.07521367EUROPEAN JOURNAL OFHEART FAILURE6854 6.5770.0227368HARVARD LAW REVIEW4274 6.5670.00496 369AIDS22630 6.5570.05772370INTERNATIONALMATERIALS REVIEWS2534 6.5520.00371371CYTOKINE & GROWTHFACTOR REVIEWS4662 6.5370.00919372Clinical Gastroenterologyand Hepatology9149 6.5340.03274373IEEE WIRELESSCOMMUNICATIONS2910 6.5240.0119374IEEE TRANSACTIONS ONINDUSTRIALELECTRONICS24432 6.50.0612375IEEE CommunicationsSurveys and Tutorials2002 6.490.00959376Annual Review of Nuclearand Particle Science2322 6.4870.00646377Seminars inImmunopathology1649 6.4820.00842378CANCER TREATMENTREVIEWS4867 6.4660.01414379BIOSENSORS &BIOELECTRONICS26704 6.4510.05317380CANCER ANDMETASTASIS REVIEWS5249 6.4490.01335381GENETICS IN MEDICINE4703 6.4350.0194 382MOLECULAR THERAPY12709 6.4250.03936383CRITICAL REVIEWS INTOXICOLOGY3232 6.4140.00529384CURRENT OPINION INCOLLOID & INTERFACESCIENCE4931 6.3980.00944385NEW PHYTOLOGIST30697 6.3730.06453386JOURNAL OFINVESTIGATIVEDERMATOLOGY24351 6.3720.04247387MODERN PATHOLOGY11084 6.3640.02894388JOURNAL OF THEAMERICAN ACADEMY OFCHILD ANDADOLESCENTPSYCHIATRY16265 6.3540.02301388JOURNAL OF THEAMERICAN ACADEMY OFCHILD ANDADOLESCENTPSYCHIATRY16265 6.3540.02301390JOURNAL OF ECONOMICLITERATURE5479 6.3410.02386391Science Signaling6207 6.3370.04692 392ORGANIC LETTERS80234 6.3240.17842393PHILOSOPHICALTRANSACTIONS OF THEROYAL SOCIETY B-BIOLOGICAL SCIENCES29689 6.3140.08509394PSYCHOLOGICALINQUIRY2356 6.3120.00329395JOURNAL OF CLINICALENDOCRINOLOGY &METABOLISM69351 6.310.11799396IEEE TRANSACTIONS ONFUZZY SYSTEMS7208 6.3060.01207397Current Opinion in Virology1202 6.2980.00761398DRUG METABOLISMREVIEWS2314 6.2860.00346399OncoImmunology1133 6.2830.00331400ASTROPHYSICALJOURNAL193430 6.280.48138401DEVELOPMENT51998 6.2730.1198402Advances in EcologicalResearch1823 6.250.00158403ENVIRONMENTALMICROBIOLOGY15872 6.240.04951404Biotechnology for Biofuels1790 6.2210.00701405JOURNAL OF HIGHENERGY PHYSICS59088 6.220.16578406Clinical Epigenetics273 6.2190.00112407TRENDS INPARASITOLOGY5341 6.2170.01331408RADIOLOGY45811 6.2140.07197409AMERICAN JOURNAL OFTRANSPLANTATION17061 6.190.05028410EPIDEMIOLOGY9837 6.1780.02596 410EPIDEMIOLOGY9837 6.1780.02596412INTERNATIONALJOURNAL OFCARDIOLOGY15179 6.1750.03537413OPHTHALMOLOGY28188 6.170.0534 414ANESTHESIOLOGY22247 6.1680.03554 415CARBON39497 6.160.06461416Wiley InterdisciplinaryReviews-RNA1015 6.1540.00664417CRITICAL CAREMEDICINE33784 6.1470.06336418NEUROIMAGE69654 6.1320.17318419BRAIN BEHAVIOR ANDIMMUNITY7365 6.1280.02126420SEMINARS INIMMUNOLOGY3290 6.1240.01139421CATALYSIS REVIEWS-SCIENCE ANDENGINEERING2699 6.1110.00195422MOLECULAR CANCERTHERAPEUTICS15553 6.1070.04796423CLADISTICS3339 6.0910.00699424CRITICAL REVIEWS INMICROBIOLOGY1652 6.0870.0033425Geoscientific ModelDevelopment1427 6.0860.00986426JOURNAL OF CATALYSIS36258 6.0730.03432427International Journal ofNeural Systems1045 6.0560.00222428CORTEX5977 6.0420.01478 429JOURNAL OF FINANCE21843 6.0330.05272 430HEART15342 6.0230.03872430PRECAMBRIANRESEARCH11341 6.0230.01834432PHYSICS LETTERS B60958 6.0190.11683 433STROKE56480 6.0180.1038434APPLIED CATALYSIS B-ENVIRONMENTAL26457 6.0070.04907435CURRENT ISSUES INMOLECULAR BIOLOGY56860.00125435GLOBALENVIRONMENTALCHANGE-HUMAN ANDPOLICY DIMENSIONS619560.0166435GLOBALENVIRONMENTALCHANGE-HUMAN ANDPOLICY DIMENSIONS619560.0166438ALLERGY12455 5.9950.02636439Annual Review of FoodScience and Technology469 5.9780.00209439Nanomedicine-Nanotechnology Biologyand Medicine4175 5.9780.01155441INTERNATIONALJOURNAL OF PLASTICITY6866 5.9710.01539441SEMINARS IN CELL &DEVELOPMENTALBIOLOGY6082 5.9710.02596443QUARTERLY JOURNALOF ECONOMICS16827 5.9660.05316444DRUG DISCOVERYTODAY9454 5.9640.01963445BASIC RESEARCH INCARDIOLOGY3697 5.9550.00946446Circulation-Heart Failure2602 5.9450.0172 447AGING CELL5361 5.9390.02045447Cochrane Database ofSystematic Reviews39856 5.9390.1359449Molecular Oncology1517 5.9350.00736450BRAIN RESEARCHREVIEWS8452 5.930.01314451ADDICTION BIOLOGY2480 5.9290.0081 452MACROMOLECULES101162 5.9270.12282453BRIEFINGS INBIOINFORMATICS3308 5.9190.01404454EXPERT REVIEWS INMOLECULAR MEDICINE1708 5.9120.00625455PROGRESS INHISTOCHEMISTRY ANDCYTOCHEMISTRY331 5.9090.0007456PLANT CELL ANDENVIRONMENT15899 5.9060.02331457ACS Applied Materials &Interfaces16373 5.90.05406458PHYSICS TODAY3787 5.8930.01016459Social Cognitive andAffective Neuroscience2787 5.8840.01214459Social Cognitive andAffective Neuroscience2787 5.8840.01214461BREAST CANCERRESEARCH8270 5.8810.02826462JOURNAL OFCOSMOLOGY ANDASTROPARTICLEPHYSICS15169 5.8770.05947463SPACE SCIENCEREVIEWS7326 5.8740.02755464HAEMATOLOGICA12461 5.8680.04276465CELLULAR ANDMOLECULAR LIFESCIENCES19252 5.8560.05714466MOLECULAR ECOLOGY31185 5.840.06838 467PAIN30877 5.8360.0492 468ANALYTICAL CHEMISTRY102654 5.8250.16863 469Nanomedicine3485 5.8240.01043470MAYO CLINICPROCEEDINGS9716 5.8120.01909471CRITICAL REVIEWS INBIOCHEMISTRY ANDMOLECULAR BIOLOGY2868 5.810.00826472CANADIAN MEDICALASSOCIATION JOURNAL12130 5.8080.02482472CARDIOVASCULARRESEARCH21631 5.8080.04342474CURRENT OPINION INLIPIDOLOGY3898 5.8030.00963475Advances in MicrobialPhysiology1014 5.80.00138475Journal of ThoracicOncology8282 5.80.03954477JOURNAL OFEXPERIMENTAL BOTANY28801 5.7940.05576478BIOMACROMOLECULES27578 5.7880.05213479JOURNAL OF INTERNALMEDICINE8511 5.7850.01699480JOURNAL OFINFECTIOUS DISEASES44428 5.7780.09778481THROMBOSIS ANDHAEMOSTASIS17000 5.760.03667482REVIEWS IN MEDICALVIROLOGY1879 5.7590.00486483AMERICAN JOURNAL OFKIDNEY DISEASES19954 5.7560.03577483Forensic Toxicology417 5.7560.00088 485LAB ON A CHIP19558 5.7480.05854486CURRENT OPINION INNEUROLOGY5005 5.7290.01481487IEEE TRANSACTIONS ONPOWER ELECTRONICS17852 5.7260.03903488JOURNAL OF THE ROYALSTATISTICAL SOCIETYSERIES B-STATISTICALMETHODOLOGY14568 5.7210.01846489FREE RADICAL BIOLOGYAND MEDICINE32994 5.710.05157490PSYCHOLOGICALMETHODS6400 5.7080.00968491CHEMISTRY-AEUROPEAN JOURNAL69020 5.6960.1837492IEEE TRANSACTIONS ONPATTERN ANALYSIS ANDMACHINE INTELLIGENCE27275 5.6940.04888492JOURNAL OF ECOLOGY14830 5.6940.02753 494Acta Biomaterialia14631 5.6840.04612495PLANT BIOTECHNOLOGYJOURNAL3678 5.6770.01054496JOURNAL OF CHILDPSYCHOLOGY ANDPSYCHIATRY14316 5.6690.02445496JOURNAL OF CHILDPSYCHOLOGY ANDPSYCHIATRY14316 5.6690.02445498ENVIRONMENTINTERNATIONAL10171 5.6640.02177499PHYSIOLOGY2656 5.6450.00888500Pigment Cell & MelanomaResearch3649 5.6410.01039501EUROPEAN HEARTJOURNAL SUPPLEMENTS985 5.640.00162502JOURNAL OF MEDICALGENETICS11436 5.6360.02368503MOVEMENT DISORDERS18905 5.6340.04536 504CLINICAL SCIENCE8500 5.6290.01418505Molecular EcologyResources5567 5.6260.02742506COMPUTER-AIDED CIVILAND INFRASTRUCTUREENGINEERING1652 5.6250.00387507JOURNAL OF HEARTAND LUNGTRANSPLANTATION8078 5.6110.02248508Astrophysical JournalLetters45055 5.6020.1639509PSYCHONEUROENDOCRINOLOGY10669 5.5910.02402510JOURNAL OFNEUROLOGYNEUROSURGERY ANDPSYCHIATRY25643 5.580.03445511CHEMICAL RECORD1458 5.5770.00307512JOURNAL OF NUCLEARMEDICINE21301 5.5630.04187513JOURNAL OFTHROMBOSIS ANDHAEMOSTASIS14435 5.550.04611514CRITICAL REVIEWS INFOOD SCIENCE ANDNUTRITION5097 5.5480.00801515ACTA PSYCHIATRICASCANDINAVICA11812 5.5450.01313515ACTA PSYCHIATRICASCANDINAVICA11812 5.5450.01313。
2022考研英语阅读汤姆森路透Thomson Reuters Screen test汤姆森路透荧屏上的考验The information company, in danger of losing its top spot, gets a new boss为了防止失去榜首,新上司上位。
IN SEVEN years as head of Reuters, Tom Glocer brought the British-based news agency fromthe verge of bankruptcy to a state of rude health.汤姆?葛洛瑟在路透社高层工作了7年。
在这7年间,他把路透社,这家总部设在英国濒临破产的资讯社重新走上了正轨。
But he has done less well as chief executive of Thomson Reuters, the company created whenThomson, a Canadian purveyor of professional information for lawyers, accountants andothers, bought Reuters in 20xx.汤姆森是加拿大一家为律师,会计等供应信息服务的公司,在20xx年收购了路透社。
汤姆森路透信息公司也随之成立。
然而在收购之后,公司首席执行官汤姆?葛洛瑟的表现却不甚抱负。
Bloomberg, the firm s American rival, has almost wiped out its once-clear lead .彭博,路透在北美的竞争对手,缩小与路透社曾经的巨大差距,现已与路透的市场份额特别接近。
On December 1st Mr Glocer said he would step down at the end of the year. Hisreplacement, James Smith, the chief operating officer, is a former Thomson man.葛洛瑟说他会在今年年底辞职。
wlccCortellis™ for Competitive Intelligence药物研发的综合情报平台是Thomson Reuters Pharma的升级平台,底层数据与Pharma一致。
为您提供药物研发管线、交易、专利、公司内容及行业最新新闻。
具有多来源信息收集、自带强大分析工具、每天更新。
以报告的方式提供信息一般情况下,我们进行信息调研,最终总会将收集到的所有有用的信息整理为一份调查报告。
信息收集的过程是艰巨而繁琐的,而将信息整理为报告的过程也是十分具有挑战性的工作。
而Cortellis™ for Competitive Intelligence便是直接以报告的方式提供信息。
它将平台下数十个数据库提供的丰富信息整理为八种类型的报告:药物报告,公司报告,专利报告,文献报告、新闻报告、会议报告、交易报告和临床试验报告。
其中每一份报告都由工作人员围绕主题将所有相关信息进行了整理和综合,并附有业界专家撰写的综述和评论。
深入的药物报道通过Cortellis™ for Competitive Intelligence,科研工作者可以了解在研药物和已批准药物从开发、临床试验到上市和销售的各个阶段重要的科研、专利、商业和金融信息。
基于这些信息,研发人员可以对药物的研发过程和现状进行全面的了解,也可以对研发工作的最新进展进行紧密的跟踪,还可以对某个治疗领域的所有药物进行比较和分析。
通过药物报告可以获取以下信息:w w.i n ki n fo.o m.nccw w.i n ki n fo.o m.nwlc c其中“Development Profile”和“SWOT Analysis”是由业界专家根据收集的所有信息撰写的总结和竞争分析。
“Literature Review”是由业界专家根据收集的药物相关文献撰写的文献评论。
“Change History”可对药物的信息更新进行跟踪,详细了解药物不同时段的研发进展情况。
ThomsonReutersPharma:全球综合医药信息数据库——如何有效的使用单击此处编辑母版标题样式 Thomson Reuters Pharma单击此处编辑母版文本样式--如何有效使用第二级第三级2012年11月28日 2012年11月28日第四级林栋第五级技术支持,数据库产品部技术支持,数据库产品部全球综合医药信息数据库培训提纲一、内容介绍单击此处编辑母版标题样式三、检索四、分析单击此处编辑母版副标题样式五、生成报告六、跟踪与管理二、主页介绍汤森路透集团简介汤森路透集团是全球最大的专业与智能信息提供商; ? 其产品包括:Pharma, Integrity, Newport Premium, IDRAC, Innovation, GeneGo 等;单击此处编辑母版标题样式单击此处编辑母版副标题样式创腾科技是汤森路透集团在中国的战略合作伙伴,是其数据库产品在中国的销售代理商。
3服务于药物研发周期的不同阶段专利保护期基础研究药物发现临床前研究 I-III期临床专利保护过期报批发布上市仿制药单击此处编辑母版标题样式Thomson Reuters Integrity(早期研发)GeneGo MetaCore/Drug(系统生物学)单击此处编辑母版副标题样式IDRAC (政策法规)Newport Premium(仿制药)Thomson Reuters Pharma->Cortellis for Competitive Intelligence(立项、决策、跟踪、管理) Thomson Innovation(专利)创腾科技简介通过信息技术带动研发、管理和决策模式的变革与创新科技文献、化学信息与情报Thomson Reuters Pharma ? Newport Premium单击此处编辑母版标题样式计算机模拟软件Material Studio ? Discovery Studio单击此处编辑母版副标题样式信息管理、分析与决策Pipline Pilot ? Spotfire ? E-Notebook实验室信息管理系统性Watson LIMS ? SampleManager LIMS5内容介绍-Thomson Reuters Pharma药物交易知识产权各种期刊文献 ? 专利文献临床实验报告单击此处编辑母版标题样式 ? 科技会议论文文献和新闻新闻临床试验方案单击此处编辑母版副标题样式公司……基因序列化学靶标Thomson Reuters Pharma公司站点 ? 各国药物监管部门站点6内容介绍-Cortellis for Competitive Intelligence药物文献报告报告专利报告单击此处编辑母版标题样式单击此处编辑母版副标题样式会议报告交易报告公司报告会议专题报告Cortellis for CI临床实验报告Thomson Reuters Pharma内容介绍33,000多个重点药物报告(研发阶段变化、化学/生物数据、临床试验方案/结果、销售数据、市场份额、SWOT分析、相关专利等)? 3,000,000多化合物 ? 7,500 核心公司文档(研发品种分布、产品线、专利布局/分析、财务/股市、合作伙伴、涉及到的交易、临床试验、期刊文献等)单击此处编辑母版标题样式 ? 3,400,000 个以上专利13,000 个以上药物靶标60,000条以上的药物临床实验方案;20,000条以上的药物临床实验结果; ? 5,000,000 个以上药物相关基因、蛋白序列 ? 20,000 多个交易信息……单击此处编辑母版副标题样式培训提纲一、内容介绍单击此处编辑母版标题样式三、检索四、分析单击此处编辑母版副标题样式五、生成报告六、跟踪与管理二、主页介绍Thomson Reuters Pharma的登录页面单击此处编辑母版标题样式单击此处编辑母版副标题样式Thomson Reuters Pharma登录后的主页选择关心的领域单击此处编辑母版标题样式单击此处编辑母版副标题样式创建个性化主页单击此处编辑母版标题样式单击此处编辑母版副标题样式创建个性化主页单击此处编辑母版标题样式单击此处编辑母版副标题样式CORTELLIS for CI主页https:///doc/4616203086.html,/单击此处编辑母版标题样式单击此处编辑母版副标题样式CORTELLIS for CI 主页某个时间段内各研发状态的药物汇总单击此处编辑母版标题样式单击此处编辑母版副标题样式培训提纲一、内容介绍单击此处编辑母版标题样式三、检索四、分析单击此处编辑母版副标题样式五、生成报告六、跟踪与管理二、主页介绍1、快速检索(Quick Search)可以快速查找某一特定靶标、药物、公司、专利等;Quick Search单击此处编辑母版标题样式单击此处编辑母版副标题样式例1、快速检索药物及其药物报告单击此处编辑母版标题样式单击此处编辑母版副标题样式检索结果--药物报告单击此处编辑母版标题样式单击此处编辑母版副标题样式。