DGSS-REInfo系统介绍
- 格式:ppt
- 大小:12.39 MB
- 文档页数:46

数字地质调查系统(DGSS)的应用——对数字地质调查系统的认识数字地质调查系统DGSS(Digital Geological Survey System)是贯穿整个地质矿产资源调查过程的软件。
随着数字地质调查系统完善和应用,已逐步成为国内地质调查领域的主流软件和工具,数字地质调查系统由四大子系统组成:一、数字地质填图系统RGMap:具有整合显示地理、地质、遥感等多源地学数据,GPS 导航与定位,电子罗盘测量,路线地质调查地质点、地质界线、点间分段路线地质(不定长的)数据描述,产状、素描、化石、照片、样品、地球化学数据、重砂、矿点检查等数据采集,路线信手剖面自动生成、实测地质剖面导线、分层、地质描述、素描、照片、采样、化石等野外数据采集功能。
二、探矿工程数据编录系统PEData:探槽、浅井、坑道、钻孔探矿工程野外数据采集与原始地质编录,并现场实时自动形成探槽、浅井、坑道、钻孔探矿工程图件等功能。
三、数字地质调查信息综合平台DGSInfo:提供全国大、中比例尺标准图幅接图表,剖面厚度自动计算,剖面图和柱状图自动绘制,等值线计算与制图,多元统计计算与成图,地球化学数据采集、处理与成图,第四系钻孔综合剖面图、地球物理物理数据处理与成图,PRB 空间数据定量评价,实际材料图编辑与属性继承操作,1/10万实际材料图投影到1/25万图幅(或1/2.5万到1/5万),编稿地质图编辑与地质图空间数据库建立,异常查证结果数据库、矿点检查结果数据库以及综合地质构造图层、含矿地质建造图层、控矿构造图层、矿产地图层、矿化信息及找矿标志图层、蚀变带信息、物、化、遥等综合异常图层、矿产预测远景区图层、找矿靶区图层、地质工作部署建议图层等内容的成矿规律与矿产预测图数据库的建立等功能,满足完成野外手图、实际材料图、编稿地质图及地质图空间数据库整个过程的要求,覆盖各种比例尺填图全过程。
另外提供了探矿工程数据综合、处理、制图过程:探槽、浅井、坑道、钻孔探矿工程数据、勘探线数据、采样分析数据录入与组织管理,自动生成坑道、探槽、钻孔、浅井工程图件的基本内容投影在矿区平面图上,自动输出坑道、探槽、钻孔、浅井工程编入数据采集表、素描图、矿区平面图,多模式多用途钻孔综合柱状图应用等相关功能。
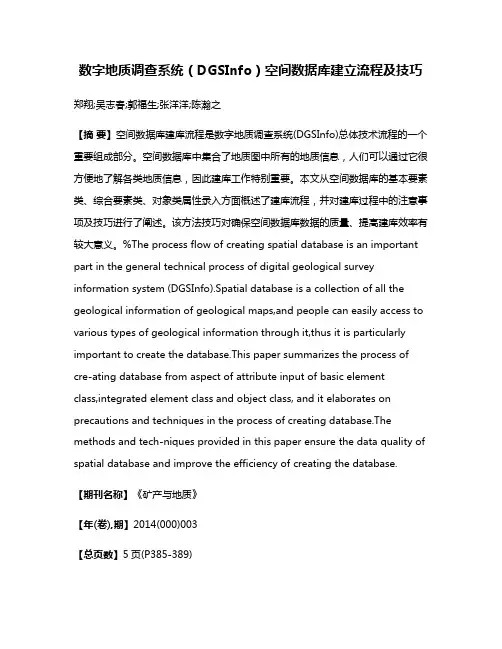
数字地质调查系统(DGSInfo)空间数据库建立流程及技巧郑翔;吴志春;郭福生;张洋洋;陈瀚之【摘要】空间数据库建库流程是数字地质调查系统(DGSInfo)总体技术流程的一个重要组成部分。
空间数据库中集合了地质图中所有的地质信息,人们可以通过它很方便地了解各类地质信息,因此建库工作特别重要。
本文从空间数据库的基本要素类、综合要素类、对象类属性录入方面概述了建库流程,并对建库过程中的注意事项及技巧进行了阐述。
该方法技巧对确保空间数据库数据的质量、提高建库效率有较大意义。
%The process flow of creating spatial database is an important part in the general technical process of digital geological survey information system (DGSInfo).Spatial database is a collection of all the geological information of geological maps,and people can easily access to various types of geological information through it,thus it is particularly important to create the database.This paper summarizes the process of cre-ating database from aspect of attribute input of basic element class,integrated element class and object class, and it elaborates on precautions and techniques in the process of creating database.The methods and tech-niques provided in this paper ensure the data quality of spatial database and improve the efficiency of creating the database.【期刊名称】《矿产与地质》【年(卷),期】2014(000)003【总页数】5页(P385-389)【关键词】空间数据库;流程;数字地质调查系统;地质信息【作者】郑翔;吴志春;郭福生;张洋洋;陈瀚之【作者单位】东华理工大学地球科学学院,江西南昌 330013;东华理工大学地球科学学院,江西南昌 330013;东华理工大学地球科学学院,江西南昌 330013;东华理工大学地球科学学院,江西南昌 330013;东华理工大学地球科学学院,江西南昌 330013【正文语种】中文【中图分类】P623.10 前言数字地质调查系统(DGSInfo)是中国地质调查局在MAPGIS软件的基础上二次开发而成的,建立了PRB数字填图过程及其相应的数据模型[1~4]。

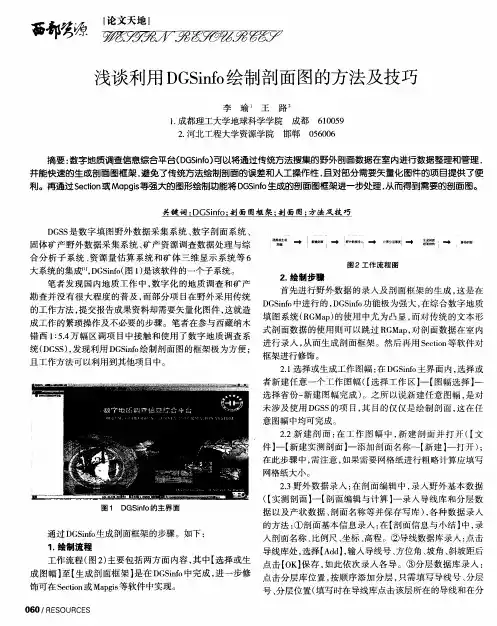
数字地质调查信息综合平台(DGSInfo)剖面原始数据快速录入方法及技巧高建国;范宇航;蒲松盛;杨昶;高智【摘要】实测地质剖面图是野外地质工作中一个重要环节.为了能够准确测量、实时整理、快速录入剖面原始数据,避免低效、繁琐、不利于对比,易出错的局面,基于数字地质调查系统(DGSInfo)实测剖面这一平台,配合SectionInfo.mdb、GeoSection.mdb等剖面数据库,利用Microsoft Access数据库处理软件进行快速原始数据整合录入,进而高精度、高效率绘制实测地质剖面图,对后期野外路线PRB采集定位、地层单元准确划分以及对整个地区地质背景的了解均具重要指示意义.【期刊名称】《四川地质学报》【年(卷),期】2017(037)004【总页数】4页(P682-685)【关键词】DGSInfo;*.MDB;Access;地质剖面【作者】高建国;范宇航;蒲松盛;杨昶;高智【作者单位】成都理工大学,成都 610059;成都理工大学,成都 610059;成都理工大学,成都 610059;成都理工大学,成都 610059;成都理工大学,成都 610059【正文语种】中文【中图分类】P628+.5RGMAP系统是集3S(GPS/GIS/RS)为一体的野外数字采集系统,初步实现了“地质调查主流程信息化”目标。
随着技术的发展和地质工作的需要,2010年中国地质调查局又研发了数字地质调查系统DGSS(Digital geology survey system)[1],相对完善了RGMAP系统,集合了RGMAP数字填图、PEDate探矿工程数据编录、DGSInfo数字调查信息综合平台和REInfo资源储量估算与矿体三维建模四大子系统,其中DGSInfo近年来在大、中比例尺区域地质填图中备受关注,其整合了路线、剖面、第四纪钻孔和探矿工程的室内资料汇总、编辑乃至出图几个重要步骤,逐步成为了中国地质调查的主流软件体系[2]。
![数字填图(DGSS)操作步骤[互联网业]](https://uimg.taocdn.com/6fc061f8fe4733687f21aa92.webp)

Change your water, Change your lifeTable of ContentsApplication Naming (4)Internet URL (4)Targeted Users (4)Data in DGS Application (4)Support and Inquiries (4)DGS View Concept (5)View Availability (5)’All Bubbles’ View and ‘6A & Above’ View Samples (5)DGS Main Page (6)Modules & Function List (6)Home Link (7)Open View (7)View Control (9)Zoom Slider (10)Other than Zoom Slider (10)Menu Controls (11)Genealogy Module (13)Usage (13)Bubble Size & Data (13)Rank Colors (13)Bubble Details, Sales Unit Count (14)Open View from within Genealogy Module (14)Tabs (14)Hide Trailing 1A bubbles (15)Hide Trailing F bubbles (15)Collapse & Expand (15)Monitor Size (15)Local View Module (16)Search Module (17)Legend Module (17)Details Module (18)Sales Count (19)Display Module (20)Actions Module (21)PDF Output (21)Layers Display Control (22)Timeout Function (22)Footer Area (22)DGS View ConceptDepending on the rank of distributor, there may be one or two views to his or her genealogy. View Availability’All Bubbles’ View and ‘6A & Above’ View Samples’All Bubbles’ View and ‘6A & Above’ View Samples'6A & Above' View6A424A 6A 6A 6A2 6A2 6A 6A6A426A83'All Bubbles' View2A1A 3A 4A 6A325A 6ADGS Main PageWelcome to Distributor Genealogy Solution main page!※The captured image is airbrushed out to protect personal information.DGS Main Page & ModulesModules & Function List•Home Link•Open View•View Control•Zoom Slider•Menu Control•Genealogy module•Local View module•Search module•Legend module•Details module•Display module•Actions moduleGenerate PDFLayers Display Control•Timeout•Footer AreaHome LinkPress the home button to select the source bubble.Home SelectedOpen ViewSelect a bubble out of bubbles in display to load its genealogy. There are two ways to load a genealogy. You can choose from Process 1 of Process 2.Process 1:1.) Enter a distributor ID and press themicroscope button as illustrated on the left.Or press the cross button to clear the input.2.) Exact ID# is required. (cannot search bypartial match). If an ID# cannot be found, a warning popup appears.Distributor ID not foundHome LinkOpen View button3.) If distributor’s rank is above 6A2, two viewswill be available ([All Bubbles] view or [6A & Above] view). Please select one. If rank is 6A or below, only one view is available and it will be loaded into Genealogy module by default.*** For more info on views, please refer to DGS ViewConcept .Process 2:1.) Right-click on the bubble and select [OpenView].On a touchscreen PC device, a right-click on a non-touchscreen PC device can be achieved by tapping and holding on the targeted bubble.Open View2.) If distributor’s rank is above 6A2, two viewswill be available ([All Bubbles] view or [6A & Above] view). Please select one. If rank is 6A or below, only one view is available and it will be loaded intoGenealogy module by default.*** For more info on views, please refer to DGS ViewConcept .View ChoiceView ChoiceView ControlClicking or tapping the ‘HORIZONTAL’ ‘VERTICAL’ switches the type of genealogy displayed horizontally or vertically.View Control ‘HORIZONTAL’View Control ‘VERTICAL’・HORIZONTAL DisplayHORIZONTAL Display・VERTICAL DisplayVERTICAL DisplayZoom Slider•Clicking or tapping the ‘Zoom Slider’ switch at the top right corner enables or disenables zoom slider.Zoom slider controlZoom slider is on by default and it is located at the top-left corner.•Sliding the switch on the zoom slider to either direction controls the zoom level of bubbles in Genealogy module .・Zoom at 35%Zoom at 35%・Zoom at 90%Zoom at 90%Other than Zoom SliderZoom in or out can be achieved by combination usage of keyboard and mouse by press & holding the CTRL key and scrolling up or down the scroll wheel of a mouse at the same time. It can be achieved by pinching in or pinching out with your tablet-like device.Menu ControlsMenu consists of Local View module , Search module , Legend module , Details module , Display module , and Actions module .•Clicking or tapping the control at the top-right corner illustrated below, the right-hand side menu appears or disappears.Menu control•‘Menu Auto’ is enabled or disabled by clicking the switch illustrated below. When ‘Menu Auto’ is on, menu appears when a bubble is selected in Genealogy moduleand disappears when a bubble is not selected.Menu Auto OnAuto menu offAuto menu on with bubble selectedRight-hand side menuMenu Auto Off•Click on the white area in Genealogy module to clear selected bubble.Auto menu on with bubble selected Auto menu off with bubble unselected (clicking white space)Genealogy ModuleUsage• Viewing of distributor’s genealogy.• Details of a selected bubble are displayed in the Details module .• Upline and downline info of a selected bubble are displayed in the Local View module . •Usages of Local View module , Search module , and Display module are reflected in the Genealogy module .Bubble Size & DataAmount of info displays in a bubble varies accordingly to the level of zoom-in and zoom-out.Zoom-inZoom-out1st row : Rank : Distributor ID : Registered branch 2nd row : Distributor name or company name, (Age)3rd row : 8-pt sales (MTD) : Group sales (MTD) : 8-pt accumulated sales 4th row : Registration date*** Note: Canceled customer or canceled distributor’s name is shown as ‘CANCELED’.1st Row : Distributor ID2nd Row : 8-pt sales (MTD) : Group sales (MTD) : 8-pt accumulated salesNo Text is displayed.Bubble Zoom-in, Zoom-outRank ColorsRank ColorsBubble Details, Sales Unit CountPlease refer to Details module for more detailed info of bubbles or sales unit count.SummaryDisplays the count of bubbles by ranks (includes source distributor, its downline bubbles, canceled customers or canceled distributors, and other downline group leaders if any).SummaryOpen View from within Genealogy ModuleAside from using Load Distributor Genealogy function to open a distributor’s genealogy, right- clicking a bubble and choose ‘Open View’ can achieve the same. Please refer to Open View module for more details.Open ViewTabsLoading a distributor’s genealogy generates a new tab. Multiple distributor’s genealogy can be viewed at any time by switching tabs.TabsTo close a tab, press the ‘X’ sign on the tab.Close a tabWhen closing a tab, DGS displays a confirmation popup.Confirmation to close a tabUp to 5 tabs can be displayed. Causes an error indication for trying to open 6th tab.Hide Trailing 1A bubblesYou can hide trailing 1A bubbles by checking the box of [Hide Tralling 1A bubbles]. Un-check the box to unhide the bubbles.Hide Trailing F bubblesYou can hide trailing F status bubbles by checking the box of [Hide Tralling F bubbles]. Un-check the box to unhide the bubbles.Hide Icon will show up inside the bubbles if they contain hidden bubbles underneath.Hide IconCollapse & ExpandAvailable for bubbles with downline distributors. You can collapse or expand bubbles by clicking on -(Minus) or +(Plus). The space made by collapsing will be compressed.CollapseBefore collapsingExpandYou can download the image displayed in Genealogy module and output as a PDF file in Actionsmodule . The layout of the image can be adjusted by collapsing and expanding bubbles.Monitor SizeBubble size is governed by number of pixel. The higher the resolution, the more bubbles are displayed by default.Hide Trailing F bubblesHide Trailing 1A bubblesLocal View ModuleThe Local View module is developed to make it easy to view a specific bubble’s connection (upline & downline) as it may be difficult to view so in the Genealogy module since the upline bubbles are spread widely across the screen as the number of downline bubbles increases.Local View module with Genealogy module•Selected bubble in Genealogy module is displayed inside the Local View module.•Two levels of upline bubbles, one level of downline bubbles(if any) are displayedEnables searching within Genealogy module.Search Module Search Module and Genealogy Module•Partial match, Complete match of Distributor ID•Search module requires at least 3 digit. Error message will appear for insufficient input. •Search result shows ‘Distributor ID’ and ‘Branch’.•By selecting one of the data in the search result within Search module, the targeted bubble inside Genealogy module will be selected. At the same time, the same bubble info will be displayed in Local View module and Detail module .Legend ModuleDescribes Rank ColorsLegend Module Legend Module and Genealogy ModuleDisplays details of a distributor by selecting a bubble either inside Genealogy module or Local View module.Details Module Details Module and Genealogy Module#Display in DGS Descriptions1 ID: Distributor ID2 Name: Distributor name or company name, (Age)*** Canceled customer or distributor’s name is shown as ‘CANCELED’.3 Rank: Sales rank4 Branch: Registered Branch Office5 Sales [Status]: Distributor sales status (ex. F status)6 Sales [8-pt]: 8-point sales unit count [Month to Date]7 Sales [Group]: Group sales unit count [Month to Date] (available for distributorof sale rank 6A & above)8 Sales [8-pt, accumulated]: 8-point accumulated unit count9 Purchase date: Purchase date of access to DGS(E8PA membership)8 BP BP Point *sales unit count of old ID in case of FA9 Last sales date: Date of last direct sale made10 Sales status down: Remaining day count before status down11 Sponsor registered rank: Sponsor’s Sales rank*** Data is based on the Enagic SystemSales CountBelow explains how the sales count is displayed in DGS based on various business situation.You can temporarily hide bubbles you want to omit in Genealogy module for easier overviewing.Display Module and Genealogy Module•Right-click on a bubble and select‘Hide’to hide the targeted bubble and bubbles underneath it.•Hide Icon will show up inside the upper bubble of hidden bubbles. Bubbles with Hide Icon contain hidden bubbles underneath.Before Hide After Hide•Overview of hidden bubbles will be displayed inside Dispay module. Click on ’UnHide’ button to expand hidden bubbles.Actions module contains PDF output and Layers Display Control.Actions module and Genealogy module※Clicking on ’PDF Output Icon’ at the bottom-left corner is shortcut to Actions module.PDF OutputGenerates PDF output of Genealogy module.It is prohibited to share output with personal data to any non-Enagic external party. Handle such information with caution and extreme care.Failure to comply may result in the possibility of legal actions.•Generates PDF file and download it by clicking on ’Generate PDF’ in Actions module.Download process may vary depending on the device you use. Please check the setting of your device if necessary.•The following actions will be reflected in PDF output. (Hidden bubbles remain hidden) Collapse & Expand‘Hide’action in Display moduleHide Trailing 1A bubbleHide Trailing F bubbleLayers Display ControlLayers Display ControlYou can designate the number of layers displayed in Genealogy module .• Example of 2 layers display control is described as below. Hide Icon will show up inside the bubbles if they contain hidden bubbles underneath.Show all layers• Designated number of layers will be shown at the bottom-left corner.Timeout FunctionWhen there is no user action for 20 minutes, browser redirects to https:///mypage/login.php . Re-logon is required to use DGS again.Footer AreaFooter Area contains Contact Info and Enagic links. Footer Area opens by clicking on ’Expand footer’ at the bottom-right corner.Designate 2 layers display control。
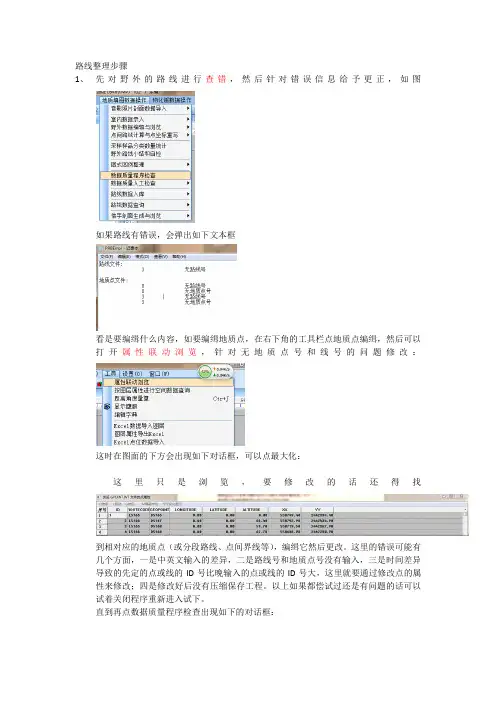
路线整理步骤1、先对野外的路线进行查错,然后针对错误信息给予更正,如图如果路线有错误,会弹出如下文本框看是要编缉什么内容,如要编缉地质点,在右下角的工具栏点地质点编缉,然后可以打开属性联动浏览,针对无地质点号和线号的问题修改:这时在图面的下方会出现如下对话框,可以点最大化:这里只是浏览,要修改的话还得找到相对应的地质点(或分段路线、点间界线等),编缉它然后更改。
这里的错误可能有几个方面,一是中英文输入的差异,二是路线号和地质点号没有输入,三是时间差异导致的先定的点或线的ID号比晚输入的点或线的ID号大,这里就要通过修改点的属性来修改;四是修改好后没有压缩保存工程。
以上如果都偿试过还是有问题的话可以试着关闭程序重新进入试下。
直到再点数据质量程序检查出现如下的对话框:2、对图面的修饰,使图面更整洁清晰。
包含整理的内容有GPS点多余点的删减,地质点的移动(移到十字架)(P过程),分段路线(R过程),点间界线(B过程)。
对点的编缉,主要是移动点,对线的编缉主要是线上移点。
3、对图面修饰好之后要对点坐标重新写入和点间路线的重新计算。
主要是完成点坐标写入与点间路线计算……(这里的地质点和分段路线一定要处在编辑状态)4、点开野外路线小结与自检,点野外小结窗口右下角的PRB多级检查,在弹出来的窗口右角点开始统计,然后把统计出来的数据放到野外小结的开头处。
5、对地质点和产状进行静态标注6、对地质点描述进行补充完善。
7、地质点描述要点日期:2013.07.07 天气:晴(晴转阵雨等)人员:吴晓东(掌图)、赖春来(记录)路线号:L6001 地点:旗鼓岭北山脚下村路线任务:1:1万路线地质调查点间路线地质:从D6001往D6002,沿途可见大量石英脉滚石,植被覆盖严重,少见基岩出露,仅在水沟处可见灰白色硅化石英砂岩出露。
地质点号:D6002位置:X: Y: H:位置说明:水沟边(小路边)点性:岩性控制点(界线点、岩性分界点、构造观察点、矿产观察点)露头:天然好(中、差,还有人工好、中、差)风化程度:全风化(强、中、弱、微、未风化)地质点描述:此点为帽子峰组灰白色变细粒长石石英砂岩与金鸡组紫灰色的含砂质页岩的界线点,二者接触界线较清楚,为角度不整合接触关系。


数字地质调查系统(DGSInfo)空间数据库建立流程及技巧数字地质调查系统(DGSInfo)是一种重要的空间数据库,它能够对地质调查中的数据进行管理、整合和分析,并且具有较高的科学管理性和准确性。
建立DGSInfo空间数据库需要一定的技术和流程,下面将详细介绍。
一、数据库设计1.确定数据需求在建立DGSInfo数据库之前,首先要明确所需要的数据和功能。
根据地质调查的目的和方法,确定需要存储哪些数据,例如矿产资源、钻孔数据、地层地质、地形地貌等。
2.设计数据模型数据模型是数据库的基础,因此需要在数据库设计前仔细考虑。
数据模型的设计应根据实际的数据需求来进行,可以使用ER模型或UML建立实体与属性之间的关系。
此外,还需要考虑数据之间的关联性以及数据的层级结构。
3.确定数据库结构在确定了数据模型之后,可以根据实际的需求设计出具体的数据库结构,包括表格的名字、字段的名字、类型、长度、是否必填等信息。
此外,还需要设定表格的主键和外键。
二、数据采集和处理1.采集数据采集地质数据是建立数字地质调查系统的基础,因此需要根据实际需要进行数据的采集。
采集地质数据包括有关地形地貌、地层地质、矿产资源、钻孔数据等信息。
2.处理数据采集到的数据需要进行处理,包括数据的清洗、转换、整合、归类等。
处理数据可以使用地理信息系统(GIS)或其他数据处理软件,对数据进行格式化,同时对有效数据进行数值计算、统计等分析。
三、数据库建立1.选择合适的数据库管理系统根据实际的需求和预算,选择合适的数据库管理系统(DBMS)。
目前市面上比较流行的DBMS有Oracle、MySQL、SQL Server等,可以根据不同需求选择合适的DBMS。
2.建立数据库根据数据库结构和数据需求,在DBMS中创建数据库和数据表格。
在创建数据库和数据表格时,需要仔细考虑表格的命名规则、数据类型和大小等问题,以及表格间的关系。
3.导入数据将处理好的数据导入数据库中,注意数据的完整性,进行数据插入前要进行数据一致性检查,如外键约束关系。
综合信息平台0、【字符与符号库路径设置】开始-数字地质调查系统-字符与符号库路径设置当打不开界面时,选择此步骤重新设置。
1、【建立工程】拷贝全部页面:PrtSc拷贝当前页面:Ctrl+Alt+PrtSc1.1【选择工作区→按省份选择→内蒙古→新建矿区→输入矿区基本信息】完成操作【√勾选拷贝背景文件→选择背景文件所在文件夹】若拷贝不成功,可在后面手工添加文件【背景图层】:背景即为基本的图层信息包括地形、地质、图框(生成标准图框)、基点基线、重要工程点不包括勘探线、工程信息、品位信息,之后系统从外部导入数据自己建立工程库,管理所有数据,并成图。
2、【建立探矿工程属性结构】建立ZK、TC、KD、QJ工程的属性结构将外部数据结构导入系统本身数据结构中【准备工作】将ZK、TC、KD、QJ整理为标准格式的数据表字段顺序不固定,但是关键字段必须有,其中字段含义见【字典】【点投影】将ZK、TC、KD、QJ投影为wt格式文件2.1【添加项目→选择ZK、TC、KD、QJ】2.2【工具→合并图层→选择合并文件】点文件的必要所有关键字段,与钻孔数据库格式保持一致。
否则工程点系统自动投影出错。
注意关键字段:TC、KD、QJ:均为XX3,YY3,HH3ZK:COORD_X1,COORD_Y1 ,COORD_H1TC、KD的左右壁均为2,否则素描图将窄。
2.3【探矿工程数据→工程点批量重投影→探槽、钻孔、坑道】以显示合并后工程点,对照比较2.4【设置→查看坐标信息】查看当前坐标信息,以防出错。
3、【导入探矿工程数据】3.1【探矿工程数据→批量建立工程数据目录→分别选择探槽、钻孔、坑道】3.2【探矿工程数据→工程区基本数据库→打开数据库文件】【把剖面基本信息数据库、剖面测量数据库拷贝到【03Mine_Pro_BaseInfo】粘贴剖面线(勘探线)基本信息(起点、终点)作为剖面起止标示用【04Exp_Pro_Survey】粘贴剖面线(勘探线)测量信息(起点、桩点、终点)作为剖面地形用【点击剖面基本信息、剖面线测量信息】显示相关信息3.3【探矿工程数据-工程数据导入导出(分别导入探槽、钻孔的各个数据表)】【选择excel文件→选择原始文件→选择相应表头→导入】TC:导线文件、分层文件、分样文件,其他产状文件ZK:回次文件、弯曲度文件、分层文件、分样文件、岩性文件、岩性花纹文件,其他产状文件KD:导线文件、分层文件、分样文件,其他产状文件QJ:分样文件注意文件结构与系统结构一致,否则出错注意列号、行号对应系统没有文件,可以自动添加表名注意:分层—岩性描述,否则钻孔柱状图中栏目为0分样—采取率,否则钻孔柱状图中栏目为0注意TC、KD采样位置为2,否则采样条位于底部。
测绘信息管理系统简介系统简介测绘信息管理系统是将测绘企事业单位的一切信息资源用信息化的系统管理起来,包括单位的项目、合同、测绘业务、档案、人事、资产、客户信息等。
南方数码为广大测绘单位量身定制的信息管理系统,充分考虑测绘管理与其它管理工作的差异性,连接各个部门,同时提供与多种测绘软件的接口,实现部门间数据的交换和业务的网上流转。
构建统一的信息交流、知识共享与协作办公的平台,为测绘业务部门和管理部门日常工作提供实时的信息资源,实现无纸化办公,充分利用现有资源提高各业务部门的工作效率与单位管理水平,为管理部门的决策提供依据。
系统建设目标信息化测绘技术是测绘技术、信息技术、通讯技术等多种学科交叉融合的产物,对信息资源的组织和管理、开发和利用是信息化的出发点和落脚点。
结合测绘部门的职能和工作特点,建设信息化管理系统主要实现以下几个目标:(1)建立完善的信息化测绘生产经营体系,对测绘生产的工艺流程进行改造和升级,无纸化办公,提高测绘生产效率,增强测绘保障能力。
(2)建立测绘项目,合同数据管理体系,领导者实时的掌握单位的运营状况,对单位的资源分配、发展规划、奖金预算等制定合理计划。
(3)建立测绘成果管理体系,对单位多年积累的成果数据信息化管理,安全使用,提高测绘成果应用和服务水平。
(4)建设单位日常办公业务、资产管理、档案管理、人事信息等信息的管理、分析和辅助决策的信息化测绘管理体系。
(5)建设单位统一的协同办公、信息交流和知识共享平台,提高核心竞争力与管理水平,实现无纸化办公、规范化作业、信息化管理的总体目标。
系统功能模块简介结语测绘信息化管理系统(以下简称系统)将测绘生产经营与单位的日常办公管理完美结合,面向不同层次的使用者,有不同的功能表现:对于单位的领导者,系统用于全面监管单位的测绘信息,特别是项目、合同数据,实时的的掌握单位的项目运作状况以及项目收费明细,对这些基础数据分析为领导的决策提供依据。
对于单位的中层管理者,系统利用业务各环节提供的基础数据信息,提炼出有用的管理信息,把握业务进程,降低经营风险,提高生产效率。
数字地质调查系统DGSS的基本概念和最新进展地质矿产资源调查的主要工作内容包括中—大比例尺地质矿产填图、探矿工程和采样、地球化学勘查、地球物理勘查、重砂测量、遥感地质调查、矿产检查和综合研究、资源量估算、矿体三维显示等。
由于涉及的专业多、内容复杂,因此,一体化的描述、组织、管理和处理,不同阶段的数据模型具有无缝互通和继承的技术问题,成为数字地质调查系统研究的主要内容和实现的难点。
正因如此,国内外矿业界在数据采集后的处理方面,特别是在矿山的储量计算、矿山生产的三维可视化技术方面,形成了一系列技术含量高、价格昂贵的计算机软件系统。
国外具有代表性的有MINMINE(澳大利亚)、Minesight(英国)、DATAMINE(美国)、Surpac(澳大利亚)、Mircomine(澳大利亚)、Vulcan(澳大利亚)等。
但目前国内外还没有贯穿整个地质矿产资源调查完整全过程的软件,包括覆盖贯穿于矿床预查前(矿调、填图)、预查、普查、详查、勘探和开采的各个阶段的软件,集地质填图和地质剖面法、地质块段法、地质统计学法3种储量计算方法为一体的三维可视化软件系统。
数字地质调查系统(2010)DGSS的完成和推广使用对解决以上问题起到了很大的作用。
据国土资源网2011年3月17日报道,由中国地质调查局发展研究中心李超岭等人编写的《数字地质调查系统操作指南》出版发行。
数字地质调查系统涵盖地质调查、矿体模拟等内容,实现了地质填图、固体矿产勘查的全数字化过程。
该书由上、中、下三册组成,包括“数字地质填图系统操作指南”、“探矿工程数据编录系统操作指南”、“数字地质调查信息综合平台操作指南”、“资源储量估算与矿体三维建模信息系统操作指南”等内容。
另据中国国土资源报2011年5月25日报道,中国地质调查局发展研究中心研发的“数字地质调查系统(2010)”,由数字地质填图系统等4个子系统构成,这4个子系统近日分别获得了计算机软件著作权。
数字地质调查中地球化学样品数据Excel采集模型的构建朱正勇;黄景孟;胡飞;鲁显松;陈曦;王曼丽【摘要】基于数字调查信息综合平台的地球化学测量样品数据采集,是以Access 进行数据的存储处理关联,当前的技术手段普遍操作繁琐耗时;而Excel处理数据具有自由、方便、可运算、兼容性好的特点,基于Excel开发出适用于地球化学样品数据采集的模型,以DGSInfo地球化学测量样品库为原型,以原始字典库为数据源,Excel中设置数据选项的多选框、运算公式及触发条件,野外运用手机进行地球化学样品数据的采集,取得较好的效果.【期刊名称】《资源环境与工程》【年(卷),期】2019(033)002【总页数】4页(P247-250)【关键词】数字调查信息综合平台;地球化学样品数据采集;Excel采集模型;自动化【作者】朱正勇;黄景孟;胡飞;鲁显松;陈曦;王曼丽【作者单位】湖北省地质调查院,湖北武汉 430034;湖北省地质调查院,湖北武汉430034;湖北省地质调查院,湖北武汉 430034;湖北省地质调查院,湖北武汉430034;湖北省地质调查院,湖北武汉 430034;湖北省地质调查院,湖北武汉430034【正文语种】中文【中图分类】P628数字地质调查系统DGSS(Digital Geological Survey System)是中国地质调查局自主版权的数字地质调查系统软件,其贯穿整个地质矿产资源调查过程,功能涵盖区域地质调查、固体矿产勘查、矿体模拟、品位估计、资源储量估算、矿山开采系统优化等内容;该系统基于数据“层”模型、数据流“池”技术、不同阶段数据模型继承技术、数据互操作技术和3S技术,实现了整个地质调查过程的无缝数字化与一体化,并创新开发了地质三维罗盘和野外数据采集为一体的野外数据采集器,不但为地质人员应用高新技术降低了门坎,而且极大地提高了研究精度和效率,丰富了成果表现形式和服务形式[1]。
随着数字地质调查系统的完善和应用,该系统已逐步成为国内地质调查领域的主流软件和工具。