三维图像专业处理软件Dragonfly 应用-面孔隙率的计算 哈工大丁浩原创
- 格式:pdf
- 大小:477.01 KB
- 文档页数:4
间剪切性能影响较为突出[4-5]。
因此,孔隙含量分析对于复合材料制件内部质量评定、质量提升以及产品工艺的持续改进起着非常积极和重要的作用。
现阶段,主要的复合材料孔隙含量检测分析方法分为破坏性检测法和无损检测法。
破坏性检测法主要包括密度测量法、吸水法、光学显微图像法和酸溶解法。
无损检测法包括超声检测法和射线检测法等[6-7]。
常见的复合材料光学显微图像分析方法有显微镜标尺测定法、放大网格计数法和图像分析仪法。
图像分析仪法是根据光学显微图像孔隙区域与良好区域灰度不同的原理工作的一种自动化统计方法,受人为因素影响较小,但容易受到试样表面质量的影响,统计误差较大。
显微镜标尺测定法和放大网格计数法主要通过人工判断孔隙相对于辅助网格的大小,进而间接获得孔隙含量结果,其统计数据量庞大,且不同的统计人员会引起统计结果的偏差,效率极低。
此外,在各大高校和科研单位中也会使用ImageJ等图像处理软件实现显微图像孔隙含量分析,但其适应力较差,对金相样品制样要求较高,适用性难以保证[7-8]。
由于实际金相样品通常会存在划痕、附着物等特殊情况,而人工孔隙统计过程有着非常高的灵活性,会主动识别与规避以上特殊情况,因此显微镜标尺测定法和放大网格计数法为目前主流的孔隙含量分析手段。
传统复合材料孔隙含量人工分析过程存在统计试样多、统计周期长、人工统计存在差异等问题,目前国内暂时没有准确高效的孔隙含量分析手段。
近年来,神经网络算法以其更接近人脑思考的特性广泛应用于模式识别、图像分割、智能控制等领域,具有大规模并行处理、分布式存储和处理、自适应、自组织、自学习能力等特点[9-10]。
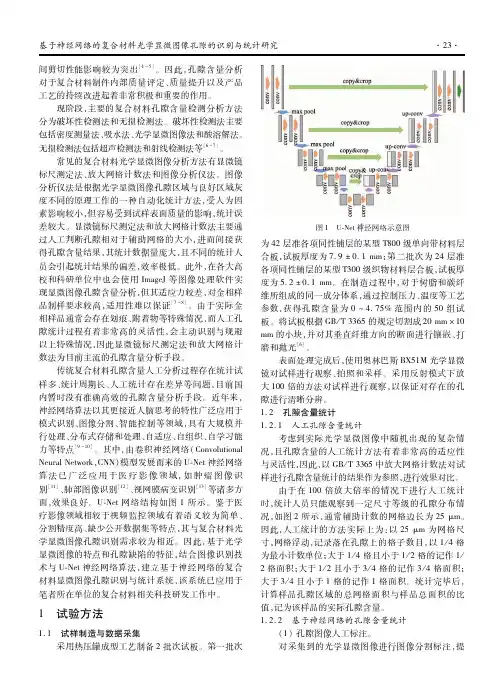
其中,由卷积神经网络(ConvolutionalNeuralNetwork,CNN)模型发展而来的U Net神经网络算法已广泛应用于医疗影像领域,如肿瘤图像识别[11]、肺部图像识别[12]、视网膜病变识别[13]等诸多方面,效果良好。
U Net网络结构如图1所示。
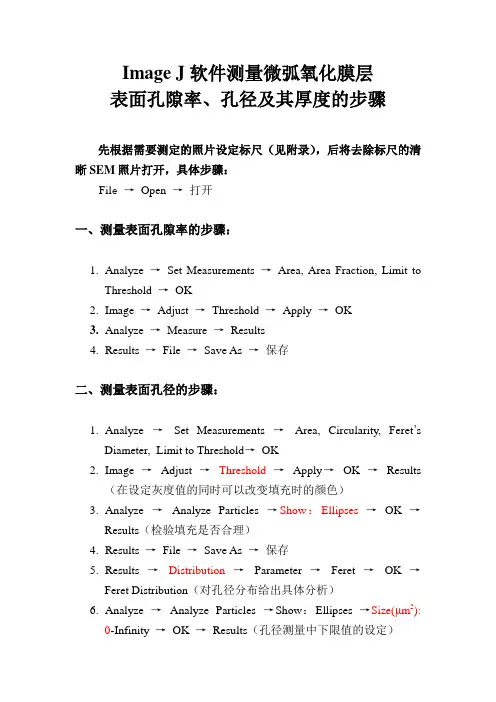
Image J软件测量微弧氧化膜层表面孔隙率、孔径及其厚度的步骤先根据需要测定的照片设定标尺(见附录),后将去除标尺的清晰SEM照片打开,具体步骤:Fil e →Open→打开一、测量表面孔隙率的步骤:1.Analyze→Set Measurements→Area, Area Fraction, Limit toThreshold→OK2.Image→Adjust→Threshold→Apply→OK3.Analyze→Measure→Results4.Results→File →Save As→保存二、测量表面孔径的步骤:1.Analyze→Set Measurements→Area, Circularity, Feret’sDiameter,Limit to Threshold→OK2.Image→Adjust→Threshold→Apply→OK→Results(在设定灰度值的同时可以改变填充时的颜色)3.Analyze→Analyze Particles→Show:Ellipses→OK →Results(检验填充是否合理)4.Results→File →Save As→保存5.Results →Distribution→Parameter →Feret →OK →Feret Distribution(对孔径分布给出具体分析)6.Analyze→Analyze Particles→Show:Ellipses →Size(μm2):0-Infinity →OK →Results(孔径测量中下限值的设定)三、测量膜层厚度的步骤:1. 将图片改为RGB Color格式Image →Type →RGB Color2. 用Pencil Tool在需要测量的膜层厚度处画出直线,直线的宽度可在Pencil Tool工具栏中的Pencil Width中调整,直线的颜色可在Color picker工具栏中选择。
imagej 孔隙算法原理## Pore Algorithm in ImageJ.### Image Processing for Pore Analysis.ImageJ is a widely used open-source image processing software that provides various tools for image analysis. ImageJ offers a set of algorithms specifically designed for pore analysis, which can be utilized to extractquantitative information from images of porous materials. These algorithms are based on image segmentation and shape analysis techniques.### Pore Segmentation.Segmentation is the process of dividing an image into meaningful regions. In the context of pore analysis, the goal of segmentation is to identify and separate individual pores from the image. This can be achieved using different approaches, including thresholding, edge detection, andwatershed algorithms.#### Thresholding.Thresholding is a simple and widely used method for image segmentation. It involves converting a grayscaleimage into a binary image by assigning pixels above acertain threshold value to one value (e.g., white) andpixels below the threshold to another value (e.g., black). The threshold value can be manually set or determined using automatic methods.#### Edge Detection.Edge detection algorithms identify boundaries between different regions in an image. In the case of pore analysis, edge detection can be used to detect the edges of pores.The resulting edges can then be used to segment the pores from the background.#### Watershed Algorithm.The watershed algorithm is a more sophisticated segmentation method that considers the image as a topographic surface. It assigns each pixel to the catchment basin of the nearest minimum, effectively separating the image into distinct regions. The watershed algorithm can be particularly useful for segmenting complex and interconnected pores.### Shape Analysis.Once pores have been segmented from the image, various shape analysis techniques can be applied to extract quantitative information. These techniques include measuring pore size, shape, and connectivity.#### Pore Size Measurements.Pore size is a critical parameter in characterizing porous materials. ImageJ provides several tools for measuring pore size, including the Feret diameter, equivalent diameter, and area. The Feret diameter is the maximum distance between two parallel tangents drawn on thepore boundary. The equivalent diameter is the diameter of a circle with the same area as the pore. The area of the pore is the number of pixels within the pore boundary.#### Pore Shape Analysis.The shape of pores can also be quantified using ImageJ. Shape descriptors such as aspect ratio, circularity, and convexity can be calculated to provide insights into the morphology of pores. The aspect ratio is the ratio of the major axis length to the minor axis length of the pore. Circularity is a measure of how closely the pore resembles a circle, with a value of 1 indicating a perfect circle. Convexity is a measure of the irregularity of the pore boundary, with a value of 1 indicating a convex shape.#### Pore Connectivity Analysis.Connectivity analysis is used to assess the degree of interconnection between pores. ImageJ can perform connectivity analysis using various algorithms, such as the box counting method and the Euler number calculation. Thebox counting method involves dividing the image into a grid of squares of different sizes and counting the number of squares that contain pores. The Euler number is a topological property that measures the number of connected components and holes in the image.### Conclusion.ImageJ provides a comprehensive set of algorithms for pore analysis that can be tailored to the specific needs of the application. These algorithms enable researchers and engineers to extract valuable quantitative information from images of porous materials, facilitating the characterization and understanding of these materials.### 孔隙算法在 ImageJ 中的原理 ## 中文回答:### 孔隙分析的图像处理。
imagej测量孔隙率步骤
ImageJ 可是个超棒的工具呀,用它来测量孔隙率也不难哦!首先呢,你得把要分析的图像导入到 ImageJ 里面去,就好像请它来家里做客一样。
然后呀,调整一下图像的对比度呀亮度啥的,让那些孔隙能更清
楚地显现出来,就像给它们打个聚光灯。
接下来呢,就要用到ImageJ 里的一些厉害功能啦!比如阈值功能,这就像是个神奇的筛子,能把你想要的部分筛出来。
通过调整阈值,
让孔隙部分和其他部分区分开,就好像把金子从沙子里挑出来一样。
然后呀,ImageJ 会帮你计算出孔隙的面积啦!这可真是太方便了,
就像有个小助手在帮你数数一样。
但这还没完哦,要得到孔隙率,还
得知道整个图像的面积呀。
这时候呀,就得动动脑筋啦!可以通过一些简单的测量或者已知的
信息来算出整个图像的面积。
然后把孔隙的面积除以整个图像的面积,嘿,孔隙率就出来啦!就像解开了一道谜题一样有成就感呢。
你说这是不是很有趣呀?就像在玩一个小游戏,一步步地找到答案。
而且呀,只要你多练习几次,就会越来越熟练,就跟骑自行车一样,
一开始可能摇摇晃晃,但后来就可以骑得飞快啦!
在这个过程中,可不要粗心大意哦,就像做饭不能放错调料一样。
每一步都要认真仔细,不然得出的结果可能就不准确啦。
要是因为粗
心而得到一个错的孔隙率,那可就太可惜啦,就好像努力了半天却发现走了弯路一样。
所以呀,一定要有耐心,慢慢摸索,相信你一定能掌握用 ImageJ 测量孔隙率的方法的!加油哦,你一定可以的!这不就是学习新东西的乐趣所在嘛,不断尝试,不断进步,最后收获满满的成就感。
怎么样,是不是已经迫不及待想去试试啦?。

沉积岩孔隙空间的三维可视化一、沉积岩孔隙空间的基本概念沉积岩是地球表面最常见的岩石类型之一,其形成过程涉及物质的沉积、压实和胶结。
沉积岩的孔隙空间是指岩石内部的空隙,这些空隙可以是原始沉积物间的空隙,也可以是后期地质作用形成的裂缝和孔洞。
孔隙空间的存在对沉积岩的物理性质、渗透性以及储集流体的能力有着重要影响。
沉积岩孔隙空间的形态多样,包括但不限于孔隙、裂缝、溶洞等。
这些形态的多样性使得沉积岩的孔隙空间具有复杂的三维结构。
了解这些结构对于评估岩石的储集能力、渗透性以及在油气勘探和水资源管理中的应用至关重要。
二、沉积岩孔隙空间的三维可视化技术三维可视化技术是一种将复杂的三维数据以直观的图形形式展现出来的技术。
在沉积岩孔隙空间的研究中,三维可视化技术可以帮助科学家和工程师更好地理解岩石内部的孔隙结构,从而为地质勘探和资源开发提供重要的信息支持。
2.1 孔隙空间数据的获取孔隙空间数据的获取通常依赖于地质勘探过程中的取样和测试。
通过钻井取样,可以获得岩石样本,进而通过显微镜观察、X射线断层扫描(CT)等技术获取孔隙空间的详细数据。
2.2 三维重建技术获取到的二维数据需要通过三维重建技术转化为三维模型。
常用的三维重建技术包括体素化、表面重建和网格化等。
体素化是将岩石样本转化为三维体素模型,每个体素代表岩石中的一个微小单元。
表面重建则是通过算法识别岩石表面的轮廓,构建出岩石的三维表面模型。
网格化则是将岩石表面或内部结构转化为由多边形组成的网格模型。
2.3 可视化软件和工具三维可视化需要借助专业的软件和工具来实现。
常见的三维可视化软件包括Maya、3ds Max、Blender等,这些软件提供了丰富的建模、渲染和动画制作功能。
此外,还有专门针对地质数据可视化的软件,如ParaView、GemPy等,它们能够处理大规模的地质数据,并提供高效的可视化解决方案。
2.4 可视化结果的应用三维可视化结果可以应用于多个领域。
Dragonfly应用-如何计算面孔隙率
哈尔滨工业大学丁浩
在利用Dragonfly在处理三维数据时,我们可能经常会需要计算孔洞的孔隙率或者某一相在材料中的含量,这个可以利用Dragonfly中分割好的ROI的属性中很容易得到ROI的体积,并且其后面会自动计算ROI在整个数据体中的占比,也就是我们所说的孔隙率(此处注意,如果数据体周围含有空气部分,则此占比是不能用来表示孔隙率的,可以将整个数据体分割成一个ROI,然后计算两个ROI的比值即可)。
在这里我们所要重点介绍的并不是整体孔隙率的计算,二是面孔隙率的计算。
首先是导入数据,然后选择一个合适的滤波器降噪处理,然后利用合适的方法进
行数据分割(segmentation,dragonfly中集成了适用于各种场景的不同的强大的数据分割功能),这里我们选择简单的阈值分割就可以把孔洞提取出来,如下图:
然后我们分析在YZ面上的面孔隙率,这里要用到dragonfly的slice analysis工具(关于slice analysis工具可看B站的相关教程,https:///video/BV1ZT4y1g7RX/),首先要对孔洞的ROI在YZ面上进行切面分析,得到Pore在YZ面上的每一切片的面积,可以导出为CSV文件备用。
接下来要求得面孔隙率还需要数据体在每个YZ面切片上的面积,我们可以将整个数据体作为一个ROI同样利用slice analysis工具求得每一切面的面积,然后同样也导出为CSV文件。
然后利用导出的CSV文件,分别将每一切面的pore面积/Dataset面积即为数据的每一切片的面孔隙率。