Forecasting
- 格式:doc
- 大小:699.00 KB
- 文档页数:20

pytorch-forecasting deepar 用法-概述说明以及解释1.引言1.1 概述时间序列预测是一种重要的数据分析技术,它在各种领域中都得到了广泛的应用,例如金融预测、销售预测、天气预测等。
随着深度学习的发展,越来越多的基于神经网络的模型被应用于时间序列预测问题中。
PyTorch是一个流行的深度学习框架,它提供了丰富的工具和库,用于构建和训练神经网络模型。
其中,pytorch-forecasting是基于PyTorch 开发的一个用于时间序列预测的库,它提供了多种强大的算法和模型,用于解决不同类型的时间序列预测问题。
在pytorch-forecasting库中,deepar算法是其中一个被广泛应用的模型。
deepar算法基于深度学习的思想,通过引入递归神经网络和自回归机制,可以对时间序列数据进行连续的预测,并且能够捕捉到数据中的隐藏模式和周期性。
本文将对pytorch-forecasting库和deepar算法进行详细介绍。
首先,我们将对pytorch-forecasting库进行简介,包括其特点、使用方法和相关工具。
然后,我们将深入探讨deepar算法的原理和关键概念。
接着,我们将介绍deepar算法在时间序列预测中的应用场景,并分析其优势和适用性。
最后,我们将具体讲解deepar算法的使用方法,包括数据准备、模型构建、训练和预测等步骤。
通过本文的学习,读者将能够了解pytorch-forecasting库和deepar 算法的基本原理和使用方法,并且掌握如何应用这些技术解决实际的时间序列预测问题。
此外,我们还将对pytorch-forecasting的deepar算法进行评价,并提出可能的改进方向,以期进一步提升其预测性能和应用范围。
1.2 文章结构本文将详细介绍pytorch-forecasting deepar 的用法和应用。
文章分为三大部分:引言、正文和结论。
在引言部分,我们将首先概述本文要探讨的主题,并介绍pytorch-forecasting deepar 的背景和意义。
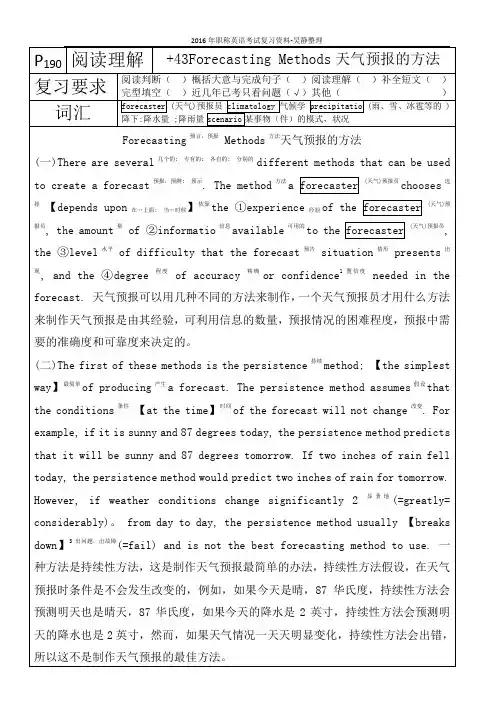
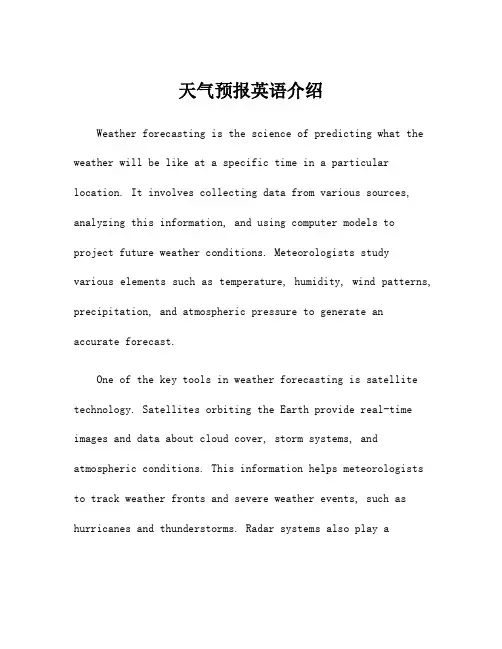
天气预报英语介绍Weather forecasting is the science of predicting what the weather will be like at a specific time in a particular location. It involves collecting data from various sources, analyzing this information, and using computer models to project future weather conditions. Meteorologists studyvarious elements such as temperature, humidity, wind patterns, precipitation, and atmospheric pressure to generate an accurate forecast.One of the key tools in weather forecasting is satellite technology. Satellites orbiting the Earth provide real-time images and data about cloud cover, storm systems, and atmospheric conditions. This information helps meteorologists to track weather fronts and severe weather events, such as hurricanes and thunderstorms. Radar systems also play acrucial role, enabling forecasters to observe precipitationin real-time and provide warnings for severe weather.Meteorological data is typically collected from a variety of sources, including weather stations, buoys in oceans, and aircraft. These observations are gathered in a centralized location and analyzed using sophisticated computer algorithms. Prediction models simulate weather behavior based on current conditions and historical data, allowing forecasters to make educated predictions about the weather.Weather forecasts are usually communicated throughvarious platforms, including television, radio, the internet, and mobile applications. They typically include information about temperature, chances of precipitation, wind speed, and potential severe weather conditions. Most forecasts covershort-term periods, such as daily or weekly forecasts, but some models can predict weather conditions several weeks in advance.One of the challenges in weather forecasting is the inherent unpredictability of the atmosphere. Weather systems are complex and can change rapidly, making precise long-term predictions difficult. Forecasters often use a range of forecasts to provide a more comprehensive view, emphasizing the possibility rather than certainty of certain conditions.Advancements in technology have significantly improved the accuracy of weather forecasts over the years. With the introduction of supercomputers and sophisticated modeling techniques, meteorologists can analyze vast amounts of data more efficiently, enhancing the reliability of predictions. Despite this progress, it is essential for the public to understand that forecasts are not infallible, and sudden changes in the weather can occur.Overall, weather forecasting is an essential service that impacts daily life, from agriculture to transportation, and even emergency management during natural disasters. As ourunderstanding of meteorology continues to evolve, so too will the methods and accuracy of weather forecasting, helping individuals and communities better prepare for the ever-changing weather.。

forecasting方法
Forecasting方法是指通过对过去的数据进行分析和预测,来预测未来的趋势和变化。
它是一种非常重要的方法,在商业、经济、科学等领域都得到广泛应用。
预测过程需要收集和分析大量的历史数据。
这些数据可以包括市场销售数据、经济指标、气象数据等。
通过对这些数据进行分析,我们可以找到数据的规律和趋势,以便预测未来的发展。
预测方法有很多种。
其中,最常见的方法是时间序列分析。
这种方法是通过对历史数据进行分析,找到数据的周期性变化和趋势,然后使用这些信息来预测未来的趋势。
此外,还有回归分析、机器学习等方法也常用于预测。
然后,预测的准确性取决于数据的质量和模型的选择。
如果历史数据不足或者数据质量差,那么预测的结果可能会出现误差。
此外,选择正确的预测模型也非常重要。
不同的模型适用于不同的场景,选择合适的模型可以提高预测的准确性。
预测的结果需要不断地进行验证和修正。
预测仅仅是一种预测,未来的变化可能会出现很多意外情况,使预测结果出现偏差。
因此,需要不断地对预测结果进行比对和分析,及时修正预测模型,提高预测准确性。
Forecasting方法是一种非常重要的分析方法,可以帮助我们预测未来的趋势和变化。
在实际应用中,需要注意数据的质量、模型的选择以及预测结果的验证和修正,以提高预测准确性。
供应链术语大全1、activity-based costing(ABC)基于活动的成本计算。
一种成本计算技术,把简介成本细分到每一个生产活动中,是简介成本和直接成本相互对应以更好的评估生成每一个产品的真实成本。
2、advance shipping notice(ASN)预先运送通知。
供应商向客户发出的,说明订单发运时间的文书。
ASNs 通常以电子方式传输。
3、advanced planning and scheduling system(APS)高级计划与排程系统。
一系列高级应用然间,运用数学模型和相关的技术为复杂的生产和供应问题找出优化解决方案。
4、aggregate forecast综合预测。
一种根据产品或客户资料的同类特性把他们归类而达成的综合预测方案5、Aggregation集合。
把相近的产品或顾客归类聚合,以简化计划的制定,并取得更稳定的预测结果的方法6、assemble-to-order strategy订单组装策略。
一种将产品部件在需求之前提前完成,把最后组装工作延迟到需求落实后才进行的库存策略7、available to promise(ATP)有效承诺。
产品库存状况的一种,指有足够的库存并能够马上发货的订单执行能力。
8、back scheduling逆向排程。
一种工作排程方法,从计划完成的日期开始,将需要执行的工作任务按由后向前逆推的顺序来进行工作计划安排。
9、Backhaul回程运输。
指车辆回程运载的货物,以充分地利用返程的货运能力。
10、bill of lading装货单。
发货文件,它列出了这批货物中所装在的具体产品,并且陈述了运输的条件。
11、bill of materials(BOM)材料清单。
一份列出组成产品所需要的零配件和原料的清单,并且按照产品的零件、组件和中间件的形成构成等级结构。
12、bill of operations(BOO)作业列表。
一个列表,列出完成一种产品生产所需要的作业步骤,并且按照各个步骤执行的顺序形成一个等级的结构图。
pytorch-forecasting timeseriesdataset格式-回复首先,让我们对PyTorch Forecasting的TimeSeriesDataset进行一些基本介绍。
TimeSeriesDataset是PyTorch Forecasting库中的一个重要概念,它是用于处理时间序列数据的数据集格式。
本文将逐步解释TimeSeriesDataset的定义、用法以及与其他数据集格式的比较,并讨论其在时间序列预测任务中的优势。
一、TimeSeriesDataset的定义TimeSeriesDataset是一个由PyTorch Forecasting库提供的数据集格式,用于处理时间序列数据。
它继承自PyTorch中的torch.nn.Module类,并提供了各种方法和函数来操作和处理时间序列数据。
TimeSeriesDataset的主要特点是可以轻松地对时间序列数据进行处理和转换。
它接受时间序列数据作为输入,并可以将其转换为可以输入到预测模型中的格式。
此外,TimeSeriesDataset还提供了分割数据集、获取特定时间窗口数据以及数据标准化等功能。
二、TimeSeriesDataset的用法要使用TimeSeriesDataset,首先需要导入PyTorch Forecasting库,并创建一个TimeSeriesDataset对象。
创建对象时,需要指定时间序列数据的输入特征、目标变量、时间索引和其他必要的参数。
例如,以下是创建一个TimeSeriesDataset对象的示例代码:pythonfrom pytorch_forecasting.data import TimeSeriesDataSet# 定义时间序列数据的输入特征、目标变量和时间索引input_features = ["feature1", "feature2", "feature3"]target = "target"time_idx = "date"# 创建TimeSeriesDataset对象dataset = TimeSeriesDataSet(data=df,time_idx=time_idx,target=target,group_ids=["group1", "group2"],...其他必要参数...)在上述示例中,我们首先定义了时间序列数据的输入特征、目标变量和时间索引。
经济学上的需求量名词解释在经济学中,需求量是一个重要概念,用于描述人们对特定商品或服务的购买意愿和能力。
在市场经济中,需求量是经济活动的重要指标之一,能够影响市场价格和供应量。
本文将解释一些与需求量相关的重要经济学名词,帮助读者更好地理解和应用这些概念。
1. 需求量(Demand)需求量指的是在特定时间和特定价格下,消费者愿意购买的某种商品或服务的数量。
需求量是受到人们对该商品的需求程度、价格、收入和其他影响因素的影响。
2. 需求曲线(Demand Curve)需求曲线是以价格为自变量、需求量为因变量的曲线。
需求曲线通常呈现负斜率,意味着价格上升时,需求量下降;价格下降时,需求量增加。
需求曲线的形态和斜率取决于具体商品的特性以及市场的竞争程度。
3. 需求弹性(Demand Elasticity)需求弹性是衡量需求量对价格变动的敏感程度的指标。
需求弹性可以分为价格弹性、收入弹性和交叉弹性。
价格弹性指的是需求量对价格变动的反应程度;收入弹性则指消费者收入变动对需求量的影响;交叉弹性是指其他相关商品价格变动对需求量的影响。
4. 需求预测(Demand Forecasting)需求预测是通过分析过去的需求数据和相关因素,对未来需求量进行估计和预测的过程。
需求预测对于企业的生产计划、市场营销决策和供应链管理至关重要。
准确的需求预测可以帮助企业合理规划产能和库存,降低经营风险。
5. 需求供给分析(Demand-Supply Analysis)需求供给分析是研究需求量和供应量之间的关系,从市场的角度分析价格和数量的决定因素。
需求供给分析包括对需求和供应曲线的测算和比较,以及通过需求与供应的交叉点来确定市场均衡价格和数量。
6. 需求管理(Demand Management)需求管理是通过谨慎的策略和有效的控制手段来管理和调整市场需求的过程。
需求管理的主要目标是稳定市场,增加销售额和市场份额,同时降低库存和运营成本。
ForecastingWhy forecast?Features Common to all Forecasts∙Conditions in the past will continue in the future∙Rarely perfect∙Forecasts for groups tend to be more accurate than forecasts for individuals ∙Forecast accuracy declines as time horizon increasesElements of a Good Forecast∙Timely∙Accurate∙Reliable (should work consistently)∙Forecast expressed in meaningful units∙Communicated in writing∙Simple to understand and useSteps in Forecasting Process∙Determine purpose of the forecast∙Establish a time horizon∙Select forecasting technique∙Gather and analyze the appropriate data∙Prepare the forecast∙Monitor the forecastTypes of Forecasts∙Qualitativeo Judgment and opiniono Sales forceo Consumer surveyso Delphi technique∙Quantitativeo Regression and Correlation (associative)o Time seriesForecasts Based on Time Series Data∙What is Time Series?∙Components (behavior) of Time Series datao Trendo Cycleo Seasonalo Irregularo Random variationsNaïve MethodsNaïve Forecast – uses a single previous value of a time series as the basis of a forecast.Techniques for Averaging∙What is the purpose of averaging?∙Common Averaging Techniqueso Moving Averageso Exponential smoothingMoving AverageExponential SmoothingTechniques for TrendLinear Trend Equationline the of slope at of value pe riod time for fore cast from pe riods time of numbe r spe cifie d =====b ty a ty t t where t t 0:Curvilinear Trend Equationline the of slope at of value pe riod time for fore cast from pe riods time of numbe r spe cifie d =====b ty a ty t t where t t 0:Techniques for Seasonality∙ What is seasonality?∙ What are seasonal relatives or indexes?∙ How seasonal indexes are used:o Deseasonalizing datao Seasonalizing data∙ How indexes are computed (see Example 7 on page 109)Accuracy and Control of ForecastsMeasures of Accuracyo Mean Absolute Deviation (MAD)o Mean Squared Error (MSE)o Mean Absolute Percentage Error (MAPE) Forecast Control Measureo Tracking SignalMean Absolute Deviation (MAD)Mean Squared Error (or Deviation) (MSE)Mean Square Percentage Error (MAPE)Tracking SignalProblems:2 – Plot, Linear, MA, exponential Smoothing5 – Applying a linear trend to forecast15 – Computing seasonal relatives17 – Using indexes to deseasonalize values26 – Using MAD, MSE to measure forecast accuracyProblem 2 (110)National Mixer Inc., sells can openers. Monthly sales for a seven-month period were as follows:(a) Plot the monthly data on a sheet of graph paper.(b) Forecast September sales volume using each of the following:(1) A linear trend equation(2) A five-month moving average(3) Exponential smoothing with a smoothing constant equal to 0.20, assuming March forecast of19(000)(4) The Naïve Approach(5) A weighted average using 0.60 for August, 0.30 for July, and 0.10 for June(c) Which method seems least appropriate? Why?(d) What does use of the term sales rather than demand presume?EXCEL SOLUTION(a) Plot of the monthly dataHow to superimpose a trend line on the graph∙Click on the graph created above (note that when you do this an item called CHART will appear on the Excel menu bar)∙Click on Chart > Add Trend Line∙Click on the most appropriate Trend Regression Type∙Click OK(b) Forecast September sales volume using:(1) Linear Trend Equation∙Create a column for time period (t) codes (see column B)∙Click Tools > Data Analysis > Regression∙Fill in the appropriate information in the boxes in the Regression box that appearsCoded time periodSales dataCoded time period(2) Five-month moving average(3) Exponential Smoothing with a smoothing constant of 0.20, assuming March forecast of 19(000)∙Enter the smoothing factor in D1∙Enter “19” in D5 as forecast for March∙Create the exponential smoothing formula in D6, then copy it onto D7 to D11(4) The Naïve Approach(5) A weighted average using 0.60 for August, 0.30 for July, and 0.10 for JuneProblem 5 (110)A cosmetics manufactur er’s marketing department has developed a linear trend equation that can be used to predict annual sales of its popular Hand & Foot Cream.y t =80 + 15 twhere: y t = Annual sales (000 bottles) t0 = 1990(a) Are the annual sales increasing or decreasing? By how much?(b) Predict annual sales for the year 2006 using the equationProblem 15 (113)Obtain estimates of daily relatives for the number of customers at a restaurant for the evening meal, given the following data. (Hint: Use a seven-day moving average)Excel Solution∙Type a 7-day average formula in E6 ( =average(C3:c9) )∙In F6, type the formula =C6/E6∙Copy the formulas in E6 and F6 onto cells E7 to E27∙Compute the average ratio for Day 1 (see formula in E12)∙Copy and paste the formula in E12 onto E13 to E18 to complete the indexes for Days 2 to 7Problem 17 (113) – Using indexes to deseasonalize valuesNew car sales for a dealer in Cook County, Illinois, for the past year are shown in the following table, along with monthly (seasonal) relatives, which are supplied to the dealer by the regional distributor.(a) Plot the data. Does there seem to be a trend?(b) Deseasonalize car sales(c) Plot the deseasonalized data on the same graph as the original data. Comment on the two graphs.Excel Solution(a) Plot of original data (seasonalized car sales)(b) Deseasonalized Car Sales(c) Graph of seasonalized car sales versus deseasonalized car salesProblem 26 (115) – Using MAD, MSE, and MAPE to measure forecast accuracyTwo different forecasting techniques (F1 and F2) were used to forecast demand for cases of bottled water. Actual demand and the two sets of forecasts are as follows:(a) Compute MAD for each set of forecasts. Given your results, which forecast appears to be the mostaccurate? Explain.(b) Compute MSE for each set of forecasts. Given your results, which forecast appears to be the mostaccurate? Explain.(c) In practice, either MAD or MSE would be employed to compute forecast errors. What factors might leadyou to choose one rather than the other?(d) Compute MAPE for each data set. Which forecast appears to be more accurate?Excel Solution。