深康佳B:2010年第一季度报告全文(英文版) 2010-04-30
- 格式:pdf
- 大小:64.00 KB
- 文档页数:12

政府主导投资是2009 年经济增长的主要驱动力,但最近房地产投资的拉动作用十分突出。
据估算,2009 年政府主导投资增长了42%(固定资产投资名义增长),而基于市场的投资仅增长了18%然而,2009 年底至2010 年初,政府主导投资的增长(年同比)已经大幅下滑(图3)。
房地产投资在2009 年初非常疲弱。
但部分由于充裕的流动性,房屋销售很快回升,在许多城市推高了房价,居民家庭消费增长保持平稳。
劳动力市场在经历了2009 年初的疲软之后已经得到改善。
直至2010 年初,就业和工资都保持了较好增长。
2009 年全年大部分时间居民消费价格都处于下降态势。
这由于进口强劲降低了贸易盈余,在2009 年外部贸易大大拉低了经济增速。
加工贸易进口的变化虽然人民币兑美元汇率没有变化,但人民币的有效汇率继续波动。
人民币在2008 年底开始重新钉住美元。
4 然而,中国对外贸易的很大一部分是与美国以外的国家发生的。
因此,随着美元对其他货币汇率的波动,按贸易加权的人民币币值变化与人民币对美元的汇率变化差别很大。
中国的名义有效汇率(NEER)在经历了2000 年到2005 年间的贬值之后,从2005 年7 月至2010 年3 月初这段时间升值了12.3%。
现在的NEER 大致处于2000 年的水平(图9)。
按消费者价格指数计算的实际有效汇率(REER)也是如此。
此外,由于自2008 年底人民币重新钉住美元,美元汇率的大幅波动也意味着中国对其大多数贸易伙伴的货币的汇率在上下变动。
房地产价格的激增触发了扩大供给、抑制投机的政策措施。
措施明确并二套房的首付比例不得低于40%;取消住房按揭贷款的优惠利率;将土地出让金首付比例从20-30%提高至50%;恢复征收房地产交易的营业税。
另一方面,有调查显示,房地产价格的迅速提高也增强了人们的通胀预期。
Surging property prices triggered policy measures to expand supply and curb speculation. These included clarifying and enforcing the policy on the minimum down payment ratio for second houses (to 40 percent); removing the “discount” on the mortgage interest rate; raising the minimum down然而,高收入国家2010-11 年的复苏可能将非常缓慢,全球进口需求仍将低迷。

Shenzhen Accord Pharmaceutical Co., Ltd.The First Quarterly Report 2010§1. Important Notes1.1 Board of Directors and the Supervisory Committee of Shenzhen Accord Pharmaceutical Co., Ltd. (hereinafter referred to as the Company) and its directors, supervisors and senior executives hereby confirm that there are no any fictitious statements, misleading statements, or important omissions carried in this report, and shall take all responsibilities, individual and/or joint, for the reality, accuracy and completion of the whole contents.1.2 The First Quarterly Financial Report of 2010 has not been audited by CPAs.1.3 Chairman of the Board Mr. Shi Jinming and General Manager Mr. Yan Zhigang, CFO Mr. Wei Pingxiao, and Manager of the Financial Department Mr. Chi Guoguang hereby confirm that the Financial Report of the First Quarterly Report is true and complete.§2. Company Profile2.1 Main accounting highlights and financial indexesUnit: RMBAt the end of the reportperiod At the period-end of thelast yearChanges ofincrease/decrease (%)Total assets (RMB) 5,515,055,976.75 5,233,489,407.09 5.38% Owners’ equity attributable toshareholders of the listed company(RMB)886,621,184.50 822,666,137.68 7.77% Share capital (Share) 288,149,400.00 288,149,400.00 0.00% Net asset per share attributable toshareholders of listed company(RMB/Share)3.077 2.855 7.78%In the report period The same period of lastyearChanges ofincrease/decrease (%)Total operating income (RMB) 2,987,103,337.49 2,353,169,370.41 26.94% Net profit attributable to shareholders ofthe listed company (RMB)63,955,046.83 44,443,276.60 43.90% Net cash flow arising from operatingactivities (RMB)-66,260,974.06 58,089,097.56 -214.07% Net cash flow arising from operatingactivities per share (RMB/Share)-0.230 0.202 -213.86% Basic earnings per share (RMB/Share) 0.222 0.154 44.16% Diluted earnings per share (RMB/Share) 0.222 0.154 44.16%Weighted average return on equity (%) 7.48% 6.52% Up 0.96 percentagepointsWeighted average return on equity afterdeducting non-recurring gains and losses (%) 7.20% 6.26%Up 0.94 percentagepointsItems of non-recurring gains and losses Amount from year-beginto the end of report period Gains and losses from the disposal of non-current assets -417,395.21 Governmental subsidy reckoned into current gains and losses, but closely relevant to theCompany’s business except for the governmental subsidy enjoyed in quota or rationaccording to the national general standards4,228,600.00 Other non-operating income and expenditure except for the above items 189,958.59 Influenced amount of minority shareholders’ equity -539,665.03 Influenced amount of income tax -1,025,880.80Total 2,435,617.55 Explanations on items of significant non-recurring gains and lossesNaught2.2 Total number of shareholders at the end of the report period and shares held by the top ten shareholders with unrestricted conditionsUnit: Share Total number of shareholdersat the end of report period13,126Particulars about the shares held by the top ten tradable shareholders with unrestricted conditionsFull name of shareholderAmount of tradable shares withunrestricted conditions held at theend of report periodType of sharesSINOPHARM GROUP CO., LTD. 110,459,748 RMB common share HTHK/CMG FSGUFP-CMG FIRSTSTATE CHINA GROWTH FD7,032,720 Domestically listed foreign share Agricultural Bank of China-GreatwallAnxin Return Mixed Fund7,000,000 RMB common share BANK OF CHINA-FRANKLINTEMPLETON SEALAND POTENTIALCOMBINA TION FUND5,991,764 RMB common shareCHINA INDUSTRIAL ANDCOMMERCIAL BANK-BOCCONTINUOUS GROWTH FUND5,434,455 RMB common shareCHINA INDUSTRIAL ANDCOMMERCIAL BANK-GUANGFAJUFENG STOCK FUND5,270,015 RMB common shareCHINA INDUSTRIAL ANDCOMMERCIAL BANK-BOSHISELECTIVE STOCK FUND4,963,365 RMB common shareAgricultural Bank of China-FranklinTEMPLETON SEALAND Flex Cap Fund4,949,136 RMB common share BANK OF CHINA-Harvest SteadyOpen-end Stock Fund4,019,814 RMB common share BANK OF COMMUNICATIONS-HUAAN TACTICAL SELECT STOCKFUND4,002,783 RMB common share§3. Significant Events3.1 Particulars about material changes in items of main accounting statement and financial index, and explanations of reasons√Applicable □Inapplicable1. Accounts paid in advance at the end of the period increased RMB 28.11 million compared with that at the beginning of the period, mainly due to: (1) Prepaid accounts for project equipment of Suzhou Zhijun Wanqing Pharmaceutical Co., Ltd.—subsidiary of the Company increased compared with that at the beginning of the period. (2) Sales scope of Sinopharm Medicine Holding Guangzhou Co., Ltd. –subsidiary of the Company was expanded and prepaid accounts for goods increased.2. Accounts received in advance at the period-end decreased RMB 38.05 million compared with that at the period-begin, mainly because Zhijun Wanqing Pharmaceutical maintained good sales trend in 2009 and partially adopted policy of “supplying goods upon receipt of prepayment” which resulted in the comparatively large amount of accounts received in advance at the end of 2009.3. Interest payable at the period-end decreased RMB 0.29 million compared with that at the period-begin, mainly due to that the Company had paid back part loan interest in this period.4. Current Liabilities due within 1 year decreased RMB 11 million at the period-end compared with that of the period-begin, mainly due to that the Company’s subsidiary-- Zhijun Wanqing Pharmaceutical paid back long-term loan of RMB 11 million due within 1 year to Anlian Branch of China Merchants Bank during this period.5. Management expense of this period increased RMB 22.09 million compared with that of the same period of last year, mainly due to: (1) The Company’s subsidiary -- Zhijun Wanqing Pharmaceutical increased input in research and development for enhancing competitive power of the enterprise; (2) Effects of purchase of Zhijun Wanqing Pharmaceutical (gains and losses of Zhijun Wanqing Pharmaceutical were not included in the same period of last year)6. Financial expense of this period increased RMB 6.98 million compared with that of the same period of last year, mainly due to: (1)The Company no longer enjoyed preferential interest rate, as the country adopted tight monetary policies. (2) Bank loans and bill discounts were increased in favor of business development7. Losses from depreciation of assets increased by RMB 0.34 million in the report period compared with that of same period of last year, mainly due to the effect of purchase of Zhijun Wanqing (gains and losses of Zhijun Wanqing Pharmaceutical were not included in the same period of last year) and withdrawal of provision for depreciation of inventories by Zhinjun Wanqing in this period.8. Non-operating income of this period increased RMB 3.45 million compared with that of the same period of last year, mainly due to the effect of purchasing Zhijun Wanqing (its gains and losses were not included in the same period of last year) and Zhijun Wanqing received government subsidiaries as Adjustment on Key Enterprises and Speical Guiding Fund for Rejuvenation with Provincial Level amounting to RMB 3.28 million in this period.9. Non-operating expenditures increased RMB 0.51 million compared with that of the same period of last year, mainly due to that loss from the disposal of non-current assets of the Company and its subsidiaries increased compared to that of the same period of last year.10. Cash flow caused by taxes and fees paid in this period increased RMB 27.28 million compared with that of the same period of last year, mainly due to: (1) Operating income was 26.94% up over the same period of last year and taxes and fees also increased; (2) Effect of purchasing Zhijun Wanqing (cash flow of Zhijun Wanqing was not included in the last same period)11. Net amount of cash flow arising from operating activities of this period decreased by RMB 124.35 million compared with the last same period, mainly due to: (1) Affected by the macro economic climate, recovery of sales accounts was getting slower. (2) Along with the expansion of sales scale, accounts paid for purchases increased.12. Net cash arising from disposal of fixed assets, intangible assets and other long-term assets of this period increased RMB 4.87 million compared to the same period of last year. The main reason was: Subsidiary Zhijun Pharmaceuticals dealt with couples of property located in Bagualing, Buji, etc. 13. Cash paid for constructing fixed assets, intangible assets and other long-term assets of this period increased RMB 35.66 million compared to the same period of last year. The main reason was: (1) Subsidiary Zhijun Wanqing increased cash payment for newly increased fixed assets for cephalosporin sterile APIs workshop and project of extension and reform of public works as well as Peinan project; (2) Subsidiary Sinopharm Nanning and Huiqing Investment increased cash payment for purchasing land-use right to invest and construct State Pharmaceutical Nanning Logistics Center project.14. Cash arising from investment payment of this period decreased RMB 8.5 million compared to the same period of last year. The main reason was: (1) In the same period of last year Sinopharm Nanning paid RMB 7.15 million for investment in China Pharmaceutical Group Corporation taking over Huiqing Investment; (2) In the same period of last year the Company including previous subsidiary Shenzhen Chain paid cash RMB 1.35 million for acquiring stores.15. Net cash obtained from payment of subsidiaries and other units of this period decreased RMB 48.53 million compared to the same period of last year. The main reason was: cash was paid in this period for taking over equity due balance of Dongguan Dongfeng and Zhijun Wanqing, in the same period of last year for taking over equity of Zhijun Wanqing, while the different paying ratio led to discrepancy.16. Cash paid for other related investment activities of this period increased RMB 6.95 million compared to the same time of last year. The main reason was: the cash caused by business of subsidiary Sinopharm Nanning taking over Nanning Traditional Chinese Medicine Co., Ltd.17. Cash received from loans of this period increased RMB 520 million compared to the same period of last year. This was mainly due to increase bank loan for support for business development.18. Other cash received related with financing activities decreased RMB 125.15 million of this period compared to the same time of last year. The main reason was: In the same period of last year subsidiary Sinopharm Guangzhou lent loan of RMB 110 million from Sinopharm Group Co., Ltd. 19. Cash for paying for debt of this period increased RMB 487.21 million compared to the same period of last year. This was mainly due to return some due short-term borrowings.20. Cash paid for distributing dividend and profit or payment of interest of this period increased RMB 4.19 million compared to the same period of last year. This was mainly due to the increased bank loan lead to payment for bank interest.21. Other cash paid for related financing activities of this period decreased RMB 17.3 million compared to the same period of last year. The main reason was: in the same period of last year subsidiary Sinopharm Guangzhou paid RMB 20 million for loan from Sinopharm Group Co., Ltd. 3.2 Analysis and explanation of significant events and their influence and solutions□Applicable √Inapplicable3.3 Implementations of commitments by the Company, shareholders and actual controller□Applicable √Inapplicable3.4 Estimation of accumulative net profit from the beginning of the year to the end of next report period to be loss probably or the warning of its material change compared with the corresponding period of the last year and explanation of reason□Applicable √Inapplicable3.5 Other significant events which need explanations3.5.1 Particulars about securities investment□Applicable √Inapplicable3.5.2 Registration form for receiving research, communication and interview in the report periodIn the report period, there were no receptions from the investors such as spot research, telephone communications and written enquiries.3.5.3 Particulars about the explanations on other significant events√Applicable □InapplicableThe Company purchased enterprises Sinopharm Nanning and Huiqing Investment under the common control respectively in June and Dec. of 2009, in accordance with relevant regulations in Accounting Standards for Business Enterprise No.—Enterprise Merger, adjustments were made on comparative statements as of March 2009, and consolidated Sinopharm Nanning, Huiqing Investment and its subsidiary Guangxi Guoda.3.6 Particulars about derivatives investment□Applicable √Inapplicable3.6.1 Particulars about derivatives investment held at the end of report period□Applicable √Inapplicable§4. Appendix4.1 Balance sheetPrepared by Shenzhen Accord Pharmaceutical Co., Ltd. March 31, 2010 Unit: RMBBalance at period-end Balance at year-begin Items Consolidation Parent Company Consolidation Parent Company Current assets:Monetary funds 570,136,945.51 91,765,211.81 579,471,913.48 125,541,203.80 Settlement provisionsCapital lentTransaction finance assetNotes receivable 337,082,890.06 3,793,035.60 359,419,752.39 1,758,275.85 Accounts receivable 2,555,308,729.54 294,770,200.52 2,438,526,944.67 301,349,886.88 Accounts paid in advance 113,760,088.38 2,595,491.11 85,646,539.08 1,042,226.64 Insurance receivableReinsurance receivablesContract reserve ofreinsurance receivableInterest receivableDividend receivable 8,271,829.94 8,271,829.94Other receivables 56,641,066.62 380,827,526.75 48,175,405.78 379,622,614.20 Purchase restituted financeassetInventories 1,052,990,974.19 105,088,764.48 903,934,387.58 96,332,120.70Non-current asset due withinone yearOther current assetsTotal current assets 4,694,192,524.24 878,840,230.27 4,423,446,772.92 905,646,328.07 Non-current assets:Granted loans and advancesFinance asset available forsalesHeld-to-maturity investmentLong-term accountreceivableLong-term equity investment 83,942,570.51 1,184,601,080.52 80,399,471.97 642,597,981.98 Investment property 72,062,240.38 7,351,775.77 57,973,532.97 7,572,670.36 Fixed assets 409,900,322.83 27,506,060.17 418,780,207.51 28,578,457.35 Construction in progress 56,792,275.17 253,886.24 46,146,183.50 253,886.24 Engineering materialDisposal of fixed assetProductive biological assetOil and gas assetIntangible assets 107,108,970.21 29,423,843.43 116,232,435.65 29,653,420.36Expense on Research and235,375.01 235,375.01DevelopmentGoodwill 34,153,027.89 34,153,027.89Long-term expenses to be6,141,242.07 89,098.79 6,717,663.30 184,277.86 apportionedDeferred income tax asset 10,668,827.81 12,871,196.24Other non-current asset 39,858,600.63 36,533,540.13Total non-current asset 820,863,452.51 1,249,225,744.92 810,042,634.17 708,840,694.15 Total assets 5,515,055,976.75 2,128,065,975.19 5,233,489,407.09 1,614,487,022.22 Current liabilities:Short-term loans 1,121,331,574.17 474,740,445.88 944,189,604.46 347,023,220.37 Loan from central bankAbsorbing deposit andinterbank depositCapital borrowedTransaction financialliabilitiesNotes payable 963,090,650.87 140,197,443.99 1,104,950,330.28 167,985,468.09 Accounts payable 1,950,677,675.22 285,220,480.47 1,701,543,860.48 246,909,317.09Accounts received in43,815,385.25 59,980.25 81,860,595.37 7,015,577.03 advanceSelling financial asset ofrepurchaseCommission charge andcommission payableWage payable 79,235,527.55 21,638,559.01 107,396,041.96 21,952,780.15Taxes payable 34,723,062.24 -395,281.46 36,327,948.81 122,667.32 Interest payable 303,075.00 589,050.00 361,845.00 Dividend payableOther accounts payable 255,520,587.80 650,152,615.76 244,895,882.94 263,570,295.56 Reinsurance payablesInsurance contract reserveSecurity trading of agencySecurity sales of agencyNon-current liabilities due19,000,000.00 30,000,000.00within 1 yearOther current liabilitiesTotal current liabilities 4,467,697,538.10 1,571,614,243.90 4,251,753,314.30 1,054,941,170.61 Non-current liabilities:Long-term loans 30,000,000.00 30,000,000.00Bonds payableLong-term account payable 44,709.00 46,019.40Special accounts payable 2,555,000.00 1,320,000.00 2,555,000.00 1,320,000.00 Projected liabilitiesDeferred income tax liabilities 24,818,868.54 3,773,319.00 25,525,421.76 3,773,319.00 Other non-current liabilities 45,467,170.91 45,478,550.21Total non-current liabilities 102,885,748.45 5,093,319.00 103,604,991.37 5,093,319.00 Total liabilities 4,570,583,286.55 1,576,707,562.90 4,355,358,305.67 1,060,034,489.61Owner’s equity (or shareholders’equity):Paid-in capital (or share288,149,400.00 288,149,400.00 288,149,400.00 288,149,400.00 capital)Capital public reserve 5,030,338.57 13,828,726.93 5,030,338.57 13,828,726.93 Less: Inventory sharesReasonable reserveSurplus public reserve 17,573,057.11 17,573,057.11 17,573,057.11 17,573,057.11 Provision of general riskRetained profit 575,868,388.82 231,807,228.25 511,913,342.00 234,901,348.57Balance difference offoreign currency translationTotal owner’s equity attributable886,621,184.50 551,358,412.29 822,666,137.68 554,452,532.61 to parent companyMinority interests 57,851,505.70 55,464,963.74Total owner’s equity 944,472,690.20 551,358,412.29 878,131,101.42 554,452,532.61Total liabilities and owner’s5,515,055,976.75 2,128,065,975.19 5,233,489,407.09 1,614,487,022.22 equity4.2 Profit statementPrepared by Shenzhen Accord Pharmaceutical Co., Ltd. Jan.-Mar. 2010 Unit: RMBAmount in this period Amount in last period ItemsConsolidation Parent Company Consolidation Parent CompanyI. Total operating income 2,987,103,337.49 408,871,235.83 2,353,169,370.41 345,724,949.43 Including: Operating income 2,987,103,337.49 408,871,235.83 2,353,169,370.41 345,724,949.43 Interest incomeInsurance gainedCommission charge andcommission incomeII. Total operating cost 2,909,388,787.57 416,407,513.69 2,294,935,167.32 342,943,174.87 Including: Operating cost 2,724,331,708.62 391,002,358.55 2,156,195,372.60 329,553,793.05 Interest expenseCommission charge andcommission expenseCash surrender valueNet amount of expense ofcompensationNet amount of withdrawalof insurance contract reserveBonus expense ofguarantee slipReinsurance expenseOperating tax and extras 3,687,151.15 250,316.92 3,138,204.59 56,246.11 Sales expenses 95,887,166.60 11,168,239.45 79,531,560.90 8,133,355.06 Administration expenses 68,682,675.80 11,867,945.03 46,590,342.23 5,317,889.39 Financial expenses 15,840,723.81 2,442,906.26 8,856,578.85 -118,108.74 Losses of devaluation of959,361.59 -324,252.52 623,108.15 0.00 assetAdd: Changing income offair value(Loss is listed with“-”)Investment income (Loss3,543,098.54 3,543,098.54 2,814,268.09 -526,193.43 is listed with “-”)Including: Investmentincome on affiliated company3,543,098.54 3,543,098.54 2,814,268.09 -526,193.43 and joint ventureExchange income (Loss islisted with “-”)III. Operating profit (Loss is81,257,648.46 -3,993,179.32 61,048,471.18 2,255,581.13 listed with “-”)Add: Non-operating4,582,543.87 899,059.00 1,136,041.41 10,435.14 incomeLess: Non-operating581,380.49 0.00 74,624.98 10,128.50 expenseIncluding: Disposal loss440,672.27 53,563.15of non-current assetIV. Total Profit (Loss is listed85,258,811.84 -3,094,120.32 62,109,887.61 2,255,887.77 with “-”)Less: Income tax 18,917,223.05 17,101,878.32V. Net profit (Net loss is listed66,341,588.79 -3,094,120.32 45,008,009.29 2,255,887.77 with “-”)Net profit attributable toowner’s equity of parent63,955,046.83 -3,094,120.32 44,443,276.60 2,255,887.77 companyMinority shareholders’2,386,541.96 564,732.69gains and lossesVI. Earnings per sharei. Basic earnings per share 0.222 0.154ii. Diluted earnings per share 0.222 0.154VII. Other consolidatedincomeVIII. Total consolidated66,341,588.79 -3,094,120.32 45,008,009.29 2,255,887.77 incomeTotal consolidated income63,955,046.83 -3,094,120.32 44,443,276.60 2,255,887.77 attributable to owners of parentcompanyTotal consolidated income2,386,541.96 564,732.69attributable to minorityshareholders4.3 Cash flow statementPrepared by Shenzhen Accord Pharmaceutical Co., Ltd. Jan.-Mar. 2010 Unit: RMBAmount in this period Amount in last period ItemsConsolidation Parent Company Consolidation Parent Company I. Cash flows arising fromoperating activities:Cash received from selling2,902,718,540.33 455,535,793.15 2,456,452,407.87 369,845,596.20 commodities and providing laborservicesNet increase of customerdeposit and interbank depositNet increase of loan fromcentral bankNet increase of capitalborrowed from other financialinstitutionCash received from originalinsurance contract feeNet cash received fromreinsurance businessNet increase of insuredsavings and investmentNet increase of disposal oftransaction financial assetCash received from interest,commission charge andcommissionNet increase of capitalborrowedNet increase of returnedbusiness capitalWrite-back of tax received 169,199.66 235,618.93Other cash received27,383,467.22 6,865,163.40 23,497,289.21 3,126,083.53 concerning operating activitiesSubtotal of cash inflow2,930,271,207.21 462,400,956.55 2,480,185,316.01 372,971,679.73 arising from operating activitiesCash paid for purchasing2,722,925,193.15 330,433,992.99 2,178,403,125.04 383,325,287.72 commodities and receiving laborserviceNet increase of customerloans and advancesNet increase of deposits incentral bank and interbankCash paid for originalinsurance contract compensationCash paid for interest,commission charge andcommissionCash paid for bonus ofguarantee slipCash paid to/for staff and115,364,339.98 10,658,254.65 105,892,677.94 11,276,944.49 workersTaxes paid 69,566,717.99 6,835,190.63 42,285,175.83 2,446,849.23Other cash paid concerning88,675,930.15 21,267,062.67 95,515,239.64 11,024,791.65 operating activitiesSubtotal of cash outflow2,996,532,181.27 369,194,500.94 2,422,096,218.45 408,073,873.09 arising from operating activitiesNet cash flows arising from-66,260,974.06 93,206,455.61 58,089,097.56 -35,102,193.36 operating activitiesII. Cash flows arising frominvesting activities:Cash received fromrecovering investmentCash received frominvestment incomeNet cash received fromdisposal of fixed, intangible and5,003,300.00 0.00 130,191.00 73,000.00 other long-term assetsNet cash received fromdisposal of subsidiaries and otherunitsOther cash receivedconcerning investing activitiesSubtotal of cash inflow from5,003,300.00 0.00 130,191.00 73,000.00 investing activitiesCash paid for purchasing50,461,906.34 163,527.65 14,805,518.93 459,895.00 fixed, intangible and otherlong-term assetsCash paid for investment 583,460,000.00 8,496,000.00Net increase of mortgagedloansNet cash received from11,337,750.63 11,337,750.63 59,867,260.42 125,819,400.00 subsidiaries and other unitsOther cash paid concerning7,149,060.00 200,000.00investing activitiesSubtotal of cash outflow68,948,716.97 594,961,278.28 83,368,779.35 126,279,295.00 from investing activitiesNet cash flows arising from-63,945,416.97 -594,961,278.28 -83,238,588.35 -126,206,295.00 investing activitiesIII. Cash flows arising fromfinancing activitiesShenzhen Accord Pharmaceutical Co., Ltd. The First Quarterly Report 201011Cash received from absorbing investmentIncluding: Cash received from absorbing minority shareholders’ investment by subsidiariesCash received from loans 706,500,000.00540,000,000.00186,500,000.00100,000,000.00Cash received from issuing bondsOther cash received concerning financing activities0.00796,836,467.10 125,146,000.00 310,637,849.66 Subtotal of cash inflow from financing activities706,500,000.00 1,336,836,467.10 311,646,000.00 410,637,849.66 Cash paid for settling debts 561,921,239.21 524,421,239.21 74,712,078.69 20,000,000.00 Cash paid for dividend and profit distributing or interest paying11,944,780.805,696,397.217,755,681.43641,686.75Including: Dividend and profit of minority shareholder paid by subsidiariesOther cash paid concerning financing activities11,762,551.78 338,740,000.00 29,065,294.42 155,020,447.32 Subtotal of cash outflow from financing activities585,628,571.79 868,857,636.42 111,533,054.54 175,662,134.07 Net cash flows arising from financing activities120,871,428.21467,978,830.68200,112,945.46234,975,715.59IV . Influence on cash and cash equivalents due to fluctuation in exchange rate-5.15V . Net increase of cash and cash equivalents-9,334,967.97 -33,775,991.99 174,963,454.67 73,667,227.23 Add: Balance of cash and cash equivalents at the period -begin579,471,913.48 125,541,203.80 382,225,775.14 62,369,583.65 VI. Balance of cash and cash equivalents at the period -end570,136,945.5191,765,211.81557,189,229.81136,036,810.884.4 Auditor’ reportAuditor’s opinions: Un-audited。
康佳集团股份有限公司2010年度报告文献综述js0843316 08财务管理3班刘洋摘要:通过对企业的基本情况,外币业务,租赁,所得税及企业合并的文献综述的概括,让我们了解和懂得了企业的年度报告的样式,也让我们了解和知道了康佳集团2010年度报告的相关情况。
【关键词】:文献综述,企业基本情况,外币,租赁,所得税,企业合并引言:康佳集团成立于1980年5月21日,前身是“广东光明华侨电子工业公司”,是中国改革开放后诞生的第一家中外合资电子企业,初始投资4300万港元。
1991年,康佳集团改组为中外公众股份制公司。
1992年,康佳A、B股股票同时在深圳证券交易所上市,现有总资产近百亿元、净资产近四十亿元、总股本12.04亿股,华侨城集团为第一大股东。
通过观察和阅读这家公司2010年度的财务报告,我们可以了解和知道这家企业的很多信息,比如说,企业的基本情况,外币业务的情况,租赁业务,所得税及企业合并有关情况,这让我们更好的理解的书本上与其相关的知识,更加加强和巩固我们知识结构体系。
这对我们以后的学习有着更加深远的意义。
一企业基本情况(一).中文名全称:康佳集团股份有限公司英文名:KONKA GROUP CO.,LTD(二).公司注册地址:广东省深圳市南山区华侨城(三).注册资本:120397.27万元(四).公司股票上市交易所:深圳证券交易所股票简称:深康佳A股票代码:000016(五).业务范围:康佳集团主要从事彩色电视机、手机、白色家电、生活电器、LED、机顶盒及相关产品的研发、制造和销售,兼及精密模具、注塑件、高频头、印制板、变压器及手机电池等配套业务(六).员工总数:18468人二外币应收账款折算业务项目期末数期初数原币金额折算率人民币金额原币金额折算率人民币金额港币914,592.71 0.8509 78,226.9414,592.71 0.8805805,298.88美元2,048,936.67 6.622713,569,492.882,048,936.676.828213,990,549.37澳大利亚元49,764.00 6.7139 34,110.52,764.00 6.1438305,740.06三租赁最终可能转移,也可能不转移。
Interim Report j a n u a r y – M a r c h 20101 UPDATED NFORMAT ON 5 VOLKSWAGEN SHARES 6 MANAGEMENT REPORT 16 BRAN DS AN DBUSI N ESS FI ELDS 20 I NTERIM FI NANCIALSTATEMENTS (CON DENSED)1 Key F acts2 Key Events6 Business Development12 Net Assets, Financial Positionand Results of Operations15 Outlook20IncomeStatement21 Statement of ComprehensiveIncome22 Balance Sheet23 Statement of Changes inEquity24 Cash low Statement25 Notes to the FinancialStatementsVOLKSWAGEN GROU PQ12010 2009 % Volume Data1Deliveries to customers ('000 units) 1,744 1,402 + 24.4 of which: in Germany 255 252 + 1.3 abroad 1,489 1,150 + 29.5 Vehicle sales ('000 units) 1,703 1,352 + 25.9 of which: in Germany 255 275 –7.2 abroad 1,447 1,077 + 34.4 Production ('000 units) 1,734 1,253 + 38.4 of which: in Germany 565 411 + 37.4 abroad 1,169 841 + 38.9 Employees ('000 on March 31, 2010/Dec. 31, 2009) 371.3 368.5 + 0.8 of which: in Germany 172.9 172.6 + 0.2 abroad 198.4 195.9 + 1.3Q12010 2009 % Financial Data (IFRSs), € millionSales revenue 28,647 23,999 + 19.4 Operating profit 848 312 x as a percentage of sales revenue 3.0 1.3Profit before tax 703 52 x as a percentage of sales revenue 2.5 0.2Profit after tax 473 243 + 94.6 Profit attributable to shareholders of Volkswagen AG 423 263 + 60.7 Cash flows from operating activities23,148 3,271 –3.8 Cash flows from investing activities23,022 319 x Automotive Division3EBITDA42,396 1,689 + 41.9 Cash flows from operating activities23,043 2,857 + 6.5 Cash flows from investing activities2, 53,013 304 x of which: investments in property, plant and equipment2903 1,154 –21.8 as a percentage of sales revenue 3.5 5.5capitalized development costs6421 459 –8.3as a percentage of sales revenue 1.7 2.2 Net cash flow 31 2,553 –98.8 Net liquidity at March 31 14,235 10,737 + 32.61 Volume data including the vehicle production investments Shanghai-Volkswagen Automotive Company Ltd. and FAW-Volkswagen Automotive CompanyLtd. These companies are accounted for using the equity method. All figures shown are rounded, so minor discrepancies may arise from addition of these amounts. 2009 deliveries updated on the basis of statistical extrapolations.2 2009 adjusted.3 Including allocation of consolidation adjustments between the Automotive and Financial Services divisions.4 Operating profit plus net depreciation/amortization and impairment losses/reversals of impairment losses on property, plant and equipment, capitalizeddevelopment costs, leasing and rental assets, goodwill and financial assets as reported in the cash flow statement; Q2 2009: €2,451 million,Q3 2009: €1,818 million, Q4 2009: €2,047 million.5 Excluding acquisition and disposal of equity investments: Q1 €1,250 million (€1,612 million).6 See table on page 27.Key Figures1Key Facts>Volkswagen Group makes positive start to fiscal year 2010>At €848 million, operating profit up on the weak prior-year figure (€312 million)>Profit before tax increases to €703 million (€52 million)>Group sales revenue 19.4% higher than in the prior-year period at €28.6 billion>Cash flows from operating activities amount to €3.0 billion (€2.9 billion); ratio of investments in property, plant and equipment (capex) to sales revenue at 3.5% (5.5%)>Outflow of €1.7 billion cash for the investment in Suzuki>Successful capital increase generates cash inflow of approximately €4.1 billion,including around €3.0 billion in the reporting period; all preferred shares placed inadvance>Automotive Division net liquidity at high level of €14.2 billion>Group launches new model rollout for 2010:- At 1.7 million vehicles, Group deliveries to customers 24.4% higher than in the weakprevious year; global market share increases to 11.6%- Continued strong demand for Group models in China; prior-year figures alsoexceeded in Western Europe, North and South America- New Compact Coupe concept car unveiled to the global public- Volkswagen Passenger Cars brand celebrates world premieres of the new Sharan andthe new Touareg, which is also available in a hybrid version- Audi A1 is the first premium vehicle in the small compact car segment- Audi A1 e-tron demonstrates the Group’s expertise in e-mobility- Škoda presents the Fabia Scout- SEAT unveils the Ibiza ST and the concept car for the IBE electric model- Volkswagen Commercial Vehicles launches the Amarok pickup2VOLKSWAGEN GROU P LAUNCHES 2010WITH NEW MODEL ROLLOUTThe Volkswagen Group brands kicked off the 2010 model year with a large number of attractive new models and fascinating concept cars. The first of these were unveiled at the motor shows in Detroit and Geneva.North American International Auto Show in DetroitAt the North American International Auto Show in Detroit, Volkswagen Passenger Cars presented the New Compact Coupe (NCC) – a concept car for a completely new compact coupé with a hybrid drive and a sporty, elegant design – to the global public for the first time. The combination of a 110 kW (150 PS) TSI engine and an electric motor with an output of 20 kW (27 PS), in conjunction with the innovative 7-gear double-clutch gearbox (DSG), gives this vehicle a top speed of 227 kph and an acceleration of 8.6 secondsto 100 kph. The NCC has an average fuel consumption of only 4.2 l per 100 km.With its e-tron Detroit show car, Audi unveiled its concept for an uncompromisingly purist compact sports car powered purely by electricity. This coupé, manufactured using Audi’s prizewinning aluminum space frame light-weight construction technology, has two electric motors with a total output of 150 kW (204 PS). These enable a range of up to 250 km and a top speed (electronically limited) of 200 kph. The next generation of the Audi A8 also celebrated its motor show debut. Fascinating sportiness, innovative technology and superior comfort are the hallmarks of the Audi brand’s new flagship.International Motor Show in GenevaThe Volkswagen Group’s brands presented many attractive new models at the International Motor Show in Geneva.The world premiere of the new Sharan was the high-light for the Volkswagen Passenger Cars brand. This totally revamped model was improved in all areas and is now equipped with rear sliding doors for the first time. Its extremely variable seating concept, high-end quality, uncom-promising safety and clever details are the highlights of this MPV, which is geared primarily towards families and high-mileage business drivers who need additional space. The new Touareg, which had celebrated its global debut just a few days previously in Munich, also generated attention. The completely redesigned premium SUV now offers even higher quality, both outside and inside. The new Touareg will also be available in a hybrid version1– the only SUV so far in Europe. The new editions of the CrossGolf and CrossPolo, as well as the Polo GTI², were also presented to the global public for the first time. The CrossGolf is the sixth separate model in the series and combines the versatility of an MPV with the robustness of an SUV. With its own distinct equipment features, raised suspension and outstanding suitability for daily use, the CrossPolo is one of the most unconventional vehicles in its class. The special features of the Polo GTI are its superb handling characteristics, uncompromising drivetrain agility and maximum possible safety.The debut of the Audi A1 was the highlight of the show for the Audi brand. The A1 is the first premium automobile in the small compact car segment and appeals to entirely new customer groups for the brand. The smallest member of the Audi family features a distinct design with striking LED headlights and a sporty, flowing roof arch, individuality and the highest possible quality. The debut of the new Audi RS 51, a powerful, efficient coupé offering classic elegance, also generated attention. In addition, the Audi brand demonstrated its expertise in e-mobility: the Audi A8 hybrid concept car, which is close to series production, and the A1 e-tron concept car both attracted particular interest from visitors to the stand.The Škoda brand unveiled the Fabia Scout to the global public in Geneva. With attractive design elements typical of an offroad vehicle, it is a breath of fresh air in the subcompact class, meeting customer wishes for mobility that is as inex-pensive as it is individual. Other premieres from the brand were the redesigned front sections of the Fabia and Roomster models, which make the vehicles look lower and broader for no change in height, thus giving them a more dynamic appearance. Škoda also presented the sporting RS variant1 of the Fabia.With its IBE concept, the SEAT brand offered a first glimpse of the future of its design language. Its compact proportions and exciting styling make this electric vehicle particularly attractive; as a tightly proportioned 2+2-seater, it is designed for a youthful lifestyle. SEAT also presented the Ibiza ST in Geneva, the estate version of its successful compact model that is aimed in particular at meeting the needs of families.The luxury Bentley, Lamborghini and Bugatti brands also thrilled visitors to the Geneva Motor Show. Bentley presented the fastest and most powerful convertible ever from the Bentley stable in the shape of the Continental Super-sports Convertible1. The design and craftsmanship of this functional, elegant super sports car mark it unmistakably as a Bentley and, thanks to its innovative FlexFuel technology,Key Events1 Consumption and emission data can be found on page 11 of this Report.2 No binding consumption and emission data is currently available for this model.UPDATED INFORMATION VOLKSWAGEN SHARES MANAGEMENT REPORT BRANDS AND BUSINESS FIELDS INTERIM FINANCIAL STATEMENTS (CONDENSED)3> Key FactsKey Eventsit can also run on bioethanol. The new top model in theGallardo series, the Lamborghini Gallardo LP 570-4Superleggera, was the center of attention at the Italianbrand’s stand. Bugatti showed the 16C Galibier, a four-doorlimousine concept whose 16-cylinder engine can also runon bioethanol.Volkswagen Commercial Vehicles celebrated the debutof the Amarok. This pickup sets new standards in its classby combining the robustness typical for the segment withinnovative technology, high safety standards and top marksin terms of consumption, comfort and ergonomics. In thesuccessful Multivan/Transporter model series, the 4Motionfour-wheel drive will also be available in combination withthe 7-gear DSG starting in 2010.VOLKSWAGEN GROU P MODELS AN D BRANDSWIN NUMEROUS AWARDSVolkswagen Group models and brands again collectedmany top prizes and awards in the first three months of2010.For the third time in succession, the Audi brand tookfirst place in German motoring association ADAC’s imageand brand survey, receiving the “Golden Angel”.Again in January, the new Polo was voted “Car of TheYear 2010” by a jury of 59 leading automotive journalistsfrom 23 countries, fighting off more than 30 competitorsto win the coveted award.The readers of specialist journal “auto, motor undsport” voted on “The Best Cars of 2010”, with seven awardsgoing to Volkswagen Group models at the end of January:the new Polo won in the small cars category by a widemargin, while the Golf finished ahead of the field in thecompact class. The Audi A4 took first place in the mid-range category, while the Škoda Octavia beat off the compe-tition in the mid-range/imports category. In the convertiblescategory, the Audi R8 Spyder went straight to number one,while the Audi Q5 was the winner in the SUV category. TheMultivan maintained its leading position in the vanscategory. Numerous other models from our Group brandsalso took second place in the various categories.The new Polo received another coveted award inFebruary when the readers of consumer magazine “GuterRat” voted it the “Most Rational Car of 2010” in the compactcategory. In particular the versatility and economy of thePolo BlueMotion1 made the crucial difference in the vote.The Golf is the safest car of 2009. That’s the conclusiondrawn by the Euro NCAP institute in Brussels from ananalysis of all the crash tests performed in 2009. The Golfscored the highest rating of all vehicles tested so far in thenew, tougher crash tests.The readers of specialist journal “OFF ROAD” voted theAudi Q5 their “off-road vehicle of the year” in the SUV cate-gory. The Audi Q7 took third place in the luxury SUV category.The Audi A5 received the highest official design awardin Germany in February in the shape of the “2010 DesignAward of the Federal Republic of Germany”. The jury wasappointed by the Federal Ministry of Economics and Technol-ogy and comprised representatives from industry, academia,design and the media.In March, the new Polo received the “iF product designaward 2010” in gold. The jury praised the small car inparticular for its excellent combination of interior andexterior design.Another design prize went to the Škoda brand, whoseYeti and Superb Estate models received the “red dot”product design price in March. The “red dot” is regardedas a seal of high design quality and is awarded by a jury ofexperts to products whose appealing, innovative designare compelling. The criteria include degree of innovation,functionality, ergonomics and durability.TRI PLE WI N AT THE DAKAR RALLYVolkswagen is continuing its success story in motor sport.In the Dakar Rally, last year’s double victory was outshonethis year by a triple win. The driver crews of Carlos Sainz/Lucas Cruz, Nasser Al-Attiyah/Timo Gottschalk and MarkMiller/Ralph Pitchford took the top three places with theirVolkswagen Race Touaregs. This means that Volkswagenremains the only car manufacturer so far that has won theDakar Rally with a diesel-powered vehicle. In the face of themost extreme stresses, the Race Touareg proved to be notonly the most robust vehicle, but also the fastest: the RaceTouareg won seven out of 14 possible stages and led thefield on eleven days.AGREEMENT ON JOB SECURITYVolkswagen and the IG Metall union successfully con-cluded the follow-up negotiations on the 2009 collectivewage agreement in February 2010. The deals reached inthis collective wage agreement included the introductionof a performance-based remuneration component and acommitment to employ vocational trainees after completionof their training, depending on performance. The outcomeof the talks to prolong the job security pact was the extension4of the job guarantee until 2014. In addition, the Company and the employee representatives stressed their commitment to jointly ensuring the target annual productivity increases.The collective wage agreement applies to the employees at the locations of Volkswagen AG, Volkswagen Sachsen and Volkswagen Financial Services in Germany.PRODUCTION MI LESTON ESThe 37 millionth vehicle produced at the Wolfsburg plant – a Golf GTI – rolled off the production line on February 24, 2010. The plant has a capacity of more than 3,400 vehicles a day; at present, the Golf, Golf Plus, Touran and Tiguan models are produced in Wolfsburg.The Kassel plant produced its 100 millionth gearbox on March 16, 2010. This plant produces around three million gearboxes every year. The anniversary gearbox was a 7-speed DSG.ENVI RONMENTAL RATI NG FOR TSI ENGI NESVolkswagen’s TSI engines received the Umweltprädikat (“Environmental Rating”) certification from the German inspection organization TÜV Nord in March 2010. The underlying environmental impact study demonstrates that the TSI engines have significantly better environmental characteristics than the predecessor generation over the entire lifecycle, from production through use to disposal, because of their reduced capacity and consumption. At the same time, the driving dynamics have been considerably improved. The “TSI Engine” Environmental Rating is available from all German Volkswagen dealers in the form of a customer brochure, and can also be downloaded at www.umweltpraedikat.de.CAPITAL INCREASE SUCCESSFULLY PLACEDOn February 3, Prof. Martin Winterkorn and Hans Dieter Pötsch gave a presentation to international analysts and investors in London on the Group’s “Strategy 2018”, including medium- and long-term goals and the roadmap for an integrated automotive group with Porsche.By issuing approximately 65 million new preferred shares, Volkswagen AG increased its share capital by a notional €166.2 million in March 2010, generating total net issue proceeds of approximately €4.1 billion in March and April. On March 23, 2010, the Board of Management of Volkswagen AG resolved, with the consent of the Super-visory Board, to implement a capital increase against cash contributions with preemptive rights for ordinary and preferred shareholders, in part by utilizing the existing authorized capital. The new shares carry full dividend rights retrospectively from January 1, 2009. The trans-action – the world’s largest publicly placed capital increase in the automotive sector – met with substantial interest, especially from institutional investors. With the consentof the Supervisory Board, the Board of Management set the subscription price at €65.00 on March 25, 2010; the subscription ratio was 37:6.The issue proceeds are intended to improve the Volks-wagen Group’s capitalization against the background of the planned creation of an integrated automotive group with Porsche. Additionally, this transaction is designed to strengthen Volkswagen’s financial stability and flexibility and to enable the Company to maintain its existing credit rating.ANN UAL GENERAL MEETI NGVolkswagen AG’s 50th Annual General Meeting and the 9th Special Meeting of Preferred Shareholders were held at the Congress Center Hamburg on April 22, 2010. With 91.1% of ordinary share capital present, the ordinary shareholders of Volkswagen AG formally approved the actions of the Board of Management and the Supervisory Board, the authorization to issue bonds with warrants and/or convertible bonds (including the creation of appropriate contingent capital and the corresponding amendment to the Articles of Association) and the remu-neration system for the members of the Board of Manage-ment described in the 2009 Annual Report. In addition, they approved the conclusion of intercompany agreements and elected PricewaterhouseCoopers AG Wirtschaftsprü-fungsgesellschaft as the auditors for fiscal year 2010 and as the auditors to review the condensed consolidated financial statements and interim management report for the first six months of 2010. Roland Oetker stepped down from his position on Volkswagen AG’s Supervisory Board as of the end of the Annual General Meeting; the Annual General Meeting elected Dr. Hussain Ali Al-Abdulla as his successor for a full term of office. Jörg Bode was also elected to the Supervisory Board for a full term of office. Mr. Bode had already been appointed as a member of the Supervisory Board of Volkswagen AG by the court on November 4, 2009 as the successor to Dr. Philipp Rösler. The Annual General Meeting also resolved to pay a dividend of €1.60 per ordinary share and €1.66 per preferred share for fiscal year 2009.28.6% of the preferred share capital was represented at the Special Meeting of Preferred Shareholders. A pro-posal had been made to this meeting to approve the autho-rizing resolution by the Annual General Meeting on the same day to issue bonds with warrants and/or convertible bonds (contingent capital). This was approved by a majority of 92.6%.The results of the votes of both meetings can be accessed on the Internet at /ir.UPDATED INFORMATION VOLKSWAGEN SHARES MANAGEMENT REPORT BRANDS AND BUSINESS FIELDS INTERIM FINANCIAL STATEMENTS (CONDENSED)5> Key FactsKey EventsThe upbeat mood that had prevailed in the internationalequity markets in the last few months of the past fiscal yearcooled in the opening weeks of 2010. The difficult financialsituation facing certain euro zone countries led to uncertaintyamong market participants. This resulted in a sharp declinein share prices that continued into February. During thisperiod, the DAX fell below 5,500 points. In late February,the markets began a rally that lasted until the end of thefirst quarter. This improvement in sentiment amongmarket participants was due mainly to positive corporateand economic data that increased hopes of a continuedrecovery in global economic activity.The DAX closed the first quarter at 6,154 points, up3.3% as against the end of 2009. At 227 points on March 31,2010, the DJ Euro STOXX Automobile was 2.1% below itslevel on December 31, 2009.Volkswagen AG’s shares tracked the market as a wholein the period between January and March 2010. Afterfalling at the beginning of the year, Volkswagen AG’sordinary and preferred shares rose significantly fromFebruary onwards. Among other things, this was attrib-utable to the disclosures on fiscal year 2009 made in thecourse of the Annual Press Conference and positive reportson sales figures for the first two months of 2010. Thepreferred shares performed positively until the end of thereporting period thanks to strong demand for the newshares resulting from the capital increase.Volkswagen AG’s preferred shares recorded theirhighest daily closing price of €72.95 on March 22, 2010.At their low on February 15, 2010, the shares traded at€55.83. They closed the reporting period at the end ofMarch at €67.90, 3.3% higher than on December 31,2009. Volkswagen AG’s ordinary shares reached theirpeak daily closing price for the reporting period of €76.11on January 11, 2010. At their low on February 12, 2010,the shares traded at €62.30. They closed on March 31,2010 at €71.50, 7.1% down on the end of 2009.Information and explanations on earnings per sharecan be found in the notes to the consolidated interimfinancial statements. Additional Volkswagen share data,plus corporate news, reports and presentations can bedownloaded from our website at /ir.SHARE PRICE DEVELOPMENT FROM DECEMBER 2008 TO MARCH 2010Index based on month-end prices: December 31, 2008 = 100Volkswagen Shares6GENERAL ECONOMIC DEVELOPMENTThe global economy continued to recover in the first quarter of 2010. The widespread use of expansionary monetary policies and the only slight increase in inflation further boosted economic growth, while fiscal stimuli declined significantly due to the need for many countries to consoli-date their budgets. Global trade recorded positive growth rates again following the sharp drop seen in 2009.The economic upturn in the USA has gathered strength in recent months. However, the situation on the labor market improved only slightly. The US dollar continued to appreciate against the euro. The Mexican economy has been in recovery since mid-2009, the pace of which is largely dictated by the performance of the US economy.Brazil’s economy gained significant momentum due to strong monetary and fiscal policy stimulus measures and buoyant domestic demand. In contrast, Argentina’s economic recovery has been less dynamic due to relatively high unemployment and inflation.Strong economic growth continued in China, India and most other emerging Asian markets in the reporting period. Extensive economic stimulus programs and higher export growth also led to an upturn in Japan. However, high government debt and ongoing deflation had a nega-tive effect.The economy in Western Europe continued to pick up in the first quarter of 2010, although there were distinct differences between the individual countries. The pace of growth varies considerably in individual countries. The countries of Central and Eastern Europe, which – with the exception of Poland – recorded clearly negative growth rates in 2009, are now also experiencing an economic recovery.Following last year’s recession, the prospects of mod-erate growth in South Africa have recently improved signifi-cantly.The economic recovery in Germany slowed noticeably in the winter of 2009/2010. Nevertheless, current indica-tors suggest that the upward trend will continue, with exports still being the main driver. As economic growth will remain weak for the time being, there is little prospect of a significant improvement in the labor market situation.EXCHANGE RATE MOVEMENTS FROM DECEMBER 2008 TO MARCH 2010 Index based on month-end prices: December 31, 2008 = 100Business DevelopmentUPDATED I NFORMAT ION VOLKSWAGEN SHARES MANAGEMENT REPORT BRANDS AND BUSINESS FIELDS INTERIM FINANCIAL STATEMENTS (CONDENSED)7> Business Development Net Assets, Financial Position and Results of Operations OutlookDEVELOPMENT OF AUTOMOTI VE MARKETSNew passenger car registrations worldwide rose sharply year-on-year in the first three months of 2010. Demand increased in all regions with the exception of Central and Eastern Europe. This was due primarily to the low prior-year level and to government incentives to buy new cars, which were introduced mainly in automobile-producing countries.The US automotive market showed signs of recovery in the first quarter of 2010: Unit sales were up year-on-year for the fifth consecutive month in March. While the Canadian market also grew, Mexico saw a further decline in vehicle sales compared with the low level in 2009.Demand for passenger cars in Brazil again increased in the reporting period. Unit sales were boosted in partic-ular by tax breaks applicable until the end of March 2010 for vehicles that can also run on bioethanol. The Argen-tinian passenger car market profited from the country’s economic upturn and returned to growth following a decline in the previous year.The Asia-Pacific region was the main growth driver for global automobile sales in the first quarter of 2010. New passenger car registrations again rose sharply in China, primarily due to the positive effects of government economic stimulus programs. In Japan, the dynamicgrowth in demand for passenger cars that began in the second half of 2009 continued in the reporting period. This trend profited in particular from tax breaks andscrapping premiums. In the Indian passenger car market, favorable macroeconomic conditions and a broader-based product offering led to a significant increase in demand compared with the weak prior-year quarter.In Western Europe, new passenger car registrations in the first three months of 2010 were up overall year-on-year. Positive effects came from government scrapping premiums that resulted in strong unit sales growth in the volume markets of Spain, the UK, Italy and France. The Central and Eastern European markets again recorded heavy losses in the reporting period following the dramatic fall in demand in the prior-year quarter. The highest absolute declines were experienced by the passenger car markets in Russia, the Ukraine, Hungary and Romania.In South Africa, demand for passenger cars in the reporting period grew substantially year-on-year.Following the expiry of the scrapping premium that was introduced in January 2009, the German passenger car market recorded the lowest number of new registrations since reunification due to extremely strong buyer reluctance in the first quarter of 2010.。
中国经济信息网中国仪器仪表行业分析报告(2010年1季度)出版日期:2010年5月 编写说明2010年1~2月,我国仪器仪表制造业资产总额比上年同期明显增长,产品销售收入同比增幅明显高于2009年。
截至2月末,累计实现产品销售收入711.61亿元,同比增长24.07%,增速比上年同期上升了33.80个百分点。
2月末,我国仪器仪表制造业资产总计为4123.34亿元,同比增长14.14%,增速比上年同期上升了6.68个百分点;企业数为5624个,比上年同期增加了466个;从业人员年均人数为107.17万人,比上年同期增加了3.01万人。
2010年1~2月,我国仪器仪表制造业工业销售产值同比出现增长,但产成品资金占用同比出现下降。
截至2月末,行业累计工业销售产值为738.97亿元,同比增长20.49%,增速比上年同期上升了26.00个百分点。
2月末,产成品资金占用为209.24亿元,同比下降2.99%,增速比上年同期下降了8.48个百分点。
2010年1~2月,我国仪器仪表制造业经营情况明显好转,亏损总额和亏损面都有所下降。
截至2月末累计利润总额为33.59亿元,比上年同期增加了15.89亿元;亏损企业累计亏损额为12.88亿元,同比下降10.79%,增速比上年同期下降了36.51个百分点。
2月末,我国仪器仪表制造业亏损面为30.28%,比上年同期减少了4.67个百分点;亏损深度为38.33%,比上年同期减少了20.77个百分点。
2010年1~3月,我国仪器仪表及文化、办公用机械制造业累计固定资产投资额为91.71亿元,同比增长28.60%,增幅比上年同期下降了2.30个百分点,增幅比同期制造业投资总额增速高2.80个百分点。
仪器仪表及文化、办公用机械制造业累计固定资产投资额占制造业固定资产投资额的比重为0.96%,占比比上年同期上升了0.02个百分点。
中国经济信息网目 录Ⅰ 2010年1~2月仪器仪表制造业运行情况 (1)一、行业规模 (1)二、资本/劳动密集度 (1)三、产销情况 (2)四、成本费用结构 (3)五、盈利情况 (4)六、行业运营绩效 (5)(一)成长能力 (5)(二)盈利能力 (5)(三)偿债能力 (6)(四)经营能力 (6)七、企业景气指数 (7)八、投资情况 (7)Ⅱ 2010年1~3月主要产品生产情况 (9)一、工业自动调节仪表与控制系统 (9)(一)累计生产情况 (9)(二)月度生产情况 (9)二、环境监测仪器仪表 (10)(一)累计生产情况 (10)(二)月度生产情况 (11)三、电工仪器仪表 (11)(一)累计生产情况 (11)(二)月度生产情况 (12)四、光学仪器 (13)(一)累计生产情况 (13)中国经济信息网(二)月度生产情况 (13)五、成分分析仪器 (14)(一)累计生产情况 (14)(二)月度生产情况 (15)六、试验机 (15)(一)累计生产情况 (15)(二)月度生产情况 (16)七、汽车仪器仪表 (17)(一)累计生产情况 (17)(二)月度生产情况 (17)八、照相机 (18)(一)累计生产情况 (18)(二)月度生产情况 (19)九、数码照相机 (19)(一)累计生产情况 (19)(二)月度生产情况 (20)十、钟 (21)(一)累计生产情况 (21)(二)月度生产情况 (21)十一、表 (22)(一)累计生产情况 (22)(二)月度生产情况 (23)十二、眼镜成镜 (23)(一)累计生产情况 (23)(二)月度生产情况 (24)Ⅲ 2010年1~3月仪器仪表进出口情况 (25)一、总体进出口情况 (25)中国经济信息网二、医疗仪器 (26)(一)出口情况 (26)(二)进口情况 (26)(三)贸易平衡 (27)Ⅳ 重点地区产业运行及产品生产情况 (28)一、重点地区产业运营状况 (28)(一)产品销售收入 (28)(二)利润 (28)(三)亏损额 (29)(四)亏损深度 (29)二、重点地区产品生产情况 (30)(一)工业自动调节仪表与控制系统 (30)(二)环境监测仪器仪表 (31)(三)电工仪器仪表 (32)(四)光学仪器 (33)(五)成分分析仪器 (34)(六)试验机 (34)(七)汽车仪器仪表 (35)(八)照相机 (36)(九)数码照相机 (36)(十)钟 (37)(十一)表 (37)(十二)眼镜成镜 (38)Ⅴ 2010年1~2月市场竞争状况 (39)一、企业规模结构 (39)(一)产品销售收入 (39)(二)利润 (39)(三)亏损企业亏损额 (40)中国经济信息网(四)亏损深度 (40)二、经济类型结构 (41)(一)产品销售收入 (41)(二)利润 (42)(三)亏损企业亏损额 (42)(四)亏损深度 (43)Ⅵ 行业动态 (44)一、智能电网预计拉动大量相关产业投资 (44)二、2009年国产PLC市场分析 (46)三、我国环保仪器仪表的发展状况 (47)(一)环保仪器仪表的主要市场需求 (47)(二)我国环保仪器仪表市场的主要问题 (48)四、压力传感器需加快国产化步伐 (49)附录 (50)一、行业说明 (50)二、指标及公式解释 (50)中国经济信息网图表目录图表 1 2010年1~2月仪器仪表制造业产业规模情况...........................................1 图表 2 2010年1~2月仪器仪表制造业资本/劳动密集度情况..............................2 图表 3 2010年1~2月仪器仪表制造业产销情况...................................................2 图表 4 2010年1~3月仪器仪表制造业工业品出厂价格指数...............................3 图表 5 2010年1~2月仪器仪表制造业成本费用情况...........................................3 图表 6 2010年1~2月仪器仪表制造业成本费用结构...........................................4 图表 7 2010年1~2月仪器仪表制造业盈利情况...................................................4 图表 8 2010年1~2月仪器仪表制造业成长能力...................................................5 图表 9 2010年1~2月仪器仪表制造业盈利能力...................................................6 图表 10 2010年1~2月仪器仪表制造业偿债能力...................................................6 图表 11 2010年1~2月仪器仪表制造业经营能力...................................................7 图表 12 2010年1季度我国仪器仪表制造业企业景气指数.....................................7 图表 13 2010年1~3月我国仪器仪表制造业固定资产投资情况...........................8 图表 14 2010年1~3月我国仪器仪表制造业固定资产投资增长情况...................8 图表 15 2010年1~3月我国工业自动调节仪表与控制系统累计产量及同比增长情况....9 图表 16 2010年1~3月我国工业自动调节仪表与控制系统月度产量及同比增长情况..10 图表 17 2010年1~3月我国环境监测仪器仪表累计产量及同比增长情况.........10 图表 18 2010年1~3月我国环境监测仪器仪表月度产量及同比增长情况..........11 图表 19 2010年1~3月我国电工仪器仪表累计产量及同比增长情况..................11 图表 20 2010年1~3月我国电工仪器仪表月度产量及同比增长情况.................12 图表 21 2010年1~3月我国光学仪器累计产量及同比增长情况.........................13 图表 22 2010年1~3月我国光学仪器月度产量及同比增长情况.........................14 图表 23 2010年1~3月我国成分分析仪器累计产量及同比增长情况.................14 图表 24 2010年1~3月我国成分分析仪器月度产量及同比增长情况.................15 图表 25 2010年1~3月我国试验机累计产量及同比增长情况.............................15 图表 26 2010年1~3月我国试验机月度产量及同比增长情况.............................16 图表 27 2010年1~3月我国汽车仪器仪表累计产量及同比增长情况.................17 图表 28 2010年1~3月我国汽车仪器仪表月度产量及同比增长情况.................18 图表 29 2010年1~3月我国照相机累计产量及同比增长情况.............................18 图表 30 2010年1~3月我国照相机月度产量及同比增长情况.............................19 图表 31 2010年1~3月我国数码照相机累计产量及同比增长情况 (19)中国经济信息网图表 32 2010年1~3月我国数码照相机月度产量及同比增长情况.....................20 图表 33 2010年1~3月我国钟累计产量及同比增长情况.....................................21 图表 34 2010年1~3月我国钟月度产量及同比增长情况.....................................22 图表 35 2010年1~3月我国表累计产量及同比增长情况.....................................22 图表 36 2010年1~3月我国表月度产量及同比增长情况.....................................23 图表 37 2010年1~3月我国眼镜成镜累计产量及同比增长情况.........................23 图表 38 2010年1~3月我国眼镜成镜月度产量及同比增长情况.........................24 图表 39 2010年1~3月我国仪器仪表进出口情况.................................................25 图表 40 2010年1~3月我国医疗仪器出口情况.....................................................26 图表 41 2010年1~3月我国医疗仪器进口情况.....................................................27 图表 42 2010年1~3月我国医疗仪器贸易平衡情况.............................................27 图表 43 2010年1~2月我国仪器仪表制造业分省市运营状况.............................29 图表 44 2010年1~3月我国工业自动控制系统分地区累计产量及同比增长情况.......31 图表 45 2010年1~3月我国环境监测仪器仪表分地区累计产量及同比增长情况.......32 图表 46 2010年1~3月我国电工仪器仪表分地区累计产量及同比增长情况.....32 图表 47 2010年1~3月我国光学仪器分地区累计产量及同比增长情况.............33 图表 48 2010年1~3月我国成分分析仪器分地区累计产量及同比增长情况.....34 图表 49 2010年1~3月我国试验机分地区累计产量及同比增长情况.................35 图表 50 2010年1~3月我国汽车仪器仪表分地区累计产量及同比增长情况.....35 图表 51 2010年1~3月我国照相机分地区累计产量及同比增长情况.................36 图表 52 2010年1~3月我国数码照相机分地区累计产量及同比增长情况.........37 图表 53 2010年1~3月我国钟分地区累计产量及同比增长情况.........................37 图表 54 2010年1~3月我国表分地区累计产量及同比增长情况.........................38 图表 55 2010年1~3月我国眼镜成镜分地区累计产量及同比增长情况.............38 图表 56 2010年1~2月我国仪器仪表制造业分企业规模运营状况.....................40 图表 57 2010年1~2月我国仪器仪表制造业分经济类型运营状况 (44)本报告图表如未标明资料来源,均来源于“中经网统计数据库”中国经济信息网Ⅰ 2010年1~2月仪器仪表制造业运行情况一、行业规模2010年1~2月,我国仪器仪表制造业资产总额比上年同期明显增长,产品销售收入同比增幅明显高于2009年。
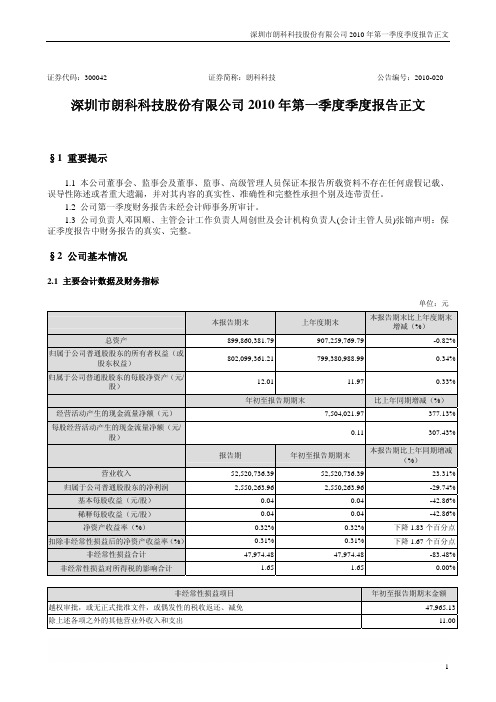
证券代码:300042 证券简称:朗科科技公告编号:2010-020 深圳市朗科科技股份有限公司2010年第一季度季度报告正文§1 重要提示1.1 本公司董事会、监事会及董事、监事、高级管理人员保证本报告所载资料不存在任何虚假记载、误导性陈述或者重大遗漏,并对其内容的真实性、准确性和完整性承担个别及连带责任。
1.2 公司第一季度财务报告未经会计师事务所审计。
1.3 公司负责人邓国顺、主管会计工作负责人周创世及会计机构负责人(会计主管人员)张锦声明:保证季度报告中财务报告的真实、完整。
§2 公司基本情况2.1 主要会计数据及财务指标单位:元本报告期末上年度期末本报告期末比上年度期末增减(%)总资产899,860,381.79907,259,769.79 -0.82%归属于公司普通股股东的所有者权益(或股东权益)802,099,361.21799,380,988.99 0.34%归属于公司普通股股东的每股净资产(元/股)12.0111.97 0.33%年初至报告期期末比上年同期增减(%)经营活动产生的现金流量净额(元)7,504,021.97 377.13%每股经营活动产生的现金流量净额(元/股)0.11 307.43%报告期年初至报告期期末本报告期比上年同期增减(%)营业收入52,520,736.3952,520,736.39 23.31%归属于公司普通股股东的净利润2,550,263.962,550,263.96 -29.74%基本每股收益(元/股)0.040.04 -42.86%稀释每股收益(元/股)0.040.04 -42.86%净资产收益率(%)0.32%0.32% 下降1.83个百分点扣除非经常性损益后的净资产收益率(%)0.31%0.31% 下降1.67个百分点非经常性损益合计47,974.4847,974.48 -83.48%非经常性损益对所得税的影响合计 1.65 1.65 0.00%非经常性损益项目年初至报告期期末金额越权审批,或无正式批准文件,或偶发性的税收返还、减免47,965.13除上述各项之外的其他营业外收入和支出11.00所得税影响额-1.65合计47,974.48 2.2 报告期末股东总人数及前十名无限售条件股东持股情况表单位:股报告期末股东总数(户)9,517前十名无限售条件流通股股东持股情况股东名称(全称)期末持有无限售条件流通股的数量种类李欣忆458,590人民币普通股华润深国投信托有限公司-明达3期证券信托126,800人民币普通股黄东生100,000人民币普通股中国建设银行股份有限公司企业年金计划-中国工商银行93,410人民币普通股李建新89,300人民币普通股陆松伟72,600人民币普通股华润深国投信托有限公司-明达2期71,227人民币普通股华润深国投信托有限公司-明达证券投资集合资金信托71,000人民币普通股韩辉70,009人民币普通股章龙琴69,500人民币普通股2.3 限售股份变动情况表单位:股股东名称期初限售股数本期解除限售股数本期增加限售股数期末限售股数限售原因解除限售日期邓国顺15,450,000 0015,450,000上市承诺2013-01-08成晓华11,025,200 0011,025,200上市承诺2013-01-08珲春田木投资咨询有限责任公司4,830,500 004,830,500上市承诺2011-01-08 向锋1,558,400 001,558,400上市承诺2011-01-08 周创世1,081,400 001,081,400上市承诺2011-01-08 王全祥2,865,000 002,865,000上市承诺2011-01-08 张咏梅1,961,000 001,961,000上市承诺2011-01-08 王荣640,000 00640,000上市承诺2011-01-08 王斐2,469,000 002,469,000上市承诺2011-01-08 李俊2,354,000 002,354,000上市承诺2011-01-08 陈小梅300,000 00300,000上市承诺2011-01-08 敬彪225,000 00225,000上市承诺2011-01-08 张锦225,000 00225,000上市承诺2011-01-08 罗培彬150,000 00150,000上市承诺2011-01-08 钟智渊150,000 00150,000上市承诺2011-01-08 王爱凤150,000 00150,000上市承诺2011-01-08刘一宁150,000 00150,000上市承诺2011-01-08高丽晶100,000 00100,000上市承诺2011-01-08万红波100,000 00100,000上市承诺2011-01-08卢赛文100,000 00100,000上市承诺2011-01-08叶琦85,000 0085,000上市承诺2011-01-08杜铁军75,000 0075,000上市承诺2011-01-08王斓60,000 0060,000上市承诺2011-01-08杨立平60,000 0060,000上市承诺2011-01-08程学敏60,000 0060,000上市承诺2011-01-08陈秀华40,000 0040,000上市承诺2011-01-08孙儒楠40,000 0040,000上市承诺2011-01-08邹潜40,000 0040,000上市承诺2011-01-08苏剑40,000 0040,000上市承诺2011-01-08李新志40,000 0040,000上市承诺2011-01-08吕力鹏40,000 0040,000上市承诺2011-01-08吴斌40,000 0040,000上市承诺2011-01-08邓先兵40,000 0040,000上市承诺2011-01-08范培¬B 40,000 0040,000上市承诺2011-01-08蔡学峰25,000 0025,000上市承诺2011-01-08吴琛25,000 0025,000上市承诺2011-01-08门琳25,000 0025,000上市承诺2011-01-08林松25,000 0025,000上市承诺2011-01-08韩颖25,000 0025,000上市承诺2011-01-08陈明航25,000 0025,000上市承诺2011-01-08袁丽霞2,150,000 002,150,000上市承诺2011-01-08王勇150,000 00150,000上市承诺2011-01-08邱淑茹96,000 0096,000上市承诺2011-01-08李方圆37,000 0037,000上市承诺2011-01-08田晓莉37,000 0037,000上市承诺2011-01-08程利权795,500 00795,500上市承诺2011-01-08首次公开发行网3,360,000 003,360,000网下配售2010-04-08下配售股份合计53,360,000 0053,360,000--§3 管理层讨论与分析3.1 公司主要财务报表项目、财务指标大幅度变动的情况及原因√适用□不适用1、应付票据较年初增加779.25 万元,增长124.49%,主要原因是用票据支付了部分应付账款所致;2、应付帐款较年初减少1006.90万元,下降29.68%,主要原因是结算了部分应付账款所致;3、其他应付款较年初减少了767.97万元,下降93.67%,主要原因是支付了上市相关的发行费用所致;4、营业成本较去年同期增加了1051.96万元,增长31.21%,主要原因是产品销售收入上升及产品毛利率下滑,相应导致营业成本上升所致;5、财务费用较去年同期减少34.15万元,下降373.94%,主要是公司发行新股后,存款规模大幅增加,利息收入相应增加;6、经营活动产生的现金流量净额较去年同期增加1021.18万元,增长377.13%,主要是公司销售规模扩大,且收回部分应收帐款所至;7、投资活动产生的现金流量净额较去年同期减少462.89万元,下降43.99%,主要是公司对朗科大厦的投资增加所致;8、筹资活动产生的现金流量净额较去年同期减少179.62万元,下降33.63%,主要是公司支付了上市相关的发行费用所致。
2010年3月5日9时,十一届全国人民代表大会第三次会议在人民大会堂举行开幕会,国务院总理温家宝在会上做了政府工作报告。
Following are the highlights of Wen's Report on the Work of the Government.以下是温家宝总理政府工作报告中的亮点解读。
Key words: Income distribution, 'Hukou' reform, Employment, Low-carbon, Housing prices关键词:收入分配、户口改革、就业、“低碳”、房价WORK REVIEW IN 20092009年政府工作报告2010年主要目标-- China's gross domestic product (GDP) reached 33.5 trillion yuan, up 8.7 percent from a year earlier.--2009年国内生产总值达33.5万亿元,比上年增长8.7%。
-- Fiscal revenue was 6.85 trillion yuan, up 11.7 percent year on year.财政收入达6.85万亿元,同比增长11.7%。
-- Grain production was 531 million tonnes, a new record and increasing for the sixth consecutive year.--粮食产量达5.31亿吨,再创历史新高,实现连续六年增产。
-- A total of 11.02 million job opportunities were created for urban residents.--城镇新增就业1102万人。
-- The per capita disposable income of urban residents was 17,175 yuan, up 9.8 percent in real terms, while the net per capita income of rural residents was 5,153 yuan, rising 8.5 percent in real terms.--城镇居民人均可支配收入17175元,实际增长9.8%;农村居民人均纯收入5153元,实际增长8.5%。
Stock Code: 000029 Short Form of Stock: SHENSHENFANG A Notice No.: 2010-023 SHENZHEN SPECIAL ECONOMIC ZONE REALESTATE & PROPERTIES (GROUP) CO., LTD.THE THIRD QUARTERLY REPORT 2010§1. Important Notice1.1 The Board of Directors, the Supervisory Committee and the directors, supervisorsand senior management of SHENZHEN Special Economic Zone Real Estate & Properties (Group) Co., Ltd. (hereinafter referred to as “the Company”) hereby guarantee that this report does not contain any false information, misleading statements or material omissions, and accept, individually and collectively, the responsibility for the factuality, accuracy and completeness of this report.1.2 The Financial Report in this quarterly report has not been audited by a CPA firm.1.3 Mr. Zhou Jianguo, Person-in-charge of the Company, Mr. Chen Maozheng,Person-in-charge of the accounting work, and Mr. Chen Jincai, Person-in-charge of the accounting organ hereby confirm the factuality and completeness of the Financial Report in this quarterly report.§2 Company Profile2.1 Main accounting data and financial indicatorsUnit: (RMB) YuanAs at 30 Sep. 2010 As at 31 Dec. 2009 Increase/decrease (%) Total assets (RMB) 3,407,259,180.863,361,110,324.04 1.37% Owners’ equity attributable to shareholders oflisted company (RMB)1,307,389,526.081,228,651,614.41 6.41% Share capital (share) 1,011,660,000.001,011,660,000.00 0.00% Net assets per share attributable toshareholders of listed company (RMB/share)1.2923 1.2145 6.41%Jul.-Sep. 2010Increase/decreaseyear-on-year (%)Jan.-Sep. 2010Increase/decreaseyear-on-year (%)Total operation income (RMB) 188,731,241.8715.80%707,557,933.94 55.92% Net profit attributable to shareholders of listedcompany (RMB)12,995,637.17266.68%77,136,638.45 584.47% Net cash flows generated from operating - --248,352,597.52activities (RMB)Net cash flows per share generated fromoperating activities (RMB/share)- - -0.25 Basic earnings per share (RMB/share) 0.0128265.71%0.0762 586.49% Diluted earnings per share (RMB/share) 0.0128265.71%0.0762586.49% Weighted average return on net assets (%) 1.00%0.71% 6.09% 5.16% Weighted average return on net assets afterdeducting extraordinary gains and losses (%)1.00%0.72% 5.33% 4.89%Items of non-recurring gains and losses Amount from year-begin to theend of this report periodNotesGains and losses from disposal of non-current assets 9,595,497.65Gains and losses from changes in fair value of the held tradablefinancial assets and liabilities, and investment income from disposal oftradable financial assets and liabilities and available-for-sale financialassets, excluding the effective hedging businesses related with thenormal operation of the Company188,148.35Other non-business income and expenses besides the above items 31,144.09Effect on income tax -7,786.00Total 9,807,004.09-2.2 Total number of shareholders at period-end and shareholding of top tenshareholders holding tradable sharesUnit: shareTotal number of shareholders at the period-end98,610Shareholding of top ten shareholders holding tradable sharesFull name of shareholderNumber of tradableshares held at period-endType of shareShenzhen Investment Holdings Co., Ltd. 642,884,262RMB Ordinary SharesCPI Financial Co., Ltd. 3,336,701RMB Ordinary Shares Banque Indosuez 1,310,800RMB Ordinary Shares Wang Zhongming 1,095,408Domestically listed foreign shares Guan Jinfeng 1,062,220RMB Ordinary SharesXu Taiying 780,000RMB Ordinary SharesXue Haoyuan 746,356RMB Ordinary Shares Zhang Rui 730,700RMB Ordinary Shares CHU KOON YUK 720,000Domestically listed foreign sharesICBC-GF China Securities 500 Index Securities678,580RMB Ordinary Shares Investment Fund (LOF)§ 3 Significant Events3.1 Particulars about major changes of main accounting statement items and financial indicators, as well as reasons for the changes√Applicable □InapplicableAs at 30 Sep. 2010, total assets of the Company was RMB 3,407,260,000, with an increase of 1.37% compared with RMB 3,361,110,000 at the year-begin, and liabilities totaled RMB 2,112,890,000, with a decrease of 1.52% compared with RMB 2,145,480,000 at the year-begin. Equity (net assets) attributable to shareholders of parent company was RMB 1,307,390,000, with an increase of 6.41% compared with RMB 1,228,650,000. Particulars about large changes in items and reason were as follows:Index of balance sheet: transactional financial assets was RMB 173,500, up by 101.08% compared with RMB 86,300 at the end of last year, mainly because the Company won the lot for new share in transaction; accounts receivable was RMB 27,366,200, up by 85.76% compared with RMB 14,732,400 at the end of last year, mainly because payment payable for constructional engineering and fund from sales of real estate increased; Payment in advance of RMB increased 32.72% compared with RMB 18,020,300 at the end of last year, mainly because payment for engineering in advance increased; short-term borrowing was RMB 14,800,000, down by 85.20% compared with RMB 100,000,000 at the end of last year, which was mainly due to return mature short-term borrowings from bank; Non-current liabilities due within one year was RMB 127,602,900, down by -44.43% compared with 229,607,200 at the end of last year, which was mainly due to return mature long-term borrowings from bank; long-term borrowing was RMB 1,070,218,200, up by 83.89% compared with RMB 581,986,500 at the end of last year, mainly because of new long-term borrowings from bank; accounts payable was RMB 146,875,700, down by -79.91% compared with RMB 730,944,400 at the end of last year, which was mainly because the Company paid the second installment fund for use right of two land in Guangming New District; Payment received in advance was RMB 406,039,600, with an increase of 158.43% compared with RMB 157,116,100 at the end of last year, mainly because the Company received fund for sales of 10th Phase of Jinye Island Project and fund for constructional engineering from Shenzhen Zhentong Engineering Co., Ltd; interest payable was RMB 41,059,800, with an increase of 66.32% compared with RMB 2468.77 at the end of last year, mainly because the Company withdrew interest for borrowings in advance.Index of incomes statement and cash flow statement: operating income was RMB 707557900, with an increase of 55.92% compared with RMB 453788400 at the same period of last year, mainly because income from sales of real estate and engineering increased; operating cost was RMB 469,522,200, with an increase of 36.87%compared with RMB 343,034,500 at the same period of last year, which was mainly due to increase with operating income; business taxes and surcharges were RMB 67,886,700, with an increase of 84.63% compared with RMB 36,768,700 at the same period of last year, which was due to increase with operating income; sales expense was RMB 8,453,800, with an increase of 68.36% compared with RMB 5,021,300 at the same period of last year, mainly because advertising and sales service expense increased; financial expense was RMB 453,59,300, with an increase of 181.29% compared with RMB 16,125,400 at the same period of last year, mainly because increase of borrowings caused interest expense increased; investment income was RMB 22,538,300, with an increase of 189.04% compared with RMB 7,797,700 at the same period of last year, which was mainly because income from share transferring and investment income from affiliated and jointed enterprises increased; net profit attributable to owners of parent company totaled RMB 77,136,700, with an increase of 584.47% compared with RMB 11,269,500 at the same period of last year, mainly because operating income increased, gross profit ratio rose and investment income increased; net cash flow from operating activities was RMB -248,352,600, with an increase of 56.10% compared with RMB -565,752,900 at the same period of last year, mainly because cash received from sales of goods and offering labor service increased; net cash flow from investing activities was RMB 10,515,300, with an increase of 39.20% compared with RMB 7,554,200 at the same period of last year, mainly because cash received from investment income increased; net cash flow from financing activities was RMB 261,373,600, with a decrease of 56.67% compared with RMB 603,193,900 at the same period of last year, mainly because cash paid for debt increased;3.2 Progress and influence of significant events, as well as the analysis on solutions 3.2.1 Non-standard audit opinion□Applicable √Inapplicable3.2.2 Whether the Company provided funds to the controlling shareholder or its related parties or provided guarantees to external parties in violation of the prescribed procedures□Applicable √Inapplicable3.2.3 Signing and execution of significant contracts concerning routine operations□Applicable √Inapplicable3.2.4 Others□Applicable √Inapplicable3.3 Fulfillment of commitments made by the Company, shareholders and the actual controller√Applicable □InapplicableCommitment CommitmentmakerContents of commitment ImplementationCommitment made in the share reform Shenzhen Shenzhen Investment Holding Co., Ltd. made The commitmentsInvestment Holdings Co. Ltd the following commitments concerning therelevant matters of the share merger reform ofSPG: “ ①The Company shall abide by therelevant laws, regulations and rules, and fulfillthe legal commitments; ②The Companyhereby declares that: The promisor shallfaithfully fulfill its commitments and shoulder corresponding responsibilities; Unless thetransferee agrees to and is able to fulfill the commitments, the promisor shall not transferthe held shares. ③The Company herebydeclares that: Should the promisor fail tofulfill its commitments prescribed in therelevant documents, it shall compensate theother shareholders for their losses caused thereupon.”have been fulfilledCommitment in the acquisition report orthe report on equity changesNaught Naught NaughtCommitment made in the significant asset reorganizationShenzhenInvestmentHoldings Co. LtdThe Shenzhen Sate-owned Assets Supervisionand Administration Commission issued theLetter on Relevant Matters ConcerningInformation Disclosure of SPG to ShenzhenInvestment Holdings Co., Ltd. in Oct. 2009,making a commitment that it would notconduct transfer of SPG share rights throughagreements, asset reorganization or othermatters (not including shareholding reductionin the secondary market) that have significantinfluence on SPG in the year and the nextyear.The commitmentis currently in theprocess ofexecution.Commitment made in the issuance Naught Naught Naught Other commitments (includingsupplementary ones)Naught Naught Naught3.4 Warnings of possible losses or major changes of the accumulative net profitachieved during the period from year-begin to the end of the next report period compared with the same period of last year, as well as explanation on reasons√Applicable □InapplicablePerformance forecast Significant increase in the same directionFrom the year-begin to the endof the next report periodSame period of last year Increase/decrease (%)Estimated accumulative net profit (RMB Ten thousand) 8,200.00 -- 8,700.002,021.74Increase 305.59%-- 330.32%Basic earnings per share (RMB/share) 0.0811 -- 0.08600.0200Increase 305.50%-- 330.00%Notes to performance forecast Mainly due to the increase of the real estate and construction project incomes3.5 Other significant events that need to be explained3.5.1 Investments into securities√Applicable □InapplicableUnit: RMB YuanSerial No. Securities variety Stock codeShort form ofstockInitialinvestmentamount(Yuan)Shares heldat period-end(share)Book value atperiod-endProportion intotalsecuritiesinvestment atperiod-end(%)Gains or lossesin report period1 Stock 002137Sea StarTechnology5,150.0097510,773.75 6.21% 5,623.752 Stock 601857 China NationalPetroleum50,100.003,00030,540.00 17.60% -19,560.003 Stock 601866ChinaShippingContainerLines13,240.002,0007,360.00 4.24% -5,880.004 Stock 601898 China CoalEnergy16,830.001,0009,920.00 5.72% -6,910.005 Stock 002440ZhejiangRuntu Co., Ltd31,200.001,00028,520.00 16.44% -2,680.006 Stock 601000 TangshanPort16,400.002,00015,060.00 8.68% -1,340.00 7 Stock 601018 NingboPort 22,200.006,00021,300.00 12.28% -900.008 Stock 780377 Subscription ofIndustrialSecurities50,000.005,00050,000.00 28.82% 0.00Other securities investments held at period-end 0.00- 0.000.00%0.00 Gains/ losses from securities investment sold in reportperiod- - - - 98,033.09 Total 205,120.00- 173,473.75 100%66,386.84 Explanation on securities investment:Stocks held by the Company were lottery of new shares, which has been sold incurrent day when benefit.3.5.2 Researches, interviews and visits received in report periodTime Place Way of Visitor Main discussion and materials provided by the Companyreception15 Jul. 2010 CompanyOfficeFieldresearchDonghai Securities andGuodu SecuritiesA general visit, with no written materials being provided by theCompany28 Jul. 2010 CompanyOfficeBy phone Individual investorInquiring reasons for the Company’s stock price fluctuations,with no written materials being provided by the Company13 Aug. 2010 CompanyOfficeBy phone Individual investorInquiring the time for disclosure of the Company’s semi-annualreport, with no written materials being provided by theCompany30 Aug. 2010 CompanyOfficeBy phone Individual investorInquiring about the Company’s semi-annual report, with nowritten materials being provided by the Company8 Sept. 2010 CompanyOfficeBy phone Individual investorInquiring about the Company’s project development and thesales situation, with no written materials being provided by theCompany19 Sept. 2010 CompanyOfficeBy phone Individual investorInquiring about the Company’s project development plans, withno written materials being provided by the Company29 Sept. 2010 CompanyOfficeBy phone Individual investorInquiring the Company’s operations and its opinion on thegovernment’s macro-control measures, with no writtenmaterials being provided by the Company3.6 Investments into derivatives□Applicable √Inapplicable3.6.1 Positions of derivatives investments held at period-end □Applicable √Inapplicable。
深交所多层次资本市场上市公司2010年年度业绩及2011年一季度业绩情况简析截至2011年4月30日,深交所1270家上市公司如期披露了2010年年报或年报数据,其中主板公司485家,中小板公司576家,创业板公司209家。
统计数据显示,深交所上市公司2010全年实现营业收入36,817.06亿元,同比增长34.78%;实现归属于上市公司股东的净利润2,486.34亿元,同比增长38.08%。
尽管2010年宏观经济形势存在诸多不确定因素,深交所各板块上市公司业绩仍然实现稳步增长。
一、深交所上市公司2010年总体业绩情况1、总体业绩增长明显2010年,深交所各板块上市公司业绩保持平稳增长势头。
主板485家公司共计实现营业收入26,678.62亿,同比增长35.20%;实现净利润1,508.13亿元,同比增长42.10%。
中小板576家上市公司平均实现营业收入16.12亿元,同比增长33.29%;平均实现净利润1.44亿元,同比增长32.53%。
超过90%的中小板公司实现营业收入增长;近80%的中小板公司实现营业收入、净利润双增长。
创业板上市公司2010年实现平均营业收入4.09亿元,同比增长38.02%,92%的创业板公司实现营业收入同比增长;平均净利润为0.71亿元,较上年增长31.2%,85%的创业板公司实现净利润同比增长。
2010年,深交所上市公司整体盈利能力较2009年度大幅提高,同时亏损面进一步缩小。
2、业绩增长源于主营,非经常性损益占比下降2010年,主板公司扣除非经常性损益后的净利润同比增加56.86%,超出净利润增幅14.76个百分点;非经常性损益占当期净利润比例为13.06%,同比下降8.22个百分点。
披露年报的中小板公司扣除非经常性损益后的平均净利润为1.35亿元,非经常性损益占净利润比例为6.25%,同比减少2个百分点。
创业板公司主业突出,利润总额中九成以上来源于主营业务;投资收益、营业外收支净额及公允价值变动损益等非经常性项目占当期利润总额比例分别仅为0.2%、8.7%与0.7%。
SHENZHEN PROPERTIES & RESOURCES DEVELOPMENT (GROUP) LTD.THE FIRST QUARTERLY REPORT 2011§1 Important Notes1.1 The Board of Directors, the Supervisory Committee as well as directors, supervisors and seniorexecutives of Shenzhen Properties & Resources Development (Group) Ltd (hereinafter referred to as “the Company”) individually and jointly accepted responsibility for the correctness, accuracy and completeness of the contents of this report and confirmed that there was no false information, misleading statement or material omissions.1.2 None of the directors demonstrated uncertainty or disagreement about the truthfulness, accuracy,and completeness of this quarterly report.1.3 All directors attended the Board meeting.1.4 The first quarterly financial report has not been audited by Accounting Firm.1.5 Mr. Chen Yugang, Chairman of the Board of the Company, Mr. Wang Hangjun, Person inCharge of Accounting Work, Mr. Gong Sixin, the CFO, and Ms. Shen Xueying, Manager of Financial Management Department, hereby confirmed that the Financial Report enclosed in the quarterly report is true and completeEnglish version for reference only. Should there be any discrepancy between the two versions, the Chinese version shall prevail.§2 Company Profile2.1 Main accounting data and financial indicesUnit: RMB YuanAt the end of theAt the end of last year Increase/decrease (%)reporting periodTotal assets 3,038,489,092.412,913,281,353.84 4.30% Owner’s equity attributable1,159,513,142.82874,185,621.8832.64% to shareholders of listedcompanyShare capital (Share) 595,979,092.00595,979,092.000.00% Net asset per share1.9456 1.4668 32.64%attributable to shareholdersof listed companyReporting period Same period of last year Increase/decrease (%)Sales turnover (RMB977,257,810.34 83,097,068.04 1076.04% Yuan)Net profit attributable to284,605,173.95 2,839,794.18 9922.04% shareholders of listedcompany (RMB Yuan)Net cash flow arising fromoperating activities (RMBYuan)-386,088,186.93-19,498,084.971880.13%Net cash flow per sharearising from operatingactivities (RMB Yuan/share)-0.6478 -0.0327 1881.04%Basic earnings per share(RMB Yuan/share)0.4775 0.0048 9847.92% Diluted earnings per share(RMB Yuan/share)0.4775 0.0048 9847.92% Weighted average return onequity (%)27.99%0.43%Increase of 27.56% Weighted average return onequity after deductingextraordinary gains andlosses (%)27.98%-0.08%Increase of 28.06%Items of extraordinary gainsand lossesAmount from 1 Jan. to 31 Mar. 2011Gains on disposal ofnon-current assets-14,836.00 Other non-operating incomeand expense other thanabovementioned146,725.86Influence of income tax afterdeducting non-recurringgains and losses-15,871.40Total 116,018.46 Note: Other non-operating income and expense other than abovementioned mainly cover fines.2.2 Statement on total number of shareholders and shares held by the top ten shareholders not subject to trading moratoriumUnit: ShareTotal number of shareholders By the end of the reporting period, the Company has 47,293 shareholders in total, including 37,535 ones of A-share, 9,758 ones of B-shareShares held by the top ten shareholders not subject to trading moratoriumFull name of shareholders Shares not subject to trading moratoriumheld at the period-endType of shareZeng Ying 3,350,000Domestically listed foreign sharesChina Merchants Securities (HK) Co., Ltd. 855,810Domestically listedforeign sharesZhang Xiankai 673,800RMB common sharesLong Huizhen 667,020RMB common sharesLiu Liaoyuan 641,900Domestically listed foreign sharesGUOTAI JUNAN SECURITIES(HONGKONG)LIMITED 633,273Domestically listedforeign sharesSUN HUNG KAI INVESTMENT SERVICES LTD-CUSTOMERS A/C 560,000Domestically listedforeign sharesHe Shujie 551,195RMB common shares Liu Yunde 550,000RMB common shares Deng Weichao 480,100RMB common sharesExplanation on associated relationship among the above shareholders orconsistent action The Company is not aware of whether there exists associated relationship or consistent action among the top ten shareholders holding trade shares or not.§3 Significant Events3.1 Significant changes in major accounting data, financial highlights and reasons for these changes. √Applicable □Non-applicable1. Prepayments were RMB 391,278,337.28 as at the end of the reporting period, up 692.70% as compared to the opening amount, which was mainly because the Company prepaid for the land in Yangzhou and the relevant taxes in the reporting period.2. Deferred income tax assets were RMB 41,453,082.09 as at the end of the reporting period, down 50.18% as compared to the opening amount, which was mainly because the estimated profit calculated based on the Company’s real estate pre-sale income was recognized at the end of the reporting period and deferred income tax assets decreased accordingly.3. Short-term borrowings were RMB 500,000,000.00 as at the end of the reporting period, up 4900.00% as compared to the opening amount, which was mainly because the entrustment loans given by the holding company to the Company increased in the reporting period.4. Accounts received in advance were RMB 34,766,758.80 as at the end of the reporting period, down 96.04% as compared to the opening amount, which was mainly because the income from the pre-sale of the PRD-Shengang No. 1 Project satisfied conditions for recognition and was carried over to income for the reporting period.5. Taxes and fares payable were RMB 499,050,580.15 as at the end of the reporting period, up 155.16% as compared to the opening amount, which was mainly because the income from the PRD-Shengang No. 1 Project was recognized for the reporting period, and the income tax and land V AT payable increased accordingly.6. Non-current liabilities due within one year were RMB 149,580,000.00 as at the end of the reporting period, down 40.40% as compared to the opening amount, which was mainly because mature loans were repaid in the reporting period.7. Retained earnings were RMB 433,566,838.35 as at the end of the reporting period, up 191.06% as compared to the opening amount, which was mainly because the Company achieved profits in the reporting period.8. Total owners’ equity was RMB 1,160,375,229.88 as at the end of the reporting period, up 32.61% as compared to the opening amount, which was mainly because the Company achieved profits inthe reporting period.9. Operating revenue for the reporting period was RMB 977,257,810.34, up 1076.04% from a year earlier, which was mainly because: The PRD-Shengang No. 1 Project developed by the Company satisfied conditions for income recognition in the reporting period and the recognizable part were almost all settled in the reporting period, while in the same period of last year, only a small trail part of real estate were eligible for income recognition. As a result, real estate income for the reporting period showed dramatic increase over the same period of last year.10. Operating cost for the reporting period was RMB 266,881,637.62, up 369.60% from a year earlier, which was mainly because the estate of the PRD-Shengang No. 1 Project which generated income eligible for recognition increased in the reporting period as compared to the same period of last year.11. Business taxes and surcharges for the reporting period were RMB 310,352,802.05, up 4274.94% from a year earlier, which was mainly because real estate income increased and business taxes and land V AT increased accordingly.12. Financial expense for the reporting period was RMB 1,714,761.50, up 206.65% from a year earlier, which was mainly due to increase of total borrowings for working capital and decrease of interest income.13. Investment income for the reporting period was RMB 127,236.78, up 66.64% from a year earlier, which was mainly due to increase of income from joint ventures.14. Investment income from associated and joint enterprises for the reporting period was RMB 127,236.78, up 47.18% from a year earlier, which was mainly because the Company’s joint venture Shenzhen ITC Guomao Tianan Property Management Co., Ltd. achieved a profit growth in the reporting period.15. Non-business income/expense for the reporting period was RMB 131,889.86, down 96.07% from a year earlier, which was mainly because in the same period of last year, subsidiaries of the Company received some payments that needed not to be returned.16. Income tax expense for the reporting period was RMB 91,962,168.59, up 8275.81% from a year earlier, which was mainly because the subsidiary Shenzhen Huangcheng Real Estate Co., Ltd. enjoyed a consideration profit increase in the reporting period.17. Operating profit, total profit and net profit for the reporting period were RMB 376,435,452.68, RMB 376,567,342.54 and RMB 284,605,173.95 respectively, up 65009.09%, 9463.02% and 9922.04% respectively as compared to the same period of last year, which was mainly because: The PRD-Shengang No. 1 Project developed by the Company satisfied conditions for income recognition in the reporting period and the recognizable part were almost all settled in the reporting period, while in the same period of last year, only a small trail part of real estate were eligible for income recognition. As a result, real estate income for the reporting period showed dramatic increase over the same period of last year.18. Net cash flows generated from operating activities during the period from 1 Jan. to 31 Mar. 2011 were RMB -386,088,186.93, with net outflows up 1880.13% as compared to the same period of last year, which was mainly because the Company paid for the land in Yangzhou and the relevant taxes in the reporting period.19. Net cash flows generated from investing activities during the period from 1 Jan. to 31 Mar. 2011 were RMB -670,121.00, with net outflows down 94.73% as compared to the same period of last year, which was mainly because in the same period of last year, some subsidiaries of theCompany replaced old taxies.20. Net cash flows generated from investing activities during the period from 1 Jan. to 31 Mar. 2011 were RMB 381,055,814.46, up 354.60% as compared to the same period of last year, which was mainly because the Company obtained an entrustment loan from the holding company and repaid fewer loans in the reporting period.3.2 Process of significant events and influence, as well as analysis and explanation on resolving proposal□Applicable √Inapplicable3.3 Special commitments made by the company, shareholders and actual controllers√Applicable □InapplicableShenzhen Construction Investment Holdings Co. (hereinafter referred to as “Construction Holdings”) and Shenzhen Investment Management Co. (hereinafter referred to as “Investment Management Company”) were nominal shareholders of the Company (Shares of the Company are registered under the name of these two companies.). Later, these two companies and Shenzhen Trade & Commerce Investment Holdings Co. combined on a legal basis and became one company known as Shenzhen Investment Holdings Co., Ltd. (hereinafter referred to as “Investment Holdings”). However, due to various reasons, the Company’s shares held by Construction Holdings and Investment Management Company has not been transferred to Investment Holdings, which is the actual controller of the Company.1. Investment Holdings stated that it would establish and perfect the internal control over undisclosed information of the listed company known by it, urge relevant insiders not to trade the shares of the Company by making use of the undisclosed information, not suggest other buying and selling shares of the Company, nor leak any undisclosed information of the Company. Meanwhile, it would provide an insider name list to the Company in a timely, factual, accurate and complete way so that the Company could submit the name list to the Shenzhen Bureau of CSRC and the Stock Exchange for records.In the reporting period, it was found that no actual controller of the Company or insiders bought and sold stocks of the Company by taking advantage of undisclosed information of the Company. And the Company submitted monthly the particulars about the parties to which the undisclosed information had been submitted to CSRC Shenzhen Bureau for reference.2. Commitments made by non-tradable share holders in the share merger reform(1) The Company’s non-tradable share holders Construction Holdings and Investment Management Company made a common commitment to abide by laws, regulations and rules and perform prescribed commitment duties. And they also made special commitments as follows:Non-tradable shares held by Construction Holdings and Investment Management Company would not be traded or transferred within 36 months since they acquired right of trade. After expiration of the aforesaid commitment, originally non-tradable shares sold through the listing and trading system on the Shenzhen Stock Exchange should not exceed 5 percents of total shares of the Company within 12 months, as well as not exceed 10 percents within 24 months. In case these companies acted against the above commitment and sold shares of the Company, the income from sales of the shares would belong to the Company.As at the date of issuing the announcement, Construction Holdings and Investment ManagementCompany failed to sell the shares of the Company.(2) Investment Holdings made a commitment to abide by laws, regulations and rules and perform prescribed commitment duties. And it also made special commitments as follows:① Non-tradable shares held by Investment Holdings would not be traded or transferred within 36 months since they acquired right of trade. After expiration of the aforesaid commitment, originally non-tradable shares sold through the listing and trading system on the Shenzhen Stock Exchange should not exceed 5 percents of total shares of the Company within 12 months, as well as not exceed 10 percents within 24 months. In case these companies acted against the above commitment and sold shares of the Company, the income from sales of the shares would belong to the Company. As at the date of issuing the announcement, Investment Holdings failed to sell the shares of the Company that are actually controlled by it.②Within one year since the non-tradable shares held by Construction Holdings and Investment Management Company controlled by Investment Holdings acquired the right of trading, Shenzhen Investment Holdings Co., Ltd will start up capital injection to the Company, that is, Shenzhen Investment Holdings Co., Ltd will inject legitimate capital no less than RMB 500 million including land resource in lump sum or in batches by replace or other legitimate way, will increase land reserves of the Company and enhance profitability in the future. In case the aforesaid capital failed to start completely within one year, Shenzhen Investment Holdings Co., Ltd will compensate 20% of reorganization capital failing to start to the Company within 30 days when expiration of 1 year, and continued to implement the capital injection which had been started. As for the capital injection failing to start, Shenzhen Investment Holdings Co., Ltd will not implement. Note: Startup of capital injection means capital injection program has been reviewed and approved by the Shareholders’ General Meeting of the Company. Shenzhen Investment Holdings Co., Ltd was willing to entrust China Securities Depository and Clearing Corporation Limited Shenzhen Branch to freeze 30 million shares of the Company, which was under name of Shenzhen Construction Investment Holdings and actually controlled by Shenzhen Investment Holdings Co., Ltd, as guarantee for the above commitment.To fulfill the commitment, the Company and Investment Holdings jointly planned to start relevant matters. On 17 Sep. 2010, the Company disclosed Public Notice on Fulfilling Share Merger Reform Commitments and Implementing Significant Assets Replacement (Significant Related Transactions), which was approved at the 1st Special Shareholders’ General Meeting in 2010. For details, please refer to the Company’s Public Notice on Resolutions of the 1st Special Shareholders’ General Meeting in 2010 dated 14 Oct. 2010. In Nov. 2009, Investment Holdings had applied to the China Securities Depository and Clearing Corporation Limited Shenzhen Branch for freezing 30 million shares of the Company that are actually controlled by its and are registered under the name of Construction Holdings; By now, those shares have been unfrozen due to expiration of the freezing period.③ Since non-tradable shares held by Shenzhen Investment Holdings Co., Ltd, Shenzhen Construction Investment Holdings and Shenzhen Investment Co., Ltd acquired right to trade within 24 months, Shenzhen Investment Holdings Co., Ltd commit that they will support balance no less than RMB 500 million with method of entrust loan in line with relevant provisions of laws and administrative statutes to release nervous capital of the Company. The aforesaid balance means accumulative incurred amount within 24 months since the date when non-tradable shares held by Shenzhen Investment Holdings Co., Ltd, Shenzhen Construction Investment Holdings andShenzhen Investment Co., Ltd acquired right to trade, and each entrust loan for support will not be less than 12 months; the above cash support of RMB 500 million excluded entrust loan offered before the date when non-tradable shares held by Shenzhen Investment Holdings Co., Ltd, Shenzhen Construction Investment Holdings and Shenzhen Investment Co., Ltd acquired right to trade.On 18 Mar. 2010, the Company convened the Annual Shareholders’ General Meeting for Y2009, which reviewed and approved the Proposal on Applying Entrusted Loan from Controlling Shareholder. The Shareholders’ General Meeting authorized the Company Board to deal with events including signing of agreement concerning the entrusted loan of no less than RMB 500 million, application of additional loan, loan extension, grant of new loan for repaying old loan, and loan repayment. For details, please refer to the Company’s Public Notice on Resolutions of the Annual Shareholders’ General Meeting for Y2009 dated 19 Mar. 2010. On 28 Dec. 2010, with China Everbright Bank Shenzhen Jingtian Sub-branch as the trustee, Investment Holdings provided entrusted loan of RMB 10 million to the Company’s subsidiary Shenzhen ITC Vehicles Industry Co., Ltd. In the reporting period, Investment Holdings provided entrusted loan of RMB 490 million to the Company.④In case that net profit of the Company in any year of 2010, 2011 and 2012 was less than 2009, Shenzhen Investment Holdings Co., Ltd will make up balance of net profit between the year and 2009 with cash.The implementation of the said commitment depends on the net profit as of year 2011.3.4 Warnings of possible loss or large-margin change of the accumulated net profit made during the period from the beginning of the year to the end of the next reporting period compared with the same period of the last year according to prediction, as well as explanations on the reasons√Applicable □InapplicableBusiness forecast Sharp increase at the same directionItem From the year-begin tothe end of the nextperiodSame period of lastyearIncrease/decrease (%)Estimate of accumulated netprofit (RMB Ten thousand)27,000-32,00012,675Increase of 113%-152% Basic EPS (Yuan/share) 0.4530-0.53690.2127Increase of 113%-152%Explanation on performance forecast Reason for sharp change in business performance: In the reporting period, the PRD·Shenggang No.1 Project constructed by the Company reached the carry-over condition in revenue. The revenue carried over registered a sharp year-on-year increase over the carried-over revenue of PRD·Xinhua Town Project, and the gross profit also hiked.The above forecast is the initial estimate reckoned by the Company in accordance with current sales situation of PRD·Shengang·No.1 Project. For actual profitability of the Company in the 1st half year of 2011, data in Semi-annual Report 2011 shall prevail.3.5 Other significant events need to be explained 3.5.1 Securities investment√Applicable □InapplicableNo. StockvarietyStockcodeShort form ofStockInitialinvestmentamount(RMB Yuan)SharesheldBook value atperiod-endProportionin totalsecuritiesinvestmentatperiod-end(%)Profits andlosses inreporting period1 ShenzhenA Share000030 ST Sunrise 268,735.50 30,000 272,100.00 100.00Other securities investment at the end ofperiodInvestment gains/(losses) arising fromsale of securities———— Total 268,735.50-272,100.00100.00 3.5.2 Equity of other listed companies held by the Company√Applicable □InapplicableStock codeShortform ofStockInitialinvestmentamountRatio toequity ofinvestedcompany(%)Book value atyear-endProfits andlosses in thereporting periodChange ofowners’equity in thereportingperiodAccountingsubjectSource ofstock000509 S*STT.H.2,962,500.00 0.33% 802,199.55 0.00 0.00Long-termequityinvestmentPurchasinglegal personsharesdirectionallyTotal 2,962,500.00-802,199.55 0.00 0.00 3.5.3 Equity of Pre-IPO and unlisted financial enterprises held by the Company□Applicable √Inapplicable3.5.4 Offering capital to controlling shareholders or related parties and external guarantee in violation of the procedure specified□Applicable √Inapplicable3.5.5 Shareholders holding shares exceeding 30% proposed or implemented plan on increasing shares in the reporting period□Applicable √Inapplicable3.5.6 Significant contracts√Applicable □Inapplicable3.5.7 Reception of research, interviews and visits in the reporting periodReception time Reception place Reception way Reception object Major discussion content and the information provided by theCompany27 Jan. 2011 The Office of BOD Communicationby TelephoneIndividualinvestorWhether the Company’s businessperformance in 2010outperformed that of 2009?11 Feb. 2011 The Office of BOD Communicationby TelephoneIndividualinvestorWhether the formalities oftransferring the land of Moon Bayhas been completed?23 Feb. 2011The Office of BODCommunication by TelephoneIndividual investorThe Company’s stock trade suddenly increased at the first 10minutes of early quotation, whether the Company held any non-published significantinformation?10 Mar. 2011The Office of BODCommunication by TelephoneIndividual investorThe price of the Company’ sharesurged to the trade limit in the afternoon, whether the Company held any non-published beneficialinformation?Events after balance sheet date28 Apr. 2011The Office of BODCommunication by TelephoneIndividual investorWill the Company make profit in2011?3.5.8 Explanation on other significant events3.6 Implementation of cash dividends policy during the reporting period□Applicable √Inapplicable§4 Attachment4.1 Balance sheetPrepared by Shenzhen Properties & Resources Development (Group) Ltd.31 Mar. 2011 Unit: RMB YuanClosing balance Opening balanceItemConsolidation Parent company Consolidation Parent companyCurrent assets:Monetary funds 528,671,205.69 8,565,150.25 534,418,695.36 78,920,447.75Settlement fund reserve 272,100.00 272,100.00 272,100.00 272,100.00Notes receivable 300,000.00 300,000.00receivable 75,347,965.47 59,268,760.97 67,935,785.29 59,680,032.75 AccountAdvances to suppliers 391,278,337.28 385,593,863.60 49,360,431.87Dividend receivableOther account receivable 40,613,985.67 492,736,587.33 37,787,880.10 558,839,822.28Financial assets purchasedunder agreements to resellInventories 1,397,577,646.79 56,594,638.32 1,576,183,305.38 56,594,638.32Non-current assets duewithin 1 yearOther current assetsTotal current assets 2,434,061,240.90 1,003,031,100.47 2,266,258,198.00 754,307,041.10Non-current assets:Loans and advanceAvailable for sale financialassetsHeld to maturity investmentsLong-term accountreceivableLong-term equity81,517,424.98 250,927,924.98 81,390,188.20 250,800,688.20 investmentInvestment real estate 298,718,688.01 202,305,208.88 295,584,704.09 205,439,020.58Fixed asset 75,685,768.26 34,953,849.94 78,112,745.51 35,645,685.39Project in constructionEngineering materialFixed asset disposalBearer biological assetOil and gas assetsIntangible assets 104,933,929.43 106,563,665.92Development expenseGoodwillLong-term expense to be2,118,958.74 2,118,958.74 2,162,202.81 2,162,202.81apportionedDeferred income tax assets41,453,082.09 83,209,649.31Other non-current assetsTotal of non-current assets 604,427,851.51 490,305,942.54 647,023,155.84 494,047,596.98Total assets 3,038,489,092.41 1,493,337,043.01 2,913,281,353.84 1,248,354,638.08Current liabilities:Short-term borrowings 500,000,000.00 10,000,000.00Transactional financialliabilitiesNotes payableAccounts payable 94,738,800.87 34,368,872.65 105,465,038.93 34,423,717.0479,725.48 Advances from customers34,766,758.80 878,660,737.46Financial assets sold underagreements to repurchaseHandling charges andcommissions payablePayroll payable 56,506,812.40 10,831,416.57 53,817,405.36 9,636,557.03Taxes and fares payable 499,050,580.15 1,378,685.90195,585,180.87 1,264,740.40Dividend payableInterest payableOther accounts payable 230,079,523.85 757,843,379.57 229,549,997.54 508,763,899.07Non-current liabilities due149,580,000.00 250,960,000.00within 1 yearOther current liabilitiesTotal current liabilities 1,564,722,476.07 804,422,354.69 1,724,038,360.16 554,168,639.02Non-current liabilities:Long-term borrowings 212,000,000.00 212,000,000.00Debentures payableLong-term payablesSpecific-purpose accountpayablesAccrued liabilitiesDeferred income tax807.48 807.48 807.48 807.48 liabilitiesOther non-current101,390,578.98 2,429,164.54 102,194,477.26 2,429,164.54liabilitiesTotal non-current liabilities 313,391,386.46 2,429,972.02 314,195,284.74 2,429,972.02Total liabilities 1,878,113,862.53 806,852,326.71 2,038,233,644.90 556,598,611.04Owner’s equity (orShareholders’ equity)Paid-in capital (or share 595,979,092.00 595,979,092.00 595,979,092.00 595,979,092.00capital)capital 64,020,275.72 38,914,227.99 64,020,275.72 38,914,227.99 ShareLess: Treasury StockSurplus reserve 69,712,050.51 69,712,050.51 69,712,050.51 69,712,050.51General risk provisionRetained earnings 433,566,838.35 -18,120,654.20 148,961,664.40 -12,849,343.46Foreign exchange-3,765,113.76 -4,487,460.75 differenceTotal owners' equity1,159,513,142.82 686,484,716.30 874,185,621.88 691,756,027.04 attributable to holdingcompanyMinority interests 862,087.06 862,087.06 Total owners’ equity 1,160,375,229.88 686,484,716.30 875,047,708.94 691,756,027.04Total liabilities and owners’3,038,489,092.41 1,493,337,043.01 2,913,281,353.84 1,248,354,638.08 equity4.2 Income statementPrepared by Shenzhen Properties & Resources Development (Group) LtdJan. - Mar. 2011 Unit: RMB YuanJan. – Mar. 2011 Jan. – Mar. 2010ItemsConsolidation Parent company Consolidation Parent companyI. Total operating revenue 977,257,810.34 7,942,430.03 83,097,068.04 7,350,856.95 Including: Sales 977,257,810.34 7,942,430.03 83,097,068.04 7,350,856.95 cost 600,949,594.44 13,366,376.25 82,630,360.50 11,720,743.69 operatingII.TotalIncluding: Cost of sales 266,881,637.62 4,793,314.44 56,831,611.01 3,118,742.91Taxes and associate310,352,802.05 1,103,292.48 7,093,878.83 383,666.00 chargesSelling and distribution2,106,306.08 2,205,666.09expensesAdministrative19,894,087.19 7,551,280.30 15,940,013.09 7,175,602.37 expensesFinancial expenses 1,714,761.50 -81,510.97 559,191.48 1,398,155.07 Asset impairment loss-355,422.66Add: Gain/(loss) from35,100.00 35,100.00 change in fair value (“-”means loss)Gain/(loss) from127,236.78 127,236.78 76,353.59 76,353.59 investment (“-” means loss)Including: income forminvestment on affiliated127,236.78 127,236.78 86,447.23 86,447.23 enterprises and jointly-runenterprisesForeign exchange difference。
KONKA GROUP CO., LTD.THE FIRST QUARTERLY REPORT 2010§1. Important Notice1.1 The Board of Directors, the Supervisory Committee, directors,supervisors and senior executives of Konka Group Co., Ltd. (hereinafter referred to as “the Company”) hereby guarantee that this report carries no false information, misleading statements or major omissions, and will accept, individually and collectively, the responsibility for factuality, accuracy and completeness of the information set forth herein.1.2 The Financial Report of this first quarterly report has not beenaudited by a CPA firm.1.3 Mr. Hou Songrong (Chairman of the Board of the Company), Mr. Yang Rong(Chief Financial Officer of the Company) and Mr. Ruan Renzong (Person-in-charge of the accounting agency and the accounting project) hereby confirm that the Financial Report enclosed in this quarterly report is factual and complete.§2. Company Profile2.1 Main accounting data and financial indicatorsUnit: (RMB) Yuan31 Mar. 2010 31 Dec. 2009 Increase/decrease (%) Total assets (Yuan) 14,096,321,494.1213,568,083,128.38 3.89 Owners’ equity attributable toshareholders of listed company (Yuan)3,915,376,179.193,875,367,861.56 1.03 Share capital (share) 1,203,972,704.001,203,972,704.00 0.00 Net assets per share attributable toshareholders of listed company(Yuan/share)3.25 3.22 0.93Jan.-Mar. 2010 Jan.-Mar. 2009 Increase/decrease (%)Total operation income (Yuan) 4,266,791,664.592,611,315,292.67 63.40 Net profit attributable to shareholdersof listed company (Yuan)35,625,229.2740,231,160.32 -11.45 Net cash flows arising from operatingactivities (Yuan)62,308,666.72802,909,498.66 -92.24 Net cash flows per share arising fromoperating activities (Yuan/share)0.0520.667 -92.20 Basic earnings per share (Yuan/share) 0.02960.0334 -11.38 Diluted earnings per share (Yuan/share) 0.02960.0334 -11.38 Weighted average ROE (%) 0.91% 1.05% -0.14Weighted average ROE after deductingnon-recurring gains and losses (%)0.62% 1.00% -0.38Items of non-recurring gains and losses Amount from year-begin to period-endGains from disposal of non-current assets 11,426,375.45 Gains and losses from fair value changes in transactional financial assets andliabilities held by the Company, as well as investment gains from disposingtransactional financial assets and liabilities and financial assets available forsale, except for the effective hedging business related to the Company’s normaloperation995,859.35Other non-business incomes and expenses except for items above 1,873,254.40 Effect on income tax -2,964,813.24 Effect on minority interests -40,432.66Total 11,290,243.30 Explanation on important items of non-recurring gains and losses:The gains from disposal of non-current assets listed under the items of non-recurring gains and losses came from the disposal of fixed assets.2.2 Total number of shareholders at period-end and shareholding of topten shareholders holding shares not subject to trading moratoriumUnit: ShareTotal number of shareholders atperiod-end93,054 Tradable shares held by top ten shareholders holding shares not subject to trading moratoriumName of shareholder (full name)Number of tradable shares notsubject to trading moratorium heldat period-endType of shareHOLY TIME GROUP LIMITED 43,597,200Domestically listed foreignsharesChina Construction Bank—China AdvantageGrowth Stock Fund38,084,907RMB ordinary shares Overseas Chinese Town Group Corporation 30,372,843RMB ordinary sharesGAOLING FUND,L.P. 26,400,625Domestically listed foreignsharesAgricultural Bank of China—PenghuaMotivity Growth Mixed Fund25,276,532RMB ordinary sharesBOCI SECURITIES LIMITED 20,334,459Domestically listed foreignsharesChina Everbright Bank—First-TrustLeading Strategy Open-ended Fund15,692,693RMB ordinary shares Bank of China—Invesco Great Wall DingyiStock Open-ended Fund13,810,081RMB ordinary sharesNOMURA SECURITIES CO.LTD 13,500,000Domestically listed foreignsharesIndustrial and Commercial Bank ofChina—Hua An Mid-cap and Small-capGrowth Stock Fund12,113,097RMB ordinary shares§3. Significant Events3.1 Major changes in main accounting statement items and financialindicators, as well as reasons for such changes√Applicable □InapplicableI. Sales income for the first quarter registered a year-on-year growth63.40%, which was mainly due to the Company’s efforts in developingdistinct fine products and increasing product competitiveness.In the report period, the Company continued and deepened the value operation strategy, strengthened attack consciousness, an open mind and consciousness of reform and innovation, and accelerated the reform of the marketing organization. Meanwhile, it persisted in product innovation, strengthened quality control and developed distinct fine products. As a result, a rapid development took place in main businesses such as the color TV business, the cell phone business and the white electricity business.In terms of the color TV business, the Company seized opportunities brought by the high-speed development of LED TVs and the rapid popularization of Web TV, promoting the Wangrui LED TV brand. It took the lead to popularize LED and Web TV and tried to take up a larger share in the LCD market, which ensured the Company’s leading position in the domestic color TV market.In terms of the cell phone business, the Company made itself a distinct cell phone maker in terms of speed, constantly improved the product structure, expanded channels at home and abroad, and strictly controlled risks so as to further solidify Konka’s position in the domestic cell phone market.In terms of the white electricity business, the Company studied market trends, developed fine products with power conservation as the main line, fashionable appearance, distinct preservation technologies and a high performance cost ratio, and increased the product coverage rate so as to achieve stable development of the white electricity business.II. Due to reasons below, the net profit achieved by the Company in the report period decreased as compared with the same period of 2009.1. In the report period, in order to fight for a larger share in theflat-panel TV market, most domestic and foreign color TV brands reduced their product prices, which led to an enormously fierce price competition in the flat-panel TV market. As a result, the gross profit rate of theCompany ’s flat-panel TVs decreased considerably from that at the same period of last year.2. In order to promote the Company ’s brand influence in the flat-panel TV market and fight for a large market share, expenses on market expansion increased to some degree.3. Progress of new product development slowed down, which had certain impact on the profitability of color TV products in the report period. Due to the aforesaid factors, the net profit attributable to owners of the parent company achieved by the Company in the first quarter of 2010 went down as 11.45%compared with the same period of last year.III. Non-business income increased by 310.49% from that at the same period of last year, which was mainly due to incomes from fixed asset disposal and penalties.IV. Selling expenses increased by 49.74% from that at the same period of last year, which was mainly because expenses on market expansion increased to some degree in order to fight for a larger share in the flat-panel TV market.V. Cash flows from operating activities decreased by 92.24% from that at the same period of last year, which was mainly due to much fewer discounts of notes receivable this year.3.2 Explanation and analysis on progress of significant events, as well as relevant influence and solutions □Applicable √Inapplicable3.3 Fulfillment of commitments made by the Company, shareholders and actual controller√Applicable □InapplicableCommitmentCovenanterContents of commitmentsExecutionCommitmentsconcerning sharemerger reformOCT Group Corporation (1)To promise that all non-tradable shares of KONKA GROUP CO.,LTD held by it will not be listed for trading or transferring within24 months since the date when it acquires the right to list in Ashare market. (2) At the expiration of the aforesaid commitmentperiod, the original non-tradable shares of KONKA GROUP CO., LTDsold through listing at Stock Exchange shall take up less than 5%of total shares of KONKA GROUP CO., LTD within 12 months, and lessthan 10% within 24 months. Up to now, therewas no sharesubject to moratorium listed for trading ortransferring.Commitments concerning share trading moratoriumNaught Naught NaughtCommitments made in the purchase report or theNaught Naught Naughtreport on equitychangesCommitments madein major assetsreorganizationNaught Naught NaughtCommitments madein stock issuanceNaught Naught NaughtOther commitments(includingsupplementarycommitments)Naught Naught Naught3.4 Warnings of possible losses or significant changes of the accumulativenet profit during the period from the year-begin to the end of the nextreporting period compared with the same period of last year according toprediction, as well as explanations on the reasons□Applicable √Inapplicable3.5 Other significant events3.5.1 Securities Investment□Applicable √Inapplicable3.5.2 Reception of research, communication and visits in the reportingperiodDate PlaceWay ofcommunicationVisitors Topics discussed and materials provided5 Jan. 2010 Meeting room ofthe CompanyFieldresearchGuosen Securities, YinhuaFund Management Co., Ltdand Caitong SecuritiesBrokerage Co., LtdCore competitive power, completive status of LCDTV products and the Company’s status in color TVindustry8 Jan. 2010 Meeting room ofthe CompanyFieldresearchDonghai Securities andSinosafe General InsuranceCo.LtdDevelopment strategy of the Company’s color TVbusiness new products of LCD TV and completivestatus of LCD TV products13 Jan. 2010 Meeting room ofthe CompanyFieldresearchInvesco Great Wall FundManagement Co., Ltd,Morgan Stanley HuaxinFundsStatus quo and development trend of color TVindustry the Company’s status in color TVindustry and completive status of LCD TV products20 Jan. 2010 Meeting room ofthe CompanyFieldresearchEssence Securitiesdevelopment trend of mobile phone of the Company,market prospect of new products of color TV andprogress of relevant work26 Jan. 2010 Meeting room ofthe CompanyFieldresearchXiangcai Securities Co.,LtdInvestment in LCD module projects, basic situationof color TV, mobile phone and white electricity27 Jan. 2010 Meeting room of Field Central China Securities Particulars about putting into production of LCDthe Company researchmodule, development trend of color TV industry19 Mar. 2010Meeting room of the CompanyField researchGuotai Junan SecuritiesCo., Ltd, Bosera Fund, Lion Fund Management Co., Ltd, Penghua Funds and Changrun Asset ManagementCore competitive power of the Company and sales of products for “Pushing home appliances to countryside ”22 Mar. 2010Meeting room of the CompanyField researchBank of China Investment ManagementParticulars about putting into production of LCDmodule, competitive strategy of color TV25 Mar. 2010Meeting room of the CompanyField researchBank of Communications Schroder Fund Management Co., LtdParticulars about color TV and mobile phone business of the Company, market competitive powerof color TV of the Company30 Mar. 2010Meeting room of the CompanyField researchChina Asset Management Co., LtdDevelopment trend of color TV industry, marketcompetitive power of color TV of the Company,market prospect of new products of color TV and progress of relevant work3.5.3 Other significant events □Applicable √Inapplicable3.5.3 Other significant events √Applicable □InapplicableAnalysis on risks and controlmeasures of derivative products heldin the report period (including butnot limited to market risk, liquidityrisk, credit risk, operation risk,law risk, etc.)When the Company operated every NDF portfolio, yield to maturity is fixed and there is no risk.Main risks of NDF portfolio are as follows:1. Risk from closing of bank pledged deposit, in case the bank close downs,the pledged deposit is probably hard to call back in full.2. Risk from foreign bank operated NDF portfolio being closed. In case theforeign bank closes down, it is not possible to receive income from NDFportfolio.The Company always chooses large-sized bank similar as Bank of China tocooperate to start NDF portfolio. Theses banks chosen by the Company operatedstably and healthily with good assets and credit, the probability of closing was small. It is basically out of consideration of loss from closing brought to the CompanyChanges of market prices or fair values in the report period of theinvested derivatives. And the analysis on the fair value of the derivatives should include the specific use methods and the relevant assumptions and parameters.Yield to maturity of NDF portfolio business operated by the Company is fixed and there is no change in fair value. Whether significant changes occurred to the Company ’s accounting policy Up to the public notice date, there is no special accounting method for NDF portfolio business and accounting principle was in accordance with Accountingand specific accounting principles of derivatives in the report period compared to the previous report periodStandards for Business Enterprises. Specific opinion from independent directors, sponsors or financialconsultants on the Company ’s derivatives investment and risk controlIndependent directors of the Company considered that NDF portfolio business is good for benefit from fluctuation of rate of RMB and get fixed income without risks, so it is necessary at some certain. The Company is gradually perfecting internal control for investment on derivative products, and it is feasible to adopted directed measures for risk control.3.6.1 Holding of derivative products at the period-end √Applicable □InapplicableUnit: RMB YuanTypeBeginning contract amountClosing contractamountGains and losses in the reportperiod Proportion of closing contract amount in net assets at theperiod-endNDF portfolio 2,584,356,800.00 3,011,823,650.00746,924.6276.92%Total 2,584,356,800.00 3,011,823,650.00746,924.6276.92%§4. Appendix4.1 Balance sheetPrepared by Konka Group Co., Ltd 31 Mar. 2010 Unit: RMB YuanBalance at period-endBalance at year-beginItemsConsolidationParent companyConsolidationParent companyCurrent assets:Monetary funds3,838,408,501.633,127,207,462.433,624,480,380.25 2,920,787,369.99Settlement fund reserve Dismantle fundTransaction financial asset 4,658,494.003,766,384.003,673,164.00 2,781,054.00Notes receivable 2,787,764,593.032,555,446,445.152,807,539,700.27 2,679,933,632.86Account receivable 1,180,276,713.821,067,220,743.611,302,066,597.13 1,105,121,784.81Account paid in advance 164,399,256.07337,239,333.81275,850,813.27 259,306,577.60Premium receivables Receivables from reinsurersReinsurance contract reserve receivablesInterest receivable 29,249,452.4926,713,017.1032,529,920.96 29,442,469.13Dividend receivableOther account receivable66,891,681.95999,832,977.4119,572,445.66 863,563,519.29Financial assets purchased under agreements toresellInventories4,109,056,447.723,429,165,467.263,580,780,457.01 2,880,442,228.65Non-current assets due within 1 yearOther current assetsTotal current assets 12,180,705,140.7111,546,591,830.7711,646,493,478.55 10,741,378,636.33 Non-current assets:Loans and advanceAvailable for sale financial assets 10,018,505.0010,018,505.0010,268,121.10 10,268,121.10 Held to maturity investmentsLong-term account receivableLong-term equity investment 57,800,445.231,288,602,169.8757,800,445.23 1,278,602,169.87 Investing propertyFixed asset 1,409,437,275.01378,437,034.791,433,674,626.29 397,886,724.19 Project in construction 83,446,872.0449,619,658.1061,087,946.18 35,542,625.38 Engineering materialFixed asset disposal 21,042,047.4120,851,110.89Bearer biological assetOil assetsIntangible assets 166,427,145.6118,441,453.87167,502,525.56 18,952,170.77 Development expenseGoodwill 3,943,671.533,943,671.53Long-term expense to be apportioned 14,279,429.365,549,052.2115,774,783.95 6,011,778.39 Deferred tax assets 149,220,962.22137,945,439.24150,686,419.10 139,410,896.12 Other non-current assetsTotal of non-current assets 1,915,616,353.411,888,613,313.081,921,589,649.83 1,886,674,485.82 Total assets 14,096,321,494.1213,435,205,143.8513,568,083,128.38 12,628,053,122.15 Current liabilities:Short-term loans 3,056,658,224.672,776,008,050.002,770,014,060.00 2,553,412,550.00 Loans from central bankDeposits received and hold for othersPlacements From Banks Other FinancialInstitutionsTransaction financial liabilitiesNotes payable 2,506,742,833.772,159,660,615.292,884,697,072.42 2,546,131,169.12 Account payable 2,100,806,864.122,246,395,884.842,599,242,285.04 2,490,629,061.71 Account received in advance 279,382,654.4595,148,340.36279,331,464.38 162,177,552.53 Financial assets sold under agreements torepurchaseHandling charges and commission payableEmployee’s compensation payable 155,020,093.8073,578,603.13193,217,075.52 94,499,554.84 Tax payable -221,591,278.82-160,532,915.20-132,897,711.14 -74,701,335.32 Interest payable 21,768,518.8219,810,821.9623,633,016.78 21,675,319.92 Dividend payable 804,527.20804,527.20Other account payable 1,955,812,041.772,342,598,278.21763,923,600.66 940,384,863.17 Due to reinsurersInsurance contract reserveCustomer depositsAmount payables under security underwritingNon-current liabilities due within 1 yearOther current liabilitiesTotal current liabilities 9,855,404,479.789,552,667,678.599,381,965,390.86 8,734,208,735.97Non-current liabilities:Long-term borrowingsBonds payableLong-term payablesSpecific purpose account payablesEstimated liabilitiesDeferred tax liabilities 1,308,715.59611,831.881,308,715.59 611,831.88Other non-current liabilities 89,141,048.4862,205,048.4878,541,048.48 62,205,048.48Total non-current liabilities 90,449,764.0762,816,880.3679,849,764.07 62,816,880.36Total liabilities 9,945,854,243.859,615,484,558.959,461,815,154.93 8,797,025,616.33Owner’s equity (or shareholders’ equity):Paid-in capital (or share capital) 1,203,972,704.001,203,972,704.001,203,972,704.00 1,203,972,704.00Capital surplus 1,257,329,860.221,249,199,693.641,257,449,727.58 1,249,319,561.00Less: Treasury stockSpecific reserveReserved fund 809,307,995.80804,258,523.06809,307,995.80 809,307,995.80General risk provisionRetained earnings 649,404,128.11562,289,664.20613,778,898.84 568,427,245.02Foreign exchange difference -4,638,508.94-9,141,464.66Total owners’ equity attributable to holding3,915,376,179.193,819,720,584.903,875,367,861.56 3,831,027,505.82 companyMinority interest 235,091,071.08230,900,111.89Total owner’s equity 4,150,467,250.273,819,720,584.904,106,267,973.45 3,831,027,505.82Total liabilities and owner’s equity 14,096,321,494.1213,435,205,143.8513,568,083,128.38 12,628,053,122.154.2 Income statementPrepared by Konka Group Co., Ltd Jan.-Mar. 2010 Unit: RMB YuanAmount in this period Amount in the previous period ItemsConsolidation Parent company Consolidation Parent companyI. Total sales 4,266,791,664.594,057,208,187.952,611,315,292.67 2,215,990,440.32Including: Sales 4,266,791,664.594,057,208,187.952,611,315,292.67 2,215,990,440.32Interests incomePremium incomeHandling charges and commission incomeII. Total cost of sales 4,230,971,313.374,079,360,937.602,573,658,346.25 2,193,140,792.45Including: Cost of sales 3,631,933,127.273,605,806,531.862,156,286,288.52 1,855,513,841.46Interests expensesService charge and commission incomeCash surrender valueClaim expenses-netProvision for insurance contract reserves-netInsurance policy dividend paidReinsurance expenseBusiness taxes and surcharges 930,892.10224,064.47335,691.09 32,243.60Distribution expenses 460,555,582.14387,981,203.70307,567,109.71 267,162,582.20Administrative expenses 121,238,958.2372,609,369.19100,666,366.22 65,200,389.93Financial costs 22,162,244.2119,554,612.1112,951,059.59 9,783,944.26Impairment loss -5,849,490.58-6,814,843.73-4,148,168.88 -4,552,209.00Add: gain/(loss) from change in fair value985,330.00985,330.00(“-” means loss)Gain/(loss) from investment (“-” means loss) 10,529.3510,529.35Including: income form investment on affiliatedenterprise and jointly enterpriseForeign exchange difference (“-” means loss)III. Business profit (“-” means loss) 36,816,210.57-21,156,890.3037,656,946.42 22,849,647.87Add: non-business income 15,621,101.4713,303,772.473,805,441.94 1,776,910.89Less: non-business expense 2,321,471.62339,448.58817,792.05 475,236.05Including: loss from non-current asset disposal 1,704,521.45112,753.59366,211.13 204,163.93IV. Total profit (“-” means loss) 50,115,840.42-8,192,566.4140,644,596.31 24,151,322.71Less: Tax expense 10,299,651.962,994,487.154,062,155.42 1,040,906.12V. Net profit (“-” means loss) 39,816,188.46-11,187,053.5636,582,440.89 23,110,416.59-Attributable to parent company 35,625,229.27-11,187,053.5640,231,160.32 23,110,416.59-Minority interest 4,190,959.19-3,648,719.43VI. Earnings per share(I) Basic earnings per share 0.0296-0.00930.0334 0.1934(II) Diluted earnings per share 0.0296-0.00930.0334 0.1934Ⅶ. Other comprehensive income 4,383,088.36 -119,867.36 325,965.11 0.00Ⅷ. Total comprehensive income 44,199,276.82 -11,306,920.92 36,908,406.00 23,110,416.59Attributable to owners of parent company 40,008,317.63 -11,306,920.92 40,557,125.43 23,110,416.59Attributable to minority shareholders 4,190,959.19 0.00 -3,648,719.43 0.004.3 Cash flow statementPrepared by Konka Group Co., Ltd Jan.-Mar. 2010 Unit: RMB YuanAmount in this period Amount in the previous period ItemsConsolidation Parent company Consolidation Parent companyI. Cash flows from operating activitiesCash received from sales of goods or rending4,720,978,879.593,968,062,175.853,776,653,886.48 3,235,207,703.10 of servicesNet increase of deposits received and held forothersNet increase of loans from central bankNet increase of inter-bank loans from otherfinancial assetsCash received against original insurancecontractNet Cash received from reinsuranceNet increase of client deposit and investmentNet increase of disposal of tradable financialassetsCash received as Interests, fees andcommissions receivedNet increase of inter-bank fund receivedCash received under repurchasing, netTax returned 65,799,521.849,037,696.2618,717,923.13 8,178,612.00Other cash received from operating activities 98,402,884.47241,162,937.1793,669,493.85 24,642,501.83Sub-total of cash inflow from operating4,885,181,285.904,218,262,809.283,889,041,303.46 3,268,028,816.93 activitiesCash paid for goods and services 3,753,815,185.013,410,254,933.722,317,602,968.35 2,183,739,659.17Net increase of loans and advancesNet increase of deposit in central bank, banksand other financial institutionsCash paid for original contract claimCash paid for interests, fees and commissionCash paid for policy dividendCash paid to and for employees 303,976,986.43171,755,451.45250,408,626.70 152,092,114.26Cash paid for all types of taxes 439,190,665.59352,953,464.00294,783,090.76 248,019,254.34Other cash paid relating to operating325,889,782.15290,804,472.03223,337,118.99 162,218,767.69 activitiesSub-total of cash outflows 4,822,872,619.184,225,768,321.203,086,131,804.80 2,746,069,795.46Net cash outflow in operating activities 62,308,666.72-7,505,511.92802,909,498.66 521,959,021.47II. Cash Flows from Investing ActivitiesCash received from return of investments 95,940.0095,940.00Cash received from investment income 10,529.3510,529.35Net cash received from disposal of fixedassets, intangible assets and other long-term22,271,191.5420,731,311.541,908,031.60 1,115,630.21 assetsNet cash received from disposal ofsubsidiaries and other operating unitsOther cash received relating to investing13,640,000.00activitiesSub-total of cash inflows of investing36,017,660.8920,837,780.891,908,031.60 1,115,630.21 activitiesCash paid for acquisition of fixed assets,53,138,753.6216,682,803.3861,725,365.97 624,304.48 intangible assets and other long-term assetsCash paid for acquisition of investments 10,000,000.00Net increase of pledge loansNet cash paid for acquisition of subsidiariesand other operating unitsOther cash paid relating to investingactivitiesSub-total of cash outflows of investing53,138,753.6226,682,803.3861,725,365.97 624,304.48 activitiesNet cash inflow from investing activities -17,121,092.73-5,845,022.49-59,817,334.37 491,325.73III. Cash Flows from Financing Activities:Cash received from investmentIncluding: Cash received from minorityshareholders of subsidiariesCash received from borrowings 453,343,192.74376,230,000.003,000,000.00Cash received from bonds issuingCash received relating to financing50,710,818.4750,680,356.17938,373,800.28 901,296,005.42 activitiesSub-total of cash inflows of financing504,054,011.21426,910,356.17941,373,800.28 901,296,005.42 activitiesCash paid for repayments of borrowings 76,033,174.1034,206,000.00211,509,922.39 199,775,772.34Cash paid for dividends, profit distribution1,173,792.711,139,872.983,597,978.03 8,340.00 or interestIncluding: dividends or profits paid tominority shareholders by subsidiariesOther cash paid relating to financing396,763,432.50376,230,000.00709,534,561.56 709,533,838.65 activitiesSub-total of cash outflows of financing473,970,399.31411,575,872.98924,642,461.98 909,317,950.99 activitiesNet cash inflow from financing activities 30,083,611.9015,334,483.1916,731,338.30 -8,021,945.57IV. Effect of foreign exchange rate changes -2,546,700.56-2,665,106.35-171,373.86V. Net decrease in cash and cash equivalents 72,724,485.33-681,157.57759,652,128.73 514,428,401.63Add : Opening amount of cash and cash749,501,416.29341,440,119.99845,026,867.06 358,631,499.14 equivalentsVI. Closing balance of cash and cash equivalents 822,225,901.62340,758,962.421,604,678,995.79 873,059,900.774.4 Auditor’s reportAudit opinion: Un-auditedBoard of Directors ofKonka Group Co., LtdApr. 30, 2010。