Heterogeneity, Group Size and Collective Action
- 格式:pdf
- 大小:311.73 KB
- 文档页数:28

Meta分析中的异质性评价What is heterogeneity? Variation or differences•Meta分析中异质性分类三类•Clinical•Methodological•StatisticalClinical diversity•participants•e.g. condition, age, gender, location, study eligibility criteria •interventions•intensity/dose, duration, delivery, additional components,experience of practitioners, control (placebo, none,standard care)•outcomes•follow‐up duration, ways of measuring, definition of anevent, cut‐off pointsMethodological diversity•design•e.g. randomised vs non‐randomised, crossover vs parallel,individual vs cluster randomised•conduct•e.g. risk of bias (allocation concealment, blinding, etc.),approach to analysisStatistical heterogeneity•there will always be some random (sampling) variation between the results of different studies •heterogeneity is variation between the effects beingevaluated in the different studies•caused by clinical and methodological diversity•alternative to homogeneity (identical true effects underlyingevery study)•study results will be more different from each other than ifrandom variation is the only reason for the differencesbetween the estimated intervention effectsHow to detect the heterogeneity?I 2统计量I 2统计量是描述由研究间变异占总变异的百分比,计算公式为:⎪⎩⎪⎨⎧≤>-=dfQ df Q Qdf Q I 如果如果02其中,Q 为I 2统计量,df 是它的自由度(即研究总数-1)‐Fixed‐effect vs.random‐effects•Two models for meta‐analysis available in RevMan& Stata software•Make different assumptions about heterogeneity •Pre‐specify your planned approach in your protocolFixed ‐effect model•Assumes all studies are measuring the same treatment effect•Estimates that one effect •If not for random (sampling) error, all results would be identicalCommon Random (sampling)errortrue effectStudy resultSource: Julian HigginsRandom ‐effects model•Assumes the treatment effect varies between studies•Estimates the mean of the distribution of effects •Weighted for both within ‐study (SE) and between ‐study variation (tau 2, 2)Random errorStudy-specific effectMean of true effectsSource: Julian HigginsNo heterogeneityAdapted from Ohlsson A, Aher SM. Early erythropoietin for preventing red blood cell transfusion in preterm and/or low birth weight infants. Cochrane Database of Systematic Reviews 2006, Issue 3.FixedRandomSome heterogeneityFixed RandomAdapted from Adams CE, Awad G, Rathbone J, Thornley B. Chlorpromazine versusplacebo for schizophrenia. Cochrane Database of Systematic Reviews2007, Issue 2.Small study effectsFixed RandomAdapted from Li J, Zhang Q, Zhang M, Egger M. Intravenous magnesium for acutemyocardial infarction. Cochrane Database of Systematic Reviews 2007, Issue 2.Which to choose?•Plan your approach at the protocol stage•Do you expect your results to be very diverse?•Consider the underlying assumptions of the model •fixed‐effects•may be unrealistic –ignores heterogeneity•random‐effects•allows for heterogeneity•estimate of distribution of studies may not be accurate if biasesare present, few studies or few eventsIdentifying heterogeneity•Visual inspection of the forest plots •chi‐squared (c2) test (Q test)•I2statistic to quantify heterogeneityVisual inspectionForest plot A Forest plot BThe chi‐squared (c2) test•Tests the null hypothesis of homogeneity•low power with few studies•may detect clinically unimportant differences with manystudies•narrow question (yes/no) not useful if heterogeneity isinevitable•Calculated automatically by RevManThe I2statistic•I2statistic describes the percentage of variability due to heterogeneity rather than chance(0% to 100%)•low values indicate no, or little, heterogeneity•high values indicate a lot of heterogeneity •Calculated automatically by RevMan•Be cautious in interpretingThe I2statisticchi2= 29.55 df= 13 P = 0.0055 chi2= 6.14 df= 3 P = 0.11I2= 56% I2= 51%Source: Julian HigginsWhat to do about heterogeneity •check that the data are correct•consider in your interpretation•especially if the direction of effect varies•if heterogeneity is very high•interpret fixed‐effect results with caution•consider sensitivity analysis –would random‐effects have made animportant difference?•may choose not to meta‐analyse•average result may be meaningless in practice•consider clinical & methodological comparability of studies •avoid•changing your effect measure or analysis model•excluding outlying studies•explore heterogeneityExploring your results•what factors appear to modify the effect?•clinical diversity (population, interventions, outcomes)•methodological diversity (study design, risk of bias)•plan your strategy in your protocol•identify a limited number of important factors to investigate •have a scientific rationale for each factor chosen•declare any post‐hoc investigationsTwo methods available•subgroup analysis•Group studies by pre‐specified factors•look for differences in results and heterogeneity•meta‐regression•examine interaction with categorical and continuous variables •not available in RevManProceed with caution•results are observational, not randomised•be wary of multiple and post hoc comparisons •may not be useful with few studies•may not be able to investigate aggregate data •look for confounding factors•follow the plan specified in the protocol without over‐emphasising particular findingsResults are rarely definitiveInterpreting subgroup analyses•look at results and heterogeneity within subgroups •are the subgroups genuinely different?•if only 2 subgroups –do the confidence intervals overlap?•statistical tests for subgroup difference•can be more confident about:•pre‐specified analyses•within‐study analyses•effect is clinically plausible and supported by indirect evidence •effect is clinically important and will alter recommendationsParticipant subgroupsBased on Stead LF, Perera R, Bullen C, Mant D, Lancaster T. Nicotine replacement therapy for smoking cessation. Cochrane Database of Systematic Reviews 2008, Issue 1. Art. No.: CD000146. DOI: 10.1002/14651858.CD000146.pub3.Intervention subgroupsSensitivity analysis•not the same as subgroup analysis•testing the impact of decisions made during the review •inclusion of studies in the review•definition of low risk of bias•choice of effect measure•assumptions about missing data•cut‐off points for dichotomised ordinal scales•correlation coefficients•repeat analysis using an alternative method orassumption•don’t present multiple forest plots –just report the results•if difference is minimal, can be more confident of conclusions •if difference is large, interpret results with cautionWhat to include in your protocol •Assessment of heterogeneity•assessment of comparability of studies before meta‐analysis •visual inspection and use of statistics such as I2•Data synthesis•fixed‐effect or random‐effects model (or both)•Subgroup analyses and investigation of heterogeneity •planned subgroup analyses•any other strategies for investigating heterogeneityTake home message•statistical heterogeneity is the presence of differencesbetween estimated intervention effects greater than expected because of random (sampling) variation alone•it can be caused by clinical and methodological diversity•fixed and random‐effects models make different assumptions about heterogeneity•explore any heterogeneity you findStata进行异质性评价Stata进行异质性评价•图示法•拉贝图(labbe)•Galbraith星状图(galbr)•定量判断•亚组分析•Meta回归(metareg)•hetredL’Abbe图•拉贝图是以每项研究中的干预组事件发生率相对于对照组事件发生率作图,若研究间同质,则所有点呈直线分布,或者说不能偏离效应线太远•具有主观性,偏离多远算远?•以例5_数据为例•首先执行metan命令,计算合并效应量metan ntdeath ntalive ncdeath ncalive, label(namevar=study, yearvar=year) random or nograph•绘制拉贝图labbe ntdeath ntalive ncdeath ncalive, percent null or(0.851)Galbraith星状图•Galbraith星状图是以标准化估计值(如logor/lnrr)相对于其标准误的倒数作图,若散点斜率较为接近则说明研究间同质•主观性较大•以例5_数据为例•首先执行metan命令,计算合并效应量,生成中间变量_ES, _selogESmetan ntdeath ntalive ncdeath ncalive, label(namevar=study, yearvar=year) random or nograph•计算logor,selogorgen logor=log(_ES)gen selogor=_selogES•绘制Galbraith星状图galbr logor selogorStata实现亚组分析•亚组分析是探索异质性来源的一个重要方法•如何确定亚组?需要从专业角度寻找•应避免过度的亚组分析•合理的亚组分析应该在研究的设计阶段就确定,写在研究方案中•以例6_数据为例命令语句•metan a b c d, label(namevar=authors, yearvar=year) by(lati_grp)random rr counts group1(experiment)group2(control) xlabel(0.03,1,5) force texts(140) boxsca(60)结果。

Package‘metapower’October13,2022Type PackageTitle Power Analysis for Meta-AnalysisVersion0.2.2DescriptionA simple and effective tool for computing and visualizing statistical power for meta-analysis,including power analysis of main effects(Jackson&Turner,2017)<doi:10.1002/jrsm.1240>, test of homogeneity(Pigott,2012)<doi:10.1007/978-1-4614-2278-5>,subgroup analysis,and categorical moderator analysis(Hedges&Pigott,2004)<doi:10.1037/1082-989X.9.4.426>. Depends R(>=3.6)License GPL-2Encoding UTF-8LazyData trueImports cowplot(>=1.0.0),dplyr(>=0.8.5),ggplot2(>=3.3.0),knitr(>=1.28),magrittr(>=1.5),tidyr(>=1.0.2),testthat(>=2.3.2),rlang(>=0.4.5)Suggests rmarkdown(>=2.1)VignetteBuilder knitrRoxygenNote7.1.1NeedsCompilation noAuthor Jason Griffin[aut,cre]Maintainer Jason Griffin<*************************>Repository CRANDate/Publication2021-02-0813:20:02UTCR topics documented:homogen_power (2)mod_power (3)mpower (4)plot_homogen_power (6)12homogen_power plot_mod_power (6)plot_mpower (7)plot_subgroup_power (7)subgroup_power (8)Index10 homogen_power Compute Power for Test of Homogeneity in Meta-analysisDescriptionCompute statistical power for the Test of Homogeneity for meta-analysis under bothfixed-and random-effects models.Usagehomogen_power(effect_size,study_size,k,i2,es_type,p=0.05,con_table=NULL)Argumentseffect_size Numerical value of effect size.study_size Numerical value for number number of participants(per study).k Numerical value for total number of studies.i2Numerical value for Heterogeneity estimate(i^2).es_type’Character reflecting effect size metric:’r’,’d’,or’or’.p Numerical value for significance level(Type I error probability).con_table(Optional)Numerical values for2x2contingency table as a vector in the follow-ing format:c(a,b,c,d).2x2Table Group1Group2Present a bNot Present c dmod_power3 ValueEstimated Power to detect differences in homogeneity of effect sizes forfixed-and random-effects modelsReferencesBorenstein,M.,Hedges,L.V.,Higgins,J.P.T.and Rothstein,H.R.(2009).Introduction to meta-analysis,Chichester,UK:Wiley.Hedges,L.,Pigott,T.(2004).The Power of Statistical Tests for Moderators in Meta-Analysis, Psychological Methods,9(4),426-445.doi:https:///10.1037/1082-989x.9.4.426Pigott,T.(2012).Advances in Meta-Analysis.doi:https:///10.1007/978-1-4614-2278-5See Alsohttps://jason-griffin.shinyapps.io/shiny_metapower/Exampleshomogen_power(effect_size=.5,study_size=10,k=10,i2=.50,es_type="d") mod_power Compute Power for Categorical Moderator Analysis in Meta-analysisDescriptionComputes statistical power for categorical moderator analysis underfixed and random effects mod-els.Usagemod_power(n_groups,effect_sizes,study_size,k,i2,es_type,p=0.05,con_table=NULL)Argumentsn_groups Numerical value for the levels of a categorical variable.effect_sizes Numerical values for effect sizes of for each group.study_size Numerical value for number of participants(per study).k Numerical value for total number of studies.i2Numerical value for Heterogeneity estimate(i^2).es_type Character reflecting effect size metric:’r’,’d’,or’or’.p Numerical value for significance level(Type I error probability).con_table(Optional)List of numerical values for2x2contingency tables as a vector in the following format:c(a,b,c,d).These should be specified for each group(i.e.,n_groups).2x2Table Group1Group2Present a bNot Present c dValueEstimated Power estimates for moderator analysis underfixed-and random-effects modelsSee Alsohttps://jason-griffin.shinyapps.io/shiny_metapower/Examplesmod_power(n_groups=2,effect_sizes=c(.1,.5),study_size=20,k=10,i2=.50,es_type="d")mod_power(n_groups=2,con_table=list(g1=c(6,5,4,5),g2=c(8,5,2,5)),study_size=40,k=20,i2=.50,es_type="or")mpower Compute Power for Meta-analysisDescriptionComputes statistical power for summary effect sizes in meta-analysis.Usagempower(effect_size,study_size,k,i2,es_type,test_type="two-tailed",p=0.05,con_table=NULL)Argumentseffect_size Numerical value of effect size.study_size Numerical value for number number of participants(per study).k Numerical value for total number of studies.i2Numerical value for Heterogeneity estimate(i^2).es_type Character reflecting effect size metric:’r’,’d’,or’or’.test_type Character value reflecting test type:("two-tailed"or"one-tailed").p Numerical value for significance level(Type I error probability).con_table(Optional)Numerical values for2x2contingency table as a vector in the follow-ing format:c(a,b,c,d).2x2Table Group1Group2Present a bNot Present c dValueEstimated PowerReferencesBorenstein,M.,Hedges,L.V.,Higgins,J.P.T.and Rothstein,H.R.(2009).Introduction to meta-analysis,Chichester,UK:Wiley.Hedges,L.,Pigott,T.(2004).The Power of Statistical Tests for Moderators in Meta-Analysis, Psychological Methods,9(4),426-445doi:https:///10.1037/1082-989x.9.4.426Pigott,T.(2012).Advances in Meta-Analysis.doi:https:///10.1007/978-1-4614-2278-5 Jackson,D.,Turner,R.(2017).Power analysis for random-effects meta-analysis,Research Synthe-sis Methods,8(3),290-302doi:https:///10.1002/jrsm.1240See Alsohttps://jason-griffin.shinyapps.io/shiny_metapower/Examplesmpower(effect_size=.2,study_size=10,k=10,i2=.5,es_type="d")plot_homogen_power Plot Power Curve for Test of HomogeneityDescriptionPlots power curves for the test of homogeneity for different levels of within-study variation for fixed effects models.For random-effects models,power curves are plotted for various levels of heterogeneity.Usageplot_homogen_power(obj)Argumentsobj should be an"homogen_power"objectValuePower curve plot for the user specified input parametersplot_mod_power Plot Power Curve for Categorical ModeratorsDescriptionPlots power curves for categorical moderator in meta-analysisUsageplot_mod_power(obj)Argumentsobj This should be an’mod_power’objectValuePower curves for moderator analysis underfixed and random effects modelsplot_mpower Plot Power Curve for Meta-analysisDescriptionPlots power curves forfixed effects models with various effect size magnitudes.Also plots power curves for various levels of heterogeneity(e.g.,i2=75Usageplot_mpower(obj)Argumentsobj This should be an"mpower"objectValuePower curve plot for the user specified input parametersplot_subgroup_power Plot Power Curve for Subgroup analysisDescriptionPlots power curves to detect subgroup differences in meta-analysis.Usageplot_subgroup_power(obj)Argumentsobj This should be an’subgroup_power’objectValuePower curves to detect subgroup differences forfixed and random effects modelssubgroup_power Compute Power for Subgroup Analysis in Meta-analysisDescriptionComputes statistical power for different subgroups underfixed and random effects models. Usagesubgroup_power(n_groups,effect_sizes,study_size,k,i2=0.5,es_type,p=0.05,con_table=NULL)Argumentsn_groups Numerical value for the number of subgroups.effect_sizes Numerical values for effect sizes of for each group.study_size Numerical value for number of participants(per study).k Numerical value for total number of studies.i2Numerical value for Heterogeneity estimate(i^2).es_type Character reflecting effect size metric:’r’,’d’,or’or’.p Numerical value for significance level(Type I error probability).con_table(Optional)List of numerical values for2x2contingency tables as a vector in the following format:c(a,b,c,d).These should be specified for each subgroup(i.e.,n_groups).2x2Table Group1Group2Present a bNot Present c dValueEstimated Power estimates for subgroup differences underfixed-and random-effects modelsSee Alsohttps://jason-griffin.shinyapps.io/shiny_metapower/Examplessubgroup_power(n_groups=2,effect_sizes=c(.1,.5),study_size=20,k=10,i2=.5,es_type="d")subgroup_power(n_groups=2,con_table=list(g1=c(6,5,4,5),g2=c(8,5,2,5)),study_size=40,k=20,i2=.5,es_type="or")Indexhomogen_power,2mod_power,3mpower,4plot_homogen_power,6plot_mod_power,6plot_mpower,7plot_subgroup_power,7subgroup_power,810。


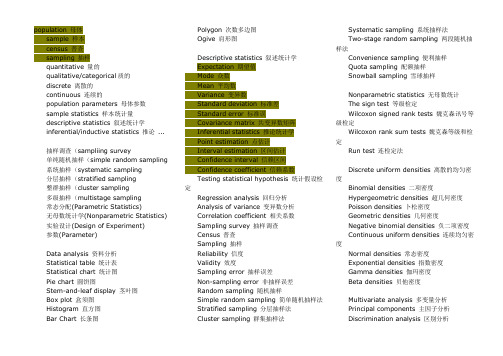
population 母体sample 样本census 普查sampling 抽样quantitative 量的qualitative/categorical质的discrete 离散的continuous 连续的population parameters 母体参数sample statistics 样本统计量descriptive statistics 叙述统计学inferential/inductive statistics 推论 ...抽样调查(sampliing survey单纯随机抽样(simple random sampling 系统抽样(systematic sampling分层抽样(stratified sampling整群抽样(cluster sampling多级抽样(multistage sampling常态分配(Parametric Statistics)无母数统计学(Nonparametric Statistics) 实验设计(Design of Experiment)参数(Parameter)Data analysis 资料分析Statistical table 统计表Statistical chart 统计图Pie chart 圆饼图Stem-and-leaf display 茎叶图Box plot 盒须图Histogram 直方图Bar Chart 长条图Polygon 次数多边图Ogive 肩形图Descriptive statistics 叙述统计学Expectation 期望值Mode 众数Mean 平均数Variance 变异数Standard deviation 标准差Standard error 标准误Covariance matrix 共变异数矩阵Inferential statistics 推论统计学Point estimation 点估计Interval estimation 区间估计Confidence interval 信赖区间Confidence coefficient 信赖系数Testing statistical hypothesis 统计假设检定Regression analysis 回归分析Analysis of variance 变异数分析Correlation coefficient 相关系数Sampling survey 抽样调查Census 普查Sampling 抽样Reliability 信度Validity 效度Sampling error 抽样误差Non-sampling error 非抽样误差Random sampling 随机抽样Simple random sampling 简单随机抽样法Stratified sampling 分层抽样法Cluster sampling 群集抽样法Systematic sampling 系统抽样法Two-stage random sampling 两段随机抽样法Convenience sampling 便利抽样Quota sampling 配额抽样Snowball sampling 雪球抽样Nonparametric statistics 无母数统计The sign test 等级检定Wilcoxon signed rank tests 魏克森讯号等级检定Wilcoxon rank sum tests 魏克森等级和检定Run test 连检定法Discrete uniform densities 离散的均匀密度Binomial densities 二项密度Hypergeometric densities 超几何密度Poisson densities 卜松密度Geometric densities 几何密度Negative binomial densities 负二项密度Continuous uniform densities 连续均匀密度Normal densities 常态密度Exponential densities 指数密度Gamma densities 伽玛密度Beta densities 贝他密度Multivariate analysis 多变量分析Principal components 主因子分析Discrimination analysis 区别分析Cluster analysis 群集分析Factor analysis 因素分析Survival analysis 存活分析Time series analysis 时间序列分析Linear models 线性模式Quality engineering 品质工程Probability theory 机率论Statistical computing 统计计算Statistical inference 统计推论Stochastic processes 随机过程Decision theory 决策理论Discrete analysis 离散分析Mathematical statistics 数理统计统计学: Statistics母体: Population样本: Sample资料分析: Data analysis统计表: Statistical table统计图: Statistical chart圆饼图: Pie chart茎叶图: Stem-and-leaf display盒须图: Box plot直方图: Histogram长条图: Bar Chart次数多边图: Polygon肩形图: Ogive叙述统计学: Descriptive statistics 期望值: Expectation众数: Mode平均数: Mean变异数: Variance标准差: Standard deviation标准误: Standard error共变异数矩阵: Covariance matrix推论统计学: Inferential statistics点估计: Point estimation区间估计: Interval estimation信赖区间: Confidence interval信赖系数: Confidence coefficient统计假设检定: Testing statisticalhypothesis回归分析: Regression analysis变异数分析: Analysis of variance相关系数: Correlation coefficient抽样调查: Sampling survey普查: Census抽样: Sampling信度: Reliability效度: Validity抽样误差: Sampling error非抽样误差: Non-sampling error随机抽样: Random sampling简单随机抽样法: Simple randomsampling分层抽样法: Stratified sampling群集抽样法: Cluster sampling系统抽样法: Systematic sampling两段随机抽样法: Two-stage randomsampling便利抽样: Convenience sampling配额抽样: Quota sampling雪球抽样: Snowball sampling无母数统计: Nonparametric statistics等级检定: The sign test魏克森讯号等级检定: Wilcoxon signedrank tests魏克森等级和检定: Wilcoxon rank sumtests连检定法: Run test离散的均匀密度: Discrete uniformdensities二项密度: Binomial densities超几何密度: Hypergeometric densities卜松密度: Poisson densities几何密度: Geometric densities负二项密度: Negative binomial densities连续均匀密度: Continuous uniformdensities常态密度: Normal densities指数密度: Exponential densities伽玛密度: Gamma densities贝他密度: Beta densities多变量分析: Multivariate analysis主因子分析: Principal components区别分析: Discrimination analysis群集分析: Cluster analysis因素分析: Factor analysis存活分析: Survival analysis时间序列分析: Time series analysis线性模式: Linear models品质工程: Quality engineering机率论: Probability theory统计计算: Statistical computing统计推论: Statistical inference随机过程: Stochastic processes决策理论: Decision theory离散分析: Discrete analysis数理统计: Mathematical statistics统计名词市调辞典众数(Mode) 普查(census)指数(Index) 问卷(Questionnaire)中位数(Median) 信度(Reliability)百分比(Percentage) 母群体(Population)信赖水准(Confidence level) 观察法(Observational Survey)假设检定(Hypothesis Testing) 综合法(Integrated Survey)卡方检定(Chi-square Test) 雪球抽样(Snowball Sampling)差距量表(Interval Scale) 序列偏差(Series Bias)类别量表(Nominal Scale) 次级资料(Secondary Data)顺序量表(Ordinal Scale) 抽样架构(Sampling frame)比率量表(Ratio Scale) 集群抽样(Cluster Sampling)连检定法(Run Test) 便利抽样(Convenience Sampling)符号检定(Sign Test) 抽样调查(SamplingSur)算术平均数(Arithmetic Mean) 非抽样误差(non-sampling error)展示会法(Display Survey)调查名词准确效度(Criterion-RelatedValidity)元素(Element) 邮寄问卷法(Mail Interview)样本(Sample) 信抽样误差(Sampling error)效度(Validity) 封闭式问题(Close Question)精确度(Precision) 电话访问法(TelephoneInterview)准确度(Validity) 随机抽样法(RandomSampling)实验法(Experiment Survey)抽样单位(Sampling unit) 资讯名词市场调查(Marketing Research) 决策树(Decision Trees)容忍误差(Tolerated erro) 资料采矿(DataMining)初级资料(Primary Data) 时间序列(Time-Series Forecasting)目标母体(Target Population) 回归分析(Regression)抽样偏差(Sampling Bias) 趋势分析(TrendAnalysis)抽样误差(sampling error) 罗吉斯回归(Logistic Regression)架构效度(Construct Validity) 类神经网络(Neural Network)配额抽样(Quota Sampling) 无母数统计检定方法(Non-Parametric Test)人员访问法(Interview) 判别分析法(Discriminant Analysis)集群分析法(cluster analysis) 规则归纳法(Rules Induction)内容效度(Content Validity) 判断抽样(Judgment Sampling)开放式问题(Open Question) OLAP(OnlineAnalytical Process)分层随机抽样(Stratified Randomsampling) 资料仓储(Data Warehouse)非随机抽样法(Nonrandom Sampling) 知识发现(Knowledge DiscoveryAbsolute deviation, 绝对离差Absolute number, 绝对数Absolute residuals, 绝对残差Acceleration array, 加速度立体阵Acceleration in an arbitrary direction, 任意方向上的加速度Acceleration normal, 法向加速度Acceleration space dimension, 加速度空间的维数Acceleration tangential, 切向加速度Acceleration vector, 加速度向量Acceptable hypothesis, 可接受假设Accumulation, 累积Accuracy, 准确度Actual frequency, 实际频数Adaptive estimator, 自适应估计量Addition, 相加Addition theorem, 加法定理Additive Noise, 加性噪声Additivity, 可加性Adjusted rate, 调整率Adjusted value, 校正值Admissible error, 容许误差Aggregation, 聚集性Alpha factoring,α因子法Alternative hypothesis, 备择假设Among groups, 组间Amounts, 总量Analysis of correlation, 相关分析Analysis of covariance, 协方差分析Analysis Of Effects, 效应分析Analysis Of Variance, 方差分析Analysis of regression, 回归分析Analysis of time series, 时间序列分析Analysis of variance, 方差分析Angular transformation, 角转换ANOVA (analysis of variance), 方差分析ANOVA Models, 方差分析模型ANOVA table and eta, 分组计算方差分析Arcing, 弧/弧旋Arcsine transformation, 反正弦变换Area 区域图Area under the curve, 曲线面积AREG , 评估从一个时间点到下一个时间点回归相关时的误差ARIMA, 季节和非季节性单变量模型的极大似然估计Arithmetic grid paper, 算术格纸Arithmetic mean, 算术平均数Arrhenius relation, 艾恩尼斯关系Assessing fit, 拟合的评估Associative laws, 结合律Asymmetric distribution, 非对称分布Asymptotic bias, 渐近偏倚Asymptotic efficiency, 渐近效率Asymptotic variance, 渐近方差Attributable risk, 归因危险度Attribute data, 属性资料Attribution, 属性Autocorrelation, 自相关Autocorrelation of residuals, 残差的自相关Average, 平均数Average confidence interval length, 平均置信区间长度Average growth rate, 平均增长率Bar chart, 条形图Bar graph, 条形图Base period, 基期Bayes' theorem , Bayes定理Bell-shaped curve, 钟形曲线Bernoulli distribution, 伯努力分布Best-trim estimator, 最好切尾估计量Bias, 偏性Binary logistic regression, 二元逻辑斯蒂回归Binomial distribution, 二项分布Bisquare, 双平方Bivariate Correlate, 二变量相关Bivariate normal distribution, 双变量正态分布Bivariate normal population, 双变量正态总体Biweight interval, 双权区间Biweight M-estimator, 双权M估计量Block, 区组/配伍组BMDP(Biomedical computer programs),BMDP统计软件包Boxplots, 箱线图/箱尾图Breakdown bound, 崩溃界/崩溃点Canonical correlation, 典型相关Caption, 纵标目Case-control study, 病例对照研究Categorical variable, 分类变量Catenary, 悬链线Cauchy distribution, 柯西分布Cause-and-effect relationship, 因果关系Cell, 单元Censoring, 终检Center of symmetry, 对称中心Centering and scaling, 中心化和定标Central tendency, 集中趋势Central value, 中心值CHAID -χ2 Automatic Interaction Detector,卡方自动交互检测Chance, 机遇Chance error, 随机误差Chance variable, 随机变量Characteristic equation, 特征方程Characteristic root, 特征根Characteristic vector, 特征向量Chebshev criterion of fit, 拟合的切比雪夫准则Chernoff faces, 切尔诺夫脸谱图Chi-square test, 卡方检验/χ2检验Choleskey decomposition, 乔洛斯基分解Circle chart, 圆图Class interval, 组距Class mid-value, 组中值Class upper limit, 组上限Classified variable, 分类变量Cluster analysis, 聚类分析Cluster sampling, 整群抽样Code, 代码Coded data, 编码数据Coding, 编码Coefficient of contingency, 列联系数Coefficient of determination, 决定系数Coefficient of multiple correlation, 多重相关系数Coefficient of partial correlation, 偏相关系数Coefficient of production-moment correlation, 积差相关系数Coefficient of rank correlation, 等级相关系数Coefficient of regression, 回归系数Coefficient of skewness, 偏度系数Coefficient of variation, 变异系数Cohort study, 队列研究Collinearity, 共线性Column, 列Column effect, 列效应Column factor, 列因素Combination pool, 合并Combinative table, 组合表Common factor, 共性因子Common regression coefficient, 公共回归系数Common value, 共同值Common variance, 公共方差Common variation, 公共变异Communality variance, 共性方差Comparability, 可比性Comparison of bathes, 批比较Comparison value, 比较值Compartment model, 分部模型Compassion, 伸缩Complement of an event, 补事件Complete association, 完全正相关Complete dissociation, 完全不相关Complete statistics, 完备统计量Completely randomized design, 完全随机化设计Composite event, 联合事件Composite events, 复合事件Concavity, 凹性Conditional expectation, 条件期望Conditional likelihood, 条件似然Conditional probability, 条件概率Conditionally linear, 依条件线性Confidence interval, 置信区间Confidence limit, 置信限Confidence lower limit, 置信下限Confidence upper limit, 置信上限Confirmatory Factor Analysis , 验证性因子分析Confirmatory research, 证实性实验研究Confounding factor, 混杂因素Conjoint, 联合分析Consistency, 相合性Consistency check, 一致性检验Consistent asymptotically normal estimate,相合渐近正态估计Consistent estimate, 相合估计Constrained nonlinear regression, 受约束非线性回归Constraint, 约束Contaminated distribution, 污染分布Contaminated Gausssian, 污染高斯分布Contaminated normal distribution, 污染正态分布Contamination, 污染Contamination model, 污染模型Contingency table, 列联表Contour, 边界线Contribution rate, 贡献率Control, 对照, 质量控制图Controlled experiments, 对照实验Conventional depth, 常规深度Convolution, 卷积Corrected factor, 校正因子Corrected mean, 校正均值Correction coefficient, 校正系数Correctness, 正确性Correlation coefficient, 相关系数Correlation, 相关性Correlation index, 相关指数Correspondence, 对应Counting, 计数Counts, 计数/频数Covariance, 协方差Covariant, 共变Cox Regression, Cox回归Criteria for fitting, 拟合准则Criteria of least squares, 最小二乘准则Critical ratio, 临界比Critical region, 拒绝域Critical value, 临界值Cross-over design, 交叉设计Cross-section analysis, 横断面分析Cross-section survey, 横断面调查Crosstabs , 交叉表Crosstabs 列联表分析Cross-tabulation table, 复合表Cube root, 立方根Cumulative distribution function, 分布函数Cumulative probability, 累计概率Curvature, 曲率/弯曲Curvature, 曲率Curve Estimation, 曲线拟合Curve fit , 曲线拟和Curve fitting, 曲线拟合Curvilinear regression, 曲线回归Curvilinear relation, 曲线关系Cut-and-try method, 尝试法Cycle, 周期Cyclist, 周期性D test, D检验Data acquisition, 资料收集Data bank, 数据库Data capacity, 数据容量Data deficiencies, 数据缺乏Data handling, 数据处理Data manipulation, 数据处理Data processing, 数据处理Data reduction, 数据缩减Data set, 数据集Data sources, 数据来源Data transformation, 数据变换Data validity, 数据有效性Data-in, 数据输入Data-out, 数据输出Dead time, 停滞期Degree of freedom, 自由度Degree of precision, 精密度Degree of reliability, 可靠性程度Degression, 递减Density function, 密度函数Density of data points, 数据点的密度Dependent variable, 应变量/依变量/因变量Dependent variable, 因变量Depth, 深度Derivative matrix, 导数矩阵Derivative-free methods, 无导数方法Design, 设计Determinacy, 确定性Determinant, 行列式Determinant, 决定因素Deviation, 离差Deviation from average, 离均差Diagnostic plot, 诊断图Dichotomous variable, 二分变量Differential equation, 微分方程Direct standardization, 直接标准化法Direct Oblimin, 斜交旋转Discrete variable, 离散型变量DISCRIMINANT, 判断Discriminant analysis, 判别分析Discriminant coefficient, 判别系数Discriminant function, 判别值Dispersion, 散布/分散度Disproportional, 不成比例的Disproportionate sub-class numbers, 不成比例次级组含量Distribution free, 分布无关性/免分布Distribution shape, 分布形状Distribution-free method, 任意分布法Distributive laws, 分配律Disturbance, 随机扰动项Dose response curve, 剂量反应曲线Double blind method, 双盲法Double blind trial, 双盲试验Double exponential distribution, 双指数分布Double logarithmic, 双对数Downward rank, 降秩Dual-space plot, 对偶空间图DUD, 无导数方法Duncan's new multiple range method, 新复极差法/Duncan新法Error Bar, 均值相关区间图Effect, 实验效应Eigenvalue, 特征值Eigenvector, 特征向量Ellipse, 椭圆Empirical distribution, 经验分布Empirical probability, 经验概率单位Enumeration data, 计数资料Equal sun-class number, 相等次级组含量Equally likely, 等可能Equivariance, 同变性Error, 误差/错误Error of estimate, 估计误差Error type I, 第一类错误Error type II, 第二类错误Estimand, 被估量Estimated error mean squares, 估计误差均方Estimated error sum of squares, 估计误差平方和Euclidean distance, 欧式距离Event, 事件Event, 事件Exceptional data point, 异常数据点Expectation plane, 期望平面Expectation surface, 期望曲面Expected values, 期望值Experiment, 实验Experimental sampling, 试验抽样Experimental unit, 试验单位Explained variance (已说明方差)Explanatory variable, 说明变量Exploratory data analysis, 探索性数据分析Explore Summarize, 探索-摘要Exponential curve, 指数曲线Exponential growth, 指数式增长EXSMOOTH, 指数平滑方法Extended fit, 扩充拟合Extra parameter, 附加参数Extrapolation, 外推法Extreme observation, 末端观测值Extremes, 极端值/极值F distribution, F分布F test, F检验Factor, 因素/因子Factor analysis, 因子分析Factor Analysis, 因子分析Factor score, 因子得分Factorial, 阶乘Factorial design, 析因试验设计False negative, 假阴性False negative error, 假阴性错误Family of distributions, 分布族Family of estimators, 估计量族Fanning, 扇面Fatality rate, 病死率Field investigation, 现场调查Field survey, 现场调查Finite population, 有限总体Finite-sample, 有限样本First derivative, 一阶导数First principal component, 第一主成分First quartile, 第一四分位数Fisher information, 费雪信息量Fitted value, 拟合值Fitting a curve, 曲线拟合Fixed base, 定基Fluctuation, 随机起伏Forecast, 预测Four fold table, 四格表Fourth, 四分点Fraction blow, 左侧比率Fractional error, 相对误差Frequency, 频率Frequency polygon, 频数多边图Frontier point, 界限点Function relationship, 泛函关系Gamma distribution, 伽玛分布Gauss increment, 高斯增量Gaussian distribution, 高斯分布/正态分布Gauss-Newton increment, 高斯-牛顿增量General census, 全面普查Generalized least squares, 综合最小平方法GENLOG (Generalized liner models), 广义线性模型Geometric mean, 几何平均数Gini's mean difference, 基尼均差GLM (General liner models), 通用线性模型Goodness of fit, 拟和优度/配合度Gradient of determinant, 行列式的梯度Graeco-Latin square, 希腊拉丁方Grand mean, 总均值Gross errors, 重大错误Gross-error sensitivity, 大错敏感度Group averages, 分组平均Grouped data, 分组资料Guessed mean, 假定平均数Half-life, 半衰期Hampel M-estimators, 汉佩尔M估计量Happenstance, 偶然事件Harmonic mean, 调和均数Hazard function, 风险均数Hazard rate, 风险率Heading, 标目Heavy-tailed distribution, 重尾分布Hessian array, 海森立体阵Heterogeneity, 不同质Heterogeneity of variance, 方差不齐Hierarchical classification, 组内分组Hierarchical clustering method, 系统聚类法High-leverage point, 高杠杆率点High-Low, 低区域图Higher Order Interaction Effects,高阶交互作用HILOGLINEAR, 多维列联表的层次对数线性模型Hinge, 折叶点Histogram, 直方图Historical cohort study, 历史性队列研究Holes, 空洞HOMALS, 多重响应分析Homogeneity of variance, 方差齐性Homogeneity test, 齐性检验Huber M-estimators, 休伯M估计量Hyperbola, 双曲线Hypothesis testing, 假设检验Hypothetical universe, 假设总体Image factoring,, 多元回归法Impossible event, 不可能事件Independence, 独立性Independent variable, 自变量Index, 指标/指数Indirect standardization, 间接标准化法Individual, 个体Inference band, 推断带Infinite population, 无限总体Infinitely great, 无穷大Infinitely small, 无穷小Influence curve, 影响曲线Information capacity, 信息容量Initial condition, 初始条件Initial estimate, 初始估计值Initial level, 最初水平Interaction, 交互作用Interaction terms, 交互作用项Intercept, 截距Interpolation, 内插法Interquartile range, 四分位距Interval estimation, 区间估计Intervals of equal probability, 等概率区间Intrinsic curvature, 固有曲率Invariance, 不变性Inverse matrix, 逆矩阵Inverse probability, 逆概率Inverse sine transformation, 反正弦变换Iteration, 迭代Jacobian determinant, 雅可比行列式Joint distribution function, 分布函数Joint probability, 联合概率Joint probability distribution, 联合概率分布K-Means Cluster逐步聚类分析K means method, 逐步聚类法Kaplan-Meier, 评估事件的时间长度Kaplan-Merier chart, Kaplan-Merier图Kendall's rank correlation, Kendall等级相关Kinetic, 动力学Kolmogorov-Smirnove test, 柯尔莫哥洛夫-斯米尔诺夫检验Kruskal and Wallis test, Kruskal及Wallis检验/多样本的秩和检验/H检验Kurtosis, 峰度Lack of fit, 失拟Ladder of powers, 幂阶梯Lag, 滞后Large sample, 大样本Large sample test, 大样本检验Latin square, 拉丁方Latin square design, 拉丁方设计Leakage, 泄漏Least favorable configuration, 最不利构形Least favorable distribution, 最不利分布Least significant difference, 最小显著差法Least square method, 最小二乘法Least Squared Criterion,最小二乘方准则Least-absolute-residuals estimates, 最小绝对残差估计Least-absolute-residuals fit, 最小绝对残差拟合Least-absolute-residuals line, 最小绝对残差线Legend, 图例L-estimator, L估计量L-estimator of location, 位置L估计量L-estimator of scale, 尺度L估计量Level, 水平Leveage Correction,杠杆率校正Life expectance, 预期期望寿命Life table, 寿命表Life table method, 生命表法Light-tailed distribution, 轻尾分布Likelihood function, 似然函数Likelihood ratio, 似然比line graph, 线图Linear correlation, 直线相关Linear equation, 线性方程Linear programming, 线性规划Linear regression, 直线回归Linear Regression, 线性回归Linear trend, 线性趋势Loading, 载荷Location and scale equivariance, 位置尺度同变性Location equivariance, 位置同变性Location invariance, 位置不变性Location scale family, 位置尺度族Log rank test, 时序检验Logarithmic curve, 对数曲线Logarithmic normal distribution, 对数正态分布Logarithmic scale, 对数尺度Logarithmic transformation, 对数变换Logic check, 逻辑检查Logistic distribution, 逻辑斯特分布Logit transformation, Logit转换LOGLINEAR, 多维列联表通用模型Lognormal distribution, 对数正态分布Lost function, 损失函数Low correlation, 低度相关Lower limit, 下限Lowest-attained variance, 最小可达方差LSD, 最小显著差法的简称Lurking variable, 潜在变量Main effect, 主效应Major heading, 主辞标目Marginal density function, 边缘密度函数Marginal probability, 边缘概率Marginal probability distribution, 边缘概率分布Matched data, 配对资料Matched distribution, 匹配过分布Matching of distribution, 分布的匹配Matching of transformation, 变换的匹配Mathematical expectation, 数学期望Mathematical model, 数学模型Maximum L-estimator, 极大极小L 估计量Maximum likelihood method, 最大似然法Mean, 均数Mean squares between groups, 组间均方Mean squares within group, 组内均方Means (Compare means), 均值-均值比较Median, 中位数Median effective dose, 半数效量Median lethal dose, 半数致死量Median polish, 中位数平滑Median test, 中位数检验Minimal sufficient statistic, 最小充分统计量Minimum distance estimation, 最小距离估计Minimum effective dose, 最小有效量Minimum lethal dose, 最小致死量Minimum variance estimator, 最小方差估计量MINITAB, 统计软件包Minor heading, 宾词标目Missing data, 缺失值Model specification, 模型的确定Modeling Statistics , 模型统计Models for outliers, 离群值模型Modifying the model, 模型的修正Modulus of continuity, 连续性模Morbidity, 发病率Most favorable configuration, 最有利构形MSC(多元散射校正)Multidimensional Scaling (ASCAL), 多维尺度/多维标度Multinomial Logistic Regression , 多项逻辑斯蒂回归Multiple comparison, 多重比较Multiple correlation , 复相关Multiple covariance, 多元协方差Multiple linear regression, 多元线性回归Multiple response , 多重选项Multiple solutions, 多解Multiplication theorem, 乘法定理Multiresponse, 多元响应Multi-stage sampling, 多阶段抽样Multivariate T distribution, 多元T分布Mutual exclusive, 互不相容Mutual independence, 互相独立Natural boundary, 自然边界Natural dead, 自然死亡Natural zero, 自然零Negative correlation, 负相关Negative linear correlation, 负线性相关Negatively skewed, 负偏Newman-Keuls method, q检验NK method, q检验No statistical significance, 无统计意义Nominal variable, 名义变量Nonconstancy of variability, 变异的非定常性Nonlinear regression, 非线性相关Nonparametric statistics, 非参数统计Nonparametric test, 非参数检验Nonparametric tests, 非参数检验Normal deviate, 正态离差Normal distribution, 正态分布Normal equation, 正规方程组Normal P-P, 正态概率分布图Normal Q-Q, 正态概率单位分布图Normal ranges, 正常范围Normal value, 正常值Normalization 归一化Nuisance parameter, 多余参数/讨厌参数Null hypothesis, 无效假设Numerical variable, 数值变量Objective function, 目标函数Observation unit, 观察单位Observed value, 观察值One sided test, 单侧检验One-way analysis of variance, 单因素方差分析Oneway ANOVA , 单因素方差分析(假设多个参数是相等的)Open sequential trial, 开放型序贯设计Optrim, 优切尾Optrim efficiency, 优切尾效率Order statistics, 顺序统计量Ordered categories, 有序分类Ordinal logistic regression , 序数逻辑斯蒂回归Ordinal variable, 有序变量Orthogonal basis, 正交基Orthogonal design, 正交试验设计Orthogonality conditions, 正交条件ORTHOPLAN, 正交设计Outlier cutoffs, 离群值截断点Outliers, 极端值OVERALS , 多组变量的非线性正规相关Overshoot, 迭代过度Paired design, 配对设计Paired sample, 配对样本Pairwise slopes, 成对斜率Parabola, 抛物线Parallel tests, 平行试验Parameter, 参数Parametric statistics, 参数统计Parametric test, 参数检验Pareto, 直条构成线图(又称佩尔托图)Partial correlation, 偏相关Partial regression, 偏回归Partial sorting, 偏排序Partials residuals, 偏残差Pattern, 模式PCA(主成分分析)Pearson curves, 皮尔逊曲线Peeling, 退层Percent bar graph, 百分条形图Percentage, 百分比Percentile, 百分位数Percentile curves, 百分位曲线Periodicity, 周期性Permutation, 排列P-estimator, P估计量Pie graph, 构成图,饼图Pitman estimator, 皮特曼估计量Pivot, 枢轴量Planar, 平坦Planar assumption, 平面的假设PLANCARDS, 生成试验的计划卡PLS(偏最小二乘法)Point estimation, 点估计Poisson distribution, 泊松分布Polishing, 平滑Polled standard deviation, 合并标准差Polled variance, 合并方差Polygon, 多边图Polynomial, 多项式Polynomial curve, 多项式曲线Population, 总体Population attributable risk, 人群归因危险度Positive correlation, 正相关Positively skewed, 正偏Posterior distribution, 后验分布Power of a test, 检验效能Precision, 精密度Predicted value, 预测值Preliminary analysis, 预备性分析Principal axis factoring,主轴因子法Principal component analysis, 主成分分析Prior distribution, 先验分布Prior probability, 先验概率Probabilistic model, 概率模型probability, 概率Probability density, 概率密度Product moment, 乘积矩/协方差Profile trace, 截面迹图Proportion, 比/构成比Proportion allocation in stratified randomsampling, 按比例分层随机抽样Proportionate, 成比例Proportionate sub-class numbers, 成比例次级组含量Prospective study, 前瞻性调查Proximities, 亲近性Pseudo F test, 近似F检验Pseudo model, 近似模型Pseudosigma, 伪标准差Purposive sampling, 有目的抽样QR decomposition, QR分解Quadratic approximation, 二次近似Qualitative classification, 属性分类Qualitative method, 定性方法Quantile-quantile plot, 分位数-分位数图/Q-Q 图Quantitative analysis, 定量分析Quartile, 四分位数Quick Cluster, 快速聚类Radix sort, 基数排序Random allocation, 随机化分组Random blocks design, 随机区组设计Random event, 随机事件Randomization, 随机化Range, 极差/全距Rank correlation, 等级相关Rank sum test, 秩和检验Rank test, 秩检验Ranked data, 等级资料Rate, 比率Ratio, 比例Raw data, 原始资料Raw residual, 原始残差Rayleigh's test, 雷氏检验Rayleigh's Z, 雷氏Z值Reciprocal, 倒数Reciprocal transformation, 倒数变换Recording, 记录Redescending estimators, 回降估计量Reducing dimensions, 降维Re-expression, 重新表达Reference set, 标准组Region of acceptance, 接受域Regression coefficient, 回归系数Regression sum of square, 回归平方和Rejection point, 拒绝点Relative dispersion, 相对离散度Relative number, 相对数Reliability, 可靠性Reparametrization, 重新设置参数Replication, 重复Report Summaries, 报告摘要Residual sum of square, 剩余平方和residual variance (剩余方差)Resistance, 耐抗性Resistant line, 耐抗线Resistant technique, 耐抗技术R-estimator of location, 位置R估计量R-estimator of scale, 尺度R估计量Retrospective study, 回顾性调查Ridge trace, 岭迹Ridit analysis, Ridit分析Rotation, 旋转Rounding, 舍入Row, 行Row effects, 行效应Row factor, 行因素RXC table, RXC表Sample, 样本Sample regression coefficient, 样本回归系数Sample size, 样本量Sample standard deviation, 样本标准差Sampling error, 抽样误差SAS(Statistical analysis system ), SAS统计软件包Scale, 尺度/量表Scatter diagram, 散点图Schematic plot, 示意图/简图Score test, 计分检验Screening, 筛检SEASON, 季节分析Second derivative, 二阶导数Second principal component, 第二主成分SEM (Structural equation modeling), 结构化方程模型Semi-logarithmic graph, 半对数图Semi-logarithmic paper, 半对数格纸Sensitivity curve, 敏感度曲线Sequential analysis, 贯序分析Sequence, 普通序列图Sequential data set, 顺序数据集Sequential design, 贯序设计Sequential method, 贯序法Sequential test, 贯序检验法Serial tests, 系列试验Short-cut method, 简捷法Sigmoid curve, S形曲线Sign function, 正负号函数Sign test, 符号检验Signed rank, 符号秩Significant Level, 显著水平Significance test, 显著性检验Significant figure, 有效数字Simple cluster sampling, 简单整群抽样Simple correlation, 简单相关Simple random sampling, 简单随机抽样Simple regression, 简单回归simple table, 简单表Sine estimator, 正弦估计量Single-valued estimate, 单值估计Singular matrix, 奇异矩阵Skewed distribution, 偏斜分布Skewness, 偏度Slash distribution, 斜线分布Slope, 斜率Smirnov test, 斯米尔诺夫检验Source of variation, 变异来源Spearman rank correlation, 斯皮尔曼等级相关Specific factor, 特殊因子Specific factor variance, 特殊因子方差Spectra , 频谱Spherical distribution, 球型正态分布Spread, 展布SPSS(Statistical package for the social science), SPSS统计软件包Spurious correlation, 假性相关Square root transformation, 平方根变换Stabilizing variance, 稳定方差Standard deviation, 标准差Standard error, 标准误Standard error of difference, 差别的标准误Standard error of estimate, 标准估计误差Standard error of rate, 率的标准误Standard normal distribution, 标准正态分布Standardization, 标准化Starting value, 起始值Statistic, 统计量Statistical control, 统计控制Statistical graph, 统计图Statistical inference, 统计推断Statistical table, 统计表Steepest descent, 最速下降法Stem and leaf display, 茎叶图Step factor, 步长因子Stepwise regression, 逐步回归Storage, 存Strata, 层(复数)Stratified sampling, 分层抽样Stratified sampling, 分层抽样Strength, 强度Stringency, 严密性Structural relationship, 结构关系Studentized residual, 学生化残差/t化残差Sub-class numbers, 次级组含量Subdividing, 分割Sufficient statistic, 充分统计量Sum of products, 积和Sum of squares, 离差平方和Sum of squares about regression, 回归平方和Sum of squares between groups, 组间平方和Sum of squares of partial regression, 偏回归平方和Sure event, 必然事件Survey, 调查Survival, 生存分析Survival rate, 生存率Suspended root gram, 悬吊根图Symmetry, 对称Systematic error, 系统误差Systematic sampling, 系统抽样Tags, 标签Tail area, 尾部面积Tail length, 尾长Tail weight, 尾重Tangent line, 切线Target distribution, 目标分布Taylor series, 泰勒级数Test(检验)Test of linearity, 线性检验Tendency of dispersion, 离散趋势Testing of hypotheses, 假设检验Theoretical frequency, 理论频数Time series, 时间序列Tolerance interval, 容忍区间Tolerance lower limit, 容忍下限Tolerance upper limit, 容忍上限Torsion, 扰率Total sum of square, 总平方和Total variation, 总变异Transformation, 转换Treatment, 处理Trend, 趋势Trend of percentage, 百分比趋势Trial, 试验Trial and error method, 试错法。

文献信息:文献标题:A Study of Data Mining with Big Data(大数据挖掘研究)国外作者:VH Shastri,V Sreeprada文献出处:《International Journal of Emerging Trends and Technology in Computer Science》,2016,38(2):99-103字数统计:英文2291单词,12196字符;中文3868汉字外文文献:A Study of Data Mining with Big DataAbstract Data has become an important part of every economy, industry, organization, business, function and individual. Big Data is a term used to identify large data sets typically whose size is larger than the typical data base. Big data introduces unique computational and statistical challenges. Big Data are at present expanding in most of the domains of engineering and science. Data mining helps to extract useful data from the huge data sets due to its volume, variability and velocity. This article presents a HACE theorem that characterizes the features of the Big Data revolution, and proposes a Big Data processing model, from the data mining perspective.Keywords: Big Data, Data Mining, HACE theorem, structured and unstructured.I.IntroductionBig Data refers to enormous amount of structured data and unstructured data thatoverflow the organization. If this data is properly used, it can lead to meaningful information. Big data includes a large number of data which requires a lot of processing in real time. It provides a room to discover new values, to understand in-depth knowledge from hidden values and provide a space to manage the data effectively. A database is an organized collection of logically related data which can be easily managed, updated and accessed. Data mining is a process discovering interesting knowledge such as associations, patterns, changes, anomalies and significant structures from large amount of data stored in the databases or other repositories.Big Data includes 3 V’s as its characteristics. They are volume, velocity and variety. V olume means the amount of data generated every second. The data is in state of rest. It is also known for its scale characteristics. Velocity is the speed with which the data is generated. It should have high speed data. The data generated from social media is an example. Variety means different types of data can be taken such as audio, video or documents. It can be numerals, images, time series, arrays etc.Data Mining analyses the data from different perspectives and summarizing it into useful information that can be used for business solutions and predicting the future trends. Data mining (DM), also called Knowledge Discovery in Databases (KDD) or Knowledge Discovery and Data Mining, is the process of searching large volumes of data automatically for patterns such as association rules. It applies many computational techniques from statistics, information retrieval, machine learning and pattern recognition. Data mining extract only required patterns from the database in a short time span. Based on the type of patterns to be mined, data mining tasks can be classified into summarization, classification, clustering, association and trends analysis.Big Data is expanding in all domains including science and engineering fields including physical, biological and biomedical sciences.II.BIG DATA with DATA MININGGenerally big data refers to a collection of large volumes of data and these data are generated from various sources like internet, social-media, business organization, sensors etc. We can extract some useful information with the help of Data Mining. It is a technique for discovering patterns as well as descriptive, understandable, models from a large scale of data.V olume is the size of the data which is larger than petabytes and terabytes. The scale and rise of size makes it difficult to store and analyse using traditional tools. Big Data should be used to mine large amounts of data within the predefined period of time. Traditional database systems were designed to address small amounts of data which were structured and consistent, whereas Big Data includes wide variety of data such as geospatial data, audio, video, unstructured text and so on.Big Data mining refers to the activity of going through big data sets to look for relevant information. To process large volumes of data from different sources quickly, Hadoop is used. Hadoop is a free, Java-based programming framework that supports the processing of large data sets in a distributed computing environment. Its distributed supports fast data transfer rates among nodes and allows the system to continue operating uninterrupted at times of node failure. It runs Map Reduce for distributed data processing and is works with structured and unstructured data.III.BIG DATA characteristics- HACE THEOREM.We have large volume of heterogeneous data. There exists a complex relationship among the data. We need to discover useful information from this voluminous data.Let us imagine a scenario in which the blind people are asked to draw elephant. The information collected by each blind people may think the trunk as wall, leg as tree, body as wall and tail as rope. The blind men can exchange information with each other.Figure1: Blind men and the giant elephantSome of the characteristics that include are:i.Vast data with heterogeneous and diverse sources: One of the fundamental characteristics of big data is the large volume of data represented by heterogeneous and diverse dimensions. For example in the biomedical world, a single human being is represented as name, age, gender, family history etc., For X-ray and CT scan images and videos are used. Heterogeneity refers to the different types of representations of same individual and diverse refers to the variety of features to represent single information.ii.Autonomous with distributed and de-centralized control: the sources are autonomous, i.e., automatically generated; it generates information without any centralized control. We can compare it with World Wide Web (WWW) where each server provides a certain amount of information without depending on other servers.plex and evolving relationships: As the size of the data becomes infinitely large, the relationship that exists is also large. In early stages, when data is small, there is no complexity in relationships among the data. Data generated from social media and other sources have complex relationships.IV.TOOLS:OPEN SOURCE REVOLUTIONLarge companies such as Facebook, Yahoo, Twitter, LinkedIn benefit and contribute work on open source projects. In Big Data Mining, there are many open source initiatives. The most popular of them are:Apache Mahout:Scalable machine learning and data mining open source software based mainly in Hadoop. It has implementations of a wide range of machine learning and data mining algorithms: clustering, classification, collaborative filtering and frequent patternmining.R: open source programming language and software environment designed for statistical computing and visualization. R was designed by Ross Ihaka and Robert Gentleman at the University of Auckland, New Zealand beginning in 1993 and is used for statistical analysis of very large data sets.MOA: Stream data mining open source software to perform data mining in real time. It has implementations of classification, regression; clustering and frequent item set mining and frequent graph mining. It started as a project of the Machine Learning group of University of Waikato, New Zealand, famous for the WEKA software. The streams framework provides an environment for defining and running stream processes using simple XML based definitions and is able to use MOA, Android and Storm.SAMOA: It is a new upcoming software project for distributed stream mining that will combine S4 and Storm with MOA.Vow pal Wabbit: open source project started at Yahoo! Research and continuing at Microsoft Research to design a fast, scalable, useful learning algorithm. VW is able to learn from terafeature datasets. It can exceed the throughput of any single machine networkinterface when doing linear learning, via parallel learning.V.DATA MINING for BIG DATAData mining is the process by which data is analysed coming from different sources discovers useful information. Data Mining contains several algorithms which fall into 4 categories. They are:1.Association Rule2.Clustering3.Classification4.RegressionAssociation is used to search relationship between variables. It is applied in searching for frequently visited items. In short it establishes relationship among objects. Clustering discovers groups and structures in the data.Classification deals with associating an unknown structure to a known structure. Regression finds a function to model the data.The different data mining algorithms are:Table 1. Classification of AlgorithmsData Mining algorithms can be converted into big map reduce algorithm based on parallel computing basis.Table 2. Differences between Data Mining and Big DataVI.Challenges in BIG DATAMeeting the challenges with BIG Data is difficult. The volume is increasing every day. The velocity is increasing by the internet connected devices. The variety is also expanding and the organizations’ capability to capture and process the data is limited.The following are the challenges in area of Big Data when it is handled:1.Data capture and storage2.Data transmission3.Data curation4.Data analysis5.Data visualizationAccording to, challenges of big data mining are divided into 3 tiers.The first tier is the setup of data mining algorithms. The second tier includesrmation sharing and Data Privacy.2.Domain and Application Knowledge.The third one includes local learning and model fusion for multiple information sources.3.Mining from sparse, uncertain and incomplete data.4.Mining complex and dynamic data.Figure 2: Phases of Big Data ChallengesGenerally mining of data from different data sources is tedious as size of data is larger. Big data is stored at different places and collecting those data will be a tedious task and applying basic data mining algorithms will be an obstacle for it. Next we need to consider the privacy of data. The third case is mining algorithms. When we are applying data mining algorithms to these subsets of data the result may not be that much accurate.VII.Forecast of the futureThere are some challenges that researchers and practitioners will have to deal during the next years:Analytics Architecture:It is not clear yet how an optimal architecture of analytics systems should be to deal with historic data and with real-time data at the same time. An interesting proposal is the Lambda architecture of Nathan Marz. The Lambda Architecture solves the problem of computing arbitrary functions on arbitrary data in real time by decomposing the problem into three layers: the batch layer, theserving layer, and the speed layer. It combines in the same system Hadoop for the batch layer, and Storm for the speed layer. The properties of the system are: robust and fault tolerant, scalable, general, and extensible, allows ad hoc queries, minimal maintenance, and debuggable.Statistical significance: It is important to achieve significant statistical results, and not be fooled by randomness. As Efron explains in his book about Large Scale Inference, it is easy to go wrong with huge data sets and thousands of questions to answer at once.Distributed mining: Many data mining techniques are not trivial to paralyze. To have distributed versions of some methods, a lot of research is needed with practical and theoretical analysis to provide new methods.Time evolving data: Data may be evolving over time, so it is important that the Big Data mining techniques should be able to adapt and in some cases to detect change first. For example, the data stream mining field has very powerful techniques for this task.Compression: Dealing with Big Data, the quantity of space needed to store it is very relevant. There are two main approaches: compression where we don’t loose anything, or sampling where we choose what is thedata that is more representative. Using compression, we may take more time and less space, so we can consider it as a transformation from time to space. Using sampling, we are loosing information, but the gains inspace may be in orders of magnitude. For example Feldman et al use core sets to reduce the complexity of Big Data problems. Core sets are small sets that provably approximate the original data for a given problem. Using merge- reduce the small sets can then be used for solving hard machine learning problems in parallel.Visualization: A main task of Big Data analysis is how to visualize the results. As the data is so big, it is very difficult to find user-friendly visualizations. New techniques, and frameworks to tell and show stories will be needed, as for examplethe photographs, infographics and essays in the beautiful book ”The Human Face of Big Data”.Hidden Big Data: Large quantities of useful data are getting lost since new data is largely untagged and unstructured data. The 2012 IDC studyon Big Data explains that in 2012, 23% (643 exabytes) of the digital universe would be useful for Big Data if tagged and analyzed. However, currently only 3% of the potentially useful data is tagged, and even less is analyzed.VIII.CONCLUSIONThe amounts of data is growing exponentially due to social networking sites, search and retrieval engines, media sharing sites, stock trading sites, news sources and so on. Big Data is becoming the new area for scientific data research and for business applications.Data mining techniques can be applied on big data to acquire some useful information from large datasets. They can be used together to acquire some useful picture from the data.Big Data analysis tools like Map Reduce over Hadoop and HDFS helps organization.中文译文:大数据挖掘研究摘要数据已经成为各个经济、行业、组织、企业、职能和个人的重要组成部分。
Rushabh Shah, IJPRBS, 2012; VoAvail*RUSHABH1.Kalol Institute of Pharma2.K. B. Raval College of Ph12; Volume 1(5): IJPAvailable Online At PEGYLATION – A REVIEWSHABH SHAH1, DARSHAN SHAH1, UTSAV PATELharmacy, Kalol, Gujarat.of Pharmacy, Gandhinagar, Gujarat.IJPRBSTEL2Rushabh Shah, IJPRBS, 2012; Volume 1(5): IJPRBS Available Online At Anumberofnoveldrug-deliverymechanisms have been developed to increase the utility of drugs that are otherwiselimitedbysuboptimalpharmacokinetic properties, such as poor absorption, distribution, and elimination. These include continuous-release injectable and liposomal systems, which alter the formulation of the drug, and PEGylation, which alters the drug molecule.1The use of proteins and peptides as human therapeutics has expanded in recent years due to: (1) discovery of novel peptides and proteins, (2) a better understanding of the mechanismofactioninvivo,(3)Improvements in expression or synthesis of proteins and peptides that closely resemble fully human proteins and peptides, and (4) improvements in formulation or molecule-altering technologies that have the ability to deliver polypeptides in vivo with improved pharmacokinetic and pharmacodynamic properties. It was estimated that in the year 2000, as many as 500 biopharmaceutical products were under-going clinical trials, and the estimated annual growth rates ofproteinproducts(glycoproteinandantibodies) will range from 10 to 35%. Although more biopharmaceuticals are in development than ever before, many of these have problems that are typical of polypeptide therapeutics, including short circulatinghalf-life,immunogenicity,proteolytic degradation, and low solubility. Several strategies have emerged as ways to improvethepharmacokineticand pharmacodynamic properties of biopharmaceuticals,including:(1)manipulation of amino acid sequence to decrease immunogenicity and proteolytic cleavage, (2) fusion or conjugation to immunoglobulin and serum proteins, such as albumin, (3) incorporation into drug delivery vehicles for protection and slow release, and (4) conjugating to natural or synthetic polymers 2–6 Properties of PEGIn Monomethoxy PEG is synthesized by anionicringopeningpolymerizationinitiated with methoxide ions. Commercially available mPEG contains a considerable amount of diol PEG due to the presence of traceamountsofwaterduringRushabh Shah, IJPRBS, 2012; Volume 1(5): IJPRBS Available Online At polymerization. This diol PEG is also of relatively high molecular weight due to polymerization at both ends of the polymer. The amount of diol PEG can exceed 15% of the composition of mPEG. A solution to the problem of diol contamination has been developed in our laboratories 12. In this work, a crude benzylox-y-PEG, containing diol impurity, is methylated and then hydrogenated to remove the benzyl group. Thus diol is converted to the inert dimethyl ether, which can be subsequently removed afteractivationandpolypeptideattachment.BzO–PEG–OH 1 HO–PEG–OH → HO–PEG–OCH 3 1 CH 3 O–PEG–OCH 3Another common route to remove diol is to convert the PEGs to PEG-carboxylic acids that can then be purified by ion-exchange chromatography 13. PEG with various end groups can be prepared by use of suitable initiator and / or termination re-agents. Numerous functionalities can be introduced as end groups on PEG in this manner, including heterobifunctional products. For instance, Kataoka et al. synthesized a heterobifunctionalPEGderivativecontaining aldehyde and thiol end groups 14.Polymerization was initiated with 3, 3-diethoxy-1-propanol,whichformsapropionaldehyde after acid hydrolysis, and the polymerization was terminated with methansulfonyl chloride with successive con-version to ethyldithiocarbonate and a free thiol.Compared with other polymers, PEG has a relatively narrow polydispersity (M w /M n ) in the range of 1.01 for low molecular weight PEGs (5 kDa) to 1.1 for high molecular weight PEGs ( .50 kDa). The unique ability of PEG to be soluble in both aqueous solutions and organic solvents makes it suitable for end group derivatization and chemical conjugation to biological molecules under mild physiological conditions. Studies of PEG in solution have shown that PEG typically binds 2–3 water molecules per ethylene oxide unit. Due to both the high flexibility of the backbone chain and the binding of water molecules, the PEG molecule acts as if it were five to 10 times as large as a soluble protein of comparable molecular weight. These factors have been suggested as the reason that PEG exhibits the ability to precipitate proteins 15, exclude proteins and cells from surfaces 16, reduce immunogenicity and antigenicity 17 andRushabh Shah, IJPRBS, 2012; Volume 1(5): IJPRBS Available Online At prevent degradation by mammalian cells and enzymes 18.Low molecular weight oligomers of PEG ( ,400 Da) have been shown to be degraded in vivo by alcohol dehydrogenase to toxic metabolites, however the lack of toxicity of PEGs with a molecular weight above 1000 Da has been revealed over many years of useinfoods,cosmeticsandpharmaceuticals 18.PEG is rapidly cleared in vivo without structuralchangeandclearanceisdependent on molecular weight. Below a molecular weight of about 20 kDa the molecule is cleared in the urine, and higher molecular weight PEGs are cleared more slowly in the urine and feces. PEG is only weaklyimmunogenicevenathighmolecular weights. Antibodies to PEG have been generated when attached to a highly immunogenic moleculeunderanimmunization protocol with Freund’sadjuvant 19–21.Therearenoknownsituations in which anti-PEG antibodies have been generated under ‘normal’ clinical administration of a PEG-modified protein. Chemistry of PEGylationTo couple PEG to a molecule (i.e.polypeptides, polysaccharides, polynucleotidesandsmallorganicmolecules) it is necessary to activate the PEG by preparing a derivative of the PEG having a functional group at one or both termini. The functional group is chosen based on the type of available reactive group on the molecule that will be coupled to the PEG. For proteins, typical reactive amino acids include lysine, cysteine, histidine, arginine, aspartic acid, glutamic acid, serine, threonine, tyrosine, N-terminal amino group and the C-terminal carboxylic acid. In the case of glycoprotein, vicinal hydroxyls groups can be oxidized with periodate to form two reactive formyl moieties.The most common route for PEG conjugation of proteins has been to activate the PEG with functional groups suitable for reaction with lysine and N-terminal amino based on the type of available reactive group on the molecule that will be coupled to the PEG. For proteins, typical reactive amino acids include lysine, cysteine, histidine, arginine, aspartic acid, glutamic acid, serine, threonine, tyrosine, N-terminal amino group and the C-terminal carboxylic acid. In the case of glycoprotein, vicinalRushabh Shah, IJPRBS, 2012; Volume 1(5): IJPRBS Available Online At hydroxyls groups can be oxidized with periodate to form two reactive formyl moieties. Eachpositionalisomeroftheheterogeneous mixture is likely to have an influence on whether the conjugate is active or whether an antibody will bind an antigenic epitope. The heterogeneity in lysine substitution and in PEG molecular weights is of some concern for PEG-protein pharmaceuticals, and it is generally necessary to demonstrate that the pattern for a particular pharmaceutical can be measured and is reproducible. Many of the important benefits of PEGylation can be controlled by proper conjugation of various molecular weight PEGs to the protein at specific locations on the protein’s surface. The mono functionality of methoxy PEG makes it particularly suitable for protein and peptide modification because it yields reactive PEGs that do not produce cross linked polypeptides, as long as diol PEG has been removed. As we will see in the discussion of second generation PEGylation, it is also possible in some instances to reduce or eliminate heterogeneity in the position of substitution.First-generation PEG chemistry PEG chemistry for amine conjugation Since most applications of PEG conjugation involve labile molecules, the coupling reactions require mild chemical conditions. In the case of polypeptides, the most common reactive groups involved in coupling are the alpha or epsilon amino groups of lysine. In Fig. 1 is listed a wide range of first generation PEG derivatives used for protein PEGylation of either the alpha or epsilon amino groups. First-generationchemistriesaregenerallyplagued by PEG impurities, restriction to low molecular weights, unstable linkages, and lack of selectivity in modification. Examplesoffirst-generationPEGderivatives include: (a) PEG dichlorotriazine, (b) PEG tresylate, (c) PEG succinimidyl carbonate, (d) PEG benzotriazole carbonate, (e) PEG p -nitrophenyl car-bonate, (f) PEG trichlorophenylcarbonate,(g)PEGcarbonylimidazole and (h) PEG succinimidyl succinate.The initial work of Davis et al. used cyanuric chloride to prepare activated PEG for attachment to proteins6, 17. The PEGdichlorotriazine (Fig. 1a) derivative can react with multiple nucleophilic functionalRushabh Shah, IJPRBS, 2012; Volume 1(5): IJPRBS Available Online At groups such as lysine, serine, tyrosine, cys-teine, and histidine, which results in displacement of one of the chlorides and produces a conjugate with retained charge in the form of a secondary amine linkage 23. The remaining chloride is less susceptible to reactions with nucleophilic residues. Un-fortunately, the reactivity is sufficient to allow cross linking of protein molecules containing additional nucleophilic residues. To solve this problem, Inada et al. synthesized 2, 4-bis (methoxypolyethylene glycol)-6-chloro-s-triazine(mPEG2-chlorotriazine) as shown in Fig. 2 24. The lower reactivity of the remaining chlorine translatesintoamoreselectivemodification of lysine and cysteine residues without further side reactions.Another alkylation reagent used to nonspecifically modify multiple amino groups to form secondary amine linkages to proteins, viruses and liposome’s is PEG tresylate (Fig. 1b) 25.Although more specific to amino groups than PEG dichlorotriazine, the chemistry of conjugation and the conjugation products are not unique and well defined. For example, Gais et al. have shown that PEG-tresylate conjugation to small molecule amines can produce a product that contains a degradable sulfa mate linkage 26.Figure 1. First generation amine reactive PEG derivativesTherefore, a heterogeneous mixture that results from,Attaching PEG-tresylate to proteins may contain a population of conjugates with degradable linkages.Most first-generation PEG chemistries are those that produce conjugates through acylation. Two widely used first-generation activated mPEGs are succinimidyl carbonate (SC-PEG in Fig. 1c) 27, 28 and benzotriazoleRushabh Shah, IJPRBS, 2012; Volume 1(5): IJPRBS Available Online At carbonate (BTC-PEG in Fig. 1d) 29.SC-PEG and BTC-PEG react preferentially with lysine residues to form a carbamate linkage, but are also known to react with histidine and tyrosine residues. SC-PEG is slightly more stable to hydrolysis than BTC-PEG with a half-life of 20.4 min at pH 8 and 25 8C compared to the 13.5 min hydrolysis half-life of BTC-PEG under the same conditions 30. It has recently been observed that SC-PEG and BTC-PEG couple to histidine residues of a-interferon at slightly acidic conditions to form a hydrolytically unstable imidazolecarbamate linkage31.The weak linkage could be used to advantage in preparation of controlled-release formulation, or it could be a disadvantage if conjugate instability were not desired. Other PEG acylating reagents which produce urethane linked proteins include p-nitrophenyl carbonate (pNPC-PEG in Fig. 1e), trichorophenyl carbonate (TCP-PEG in Fig. 1f) and carbonylimidazole (CDI-PEG in Fig. 1g) 32, 33. These reagents are prepared by reacting chloroformates or carbonylimidazolewiththeterminalhydroxyl group on mPEG, and these have much lower reactivity than either the SC-PEG or BTC-PEG. Generally, the slower thereaction the more specific the reagent is to certain amino acid groups of the protein. In this way, some selectivity is achieved. The extent and rate of modification can easily be followed in the case of pNPC-PEG and TCP-PEG by monitoring the phenolate-ion leaving-group by colorimetric analysis.The remaining first-generation PEG reagent is succinimidyl succinate (SS-PEG in Fig. 1h)34. SS-PEG is prepared by reaction of mPEGwith succinic anhydride, followed by activation of the carboxylic acid to the succinimidyl ester. The poly mer backbone contains a second ester linkage that remains after the conjugation reaction with a protein.This linkage is highly susceptible to hydrolysis after the polymer has been attached to the protein. Not only does this hydrolysis lead to loss of the benefits of PEG attachment, but the succinate tag that remains on the protein after hydrolysis can act as a hapten and lead to immunogenicity of the remaining protein 35.Techniques used to form first generation PEGderivativesaregenerallystraightforward and involve reacting theRushabh Shah, IJPRBS, 2012; Volume 1(5): IJPRBS Available Online At PEG polymer with a group that is reactive with hydroxyl groups, typically anhydrides, chlorides, chloroformates and carbonates. With the exception of the work by Bentley et al., these techniques lack the ability to produce pure mono functional PEG derivatives of high molecular weight 12. Since the diol content of high molecular weight PEGs can reach 15%, high-molecular-weight, first- generation PEG chemistryisinefficientforproteinconjugation. The ability to generate an intermediate that can e purified from diactivatedspeciesrenderssecond-generation chemistry a valuable tool for proteinmodification.3.2.Second-generation PEGylation chemistry 3.2.1. PEG chemistry for amine conjugation Second-generation PEGylation chemistry has been designed to avoid the above noted problems of diol contamination, restriction to low molecular weight mPEG, unstable linkages, side reactions and lack of selectivity in substitution. One of the first examples of second-generation chemistry is mPEG-propionaldehyde36. mPEG-propionaldehyde is easier to prepare and use than PEG-acetaldehyde because the acetaldehyde is very susceptible todimerization via aldol condensation. A key property of mPEG- priopionaldehyde, as disclosed by Kinstler et al. in work on PEGylationofG-CSF,sTNF-RI,andconsensus IFN, is that under acidic conditions (approximately pH 5), aldehyde is largely selective for the N-terminal a-amine because of the lower pKa of the a-amine compared to other nucleophiles 37–39. The conjugation of electrophilic PEGs to amino acid residues on proteins is highly dependent on the nucleophilicity of each amino acid residue.Nucleophilic attack will only take place when the pH of the protein solution is near or above the residue’s pKa . Therefore the reactivity of each residue also depends on neighboring amino acid residues. Al though complete selectivity is not observed, the extensive heterogeneity frequently seen with lysine chemistry is greatly reduced. Coupling of aldehydes to primary amines proceeds through a Schiff base,This is reduced in situ to give a stable secondary amine linkage as shown in Figure 3.Rushabh Shah, IJPRBS, 2012; Volume 1(5): IJPRBSAvailable Online At An alternative approach to using PEG-aldehyde is to use the acetal derivative of PEG-propionaldehyde or PEG-acetaldehyde 40. The aldehyde hydrate of the acetal derivatives can be generated in situ by acid hydrolysis (Fig. 4). The pH of the solution can then be adjusted to values sufficient for protein modification with the same mechanism as the free aldehyde derivative in Fig. 3. The benefit of using the acetal derivative over the free propionaldehyde or acetaldehyde is longer storage stability and higher purity. Active esters of PEGcarboxylic acids are the most used acylating agents for protein modification. Active esters react with primary amines near physiological conditions to form stable amides as shown in Figure 5. Generating the carboxylic acid intermediate allows the PEG to be purified from unsubstituted or disubstituted impurities by ion-exchange chromatography 41. Purities of greater than 97% are routinely obtainable by this method. Activation of PEG-carboxylic acids to the succinimidyl active esters is accomplished by reacting the PEG-carboxylic acid with N-hydroxysuccinimide (NHS or HOSu) and a carbodiimide. The first carboxylic acid derivative of PEG not containing a degradable linkage to the PEG back(CM-PEG) 42. The succinimidyl ester of this compound (SCM-PEG) is extremely reactive (hy drolysis t 1 / 2 of 0.75 min at pH 8 and 25 8C) and is therefore difficult to use. To take advantage of the intermediate purification step and have an active ester that had more favorable kinetics for protein modification, Harris et al. prepared propionic acid (PEG–O–CH 2 CH 2 –COOH) and butanoic acid (PEG–O–CH 2 CH 2 CH 2 –COOH) derivatives of PEG 13.Rushabh Shah, IJPRBS, 2012; Volume 1(5): IJPRBS Available Online At Changing the distance between the active ester and the PEG backbone by the addition of methylene units had a profound influence on the reactivity towards amines and water. For example, SBA-PEG, which has two additional methylene groups, has a longer hydrolysis half-life of 23 min at pH 8 and 25 8C. SPA-PEG, which has one additionalmethylenegroup,hasahydrolysis half-life of 16.5 min at pH 8 and 25 8C. Reacivity of PEG active esters towards amines propionic and butonic acidPEG chemistry for cysteine modification PEGylation of free cysteine residues in proteins is the main approach for site-specific modification because reagents that specifically react with cysteines have been synthesized, and the number of free cysteines on the surface of a protein is much less than that of lysine residues. In the absence of a free cysteine in a native protein, one or more free cysteines can be added by genetic engineering43.The advantage of this approach is that it makes possible site-specific PEGylation at areas on the protein that will minimize a loss in biological activity but decrease immunogenicity. This strategy is not without its shortcomings. The addition offree cysteines by genetic engineering increases the possibility of incorrect disulfideformationandproteindimerization. PEG derivatives such as PEG-maleimide (Fig.6(1)), vinylsulfone (Fig. 6(2)), iodoacetamide (Fig6(3)), and orthopyridyl disulfide (Fig. 6(4)) have been developed for PEGylation of cysteine residues, with each derivative having its own advantages and disadvantages 43–46. PEG-vinylsulfone (PEG-VS) reacts slowly with thiols to form a stable thioether linkage to the protein at slightly basic conditions (pH7–8) but will proceed faster if the pH is increased.Although PEG-VS is stable in aqueous solutions, it may react with lysine residues at elevated pH. Unlike PEG-VS, PEG-maleimide (PEG-MAL) is more reactive to thiols even under acidic conditions (pH 6–7), but it is not stable in water and can undergo ring opening or addition of water across the double bond.PEG-iodoacetamide (PEG-IA) reacts slowly with free thiols by nucleophilic substitution, creating a stable thioether linkage. The reaction should be done in slight molar excess of PEG-IA in a dark container to limit the generation of free iodine that may reactRushabh Shah, IJPRBS, 2012; Volume 1(5): IJPRBS Available Online At with other amino acids. The thioether linkage be- tween the PEG-MAL and protein is stable, but slow cleavage of one of the amide linkages can occur by hydrolysis. Orthopyridyldisulfide-PEG(PEG-OPSS)reacts specifically with sulfhydryl groups under both acidic and basic conditions (pH 3–10) to form a disulfide bond with the protein. Disulfide linkages are also stable, except in a reducing environment when the linkage is converted to thiols.Scientists in our laboratories recently prepared a highly active, long circulating and stable conjugate of IFN-b using a two-step method with PEG-OPSS 47. The tertiary structure of IFN-b was determined by Karpusas et al. who showed that the free cysteine residue at position 17 was proximal to the surface but hidden 48. In this case, the available thiol was not accessible to high molecular weight PEG that would be needed for improved pharmacokinetics. The approach that was ultimately adopted was to couple a low molecular weight di-OPSS PEG (Mw2000) to the interferon and then couple a PEG thiol to the remaining terminal OPSS group. The disulfide linkage between PEG and the protein was found tobe stable in plasma circulation (unpublished data).PEG chemistry for oxidized carbohydratesor N-terminus Oxidation of carbohydrate residues or N-terminal serine or threonine is an alternative method for site-directed PEGylation of proteins. Carbohydrates can be oxidized with enzymes, such as glucose oxidase, or chemically with sodium periodate. Oxidation of the carbohydrate residuesgeneratesmultiplereactivealdehyde groups, which can be reacted with either PEG-hydrazidetoproduceahydrazone linkage or with PEG-amine to produce a reversible Schiff base.The hydrazone linkage may be reduced with sodium cyanoborohydride to a more stable alkyl hydrazide and the Schiff’s base may be reduced to form a secondary amine. Reductive alkylation with PEG-amine is problematic because the amino groups of a protein possess similar reactivity to PEG-amines and thus may form cross linked aggregates. PEG-hydrazides are more usefulin these situations. Under acidic conditions (approx.pH 5), amino groups of the protein are predominantly protonated, but because the PEG-hydrazide is aweakerRushabh Shah, IJPRBS, 2012; Volume 1(5): IJPRBS Available Online At base (pKa approx. 3) than primary amines(pKa approx. 10), the reaction is selective to thePEG-hydrazone formation. Multiple attachment sitesare generated using this method, but the modificationsite is specific to the carbohydrate. Another approach to site-specific conjugation is totake advantage of the presence of a N-terminal serineor threonine, which can be converted by periodate oxidation to a glyoxylyl derivative. Gaertner et al.oxidized the N-terminal serine of IL-8 to form aglyoxylyl derivative, which they conjugated toaminooxy and hydrazide PEG derivatives. PEG chemistry for reversible PEGylation Most PEGylation chemistry is designed to create a conjugate that contains a stable linkage to the protein. In most cases having a stable linkage to the protein is beneficial because of the suitability for long-term storage, easier purification and availability of prefilled syringes. It is also generally observedthat stable linkages to a protein can reduce the activity, possibly due to the presence of the PEG chain at the active or binding site of the protein or steric crowding at the active or binding site. Also the PEG molecular weight has a directimpact on the activity; higher molecular weight PEG conjugates tends to have lower in vitro activity but have higher in vivo activityduetotheimprovedpharmacokinetic profile.The objective of most PEG conjugation techniques is to increase the circulation half-life without altering activity. In the development of PEG Intron, Enzon used a degradable linkage between the PEG and protein to improve the pharmacokinetic half-life but minimize loss of activity by releasingnativeinterferonalpha-2bconjugates coupled to His 34.In this case, the PEG is coupled to the N position of the imidazole ring in histidine to form a carbamate linkage and the PEG was found to be released from the protein over time. Note should be taken when comparing PEG-Intron to the branch edPEG 40kDa-interferonalpha-2aconjugate(Pegasys ) that the PEG-Intron product has a higher in vitro activity compared to Pegasys, but the in vivo activity of the Pegasys product is higher due to the superior pharmacokinetic profile 53,54.An approach to regaining protein activity lost by PEGylation is the use of PEGRushabh Shah, IJPRBS, 2012; Volume 1(5): IJPRBS Available Online At chemistry that releases the native protein over time through enzymatic degradation, hydrolytic cleavage or reduction. The first such PEG reagent was PEG-succinimidyl succinate, described above. Other ‘double ester’ PEG reagents have been investigated by Roberts et al. to help control the release rates of the protein and regain activity over a period of time 55. In this case, hydroxy acids are attached to carboxylic acids of PEG (carboxymethyl, propionic, or butanoic) to create a PEG acid that has an ester linkage between the hydroxy acid and PEG acid.The terminal acid of the PEG derivative can then be activated and attached to a- and ´-amino groups of proteins. Regeneration of at least 60% of the native activity of lysozyme was recovered at physiological conditions of completely inactivated protein after release of the PEG from the protein. The problem with the double ester PEG reagents is that they release a protein that contains a ‘tag’ that could lead to immunogenicity of the protein.To circumvent the loss of activity associated with some PEG modifications and the potential immunogenic nature of proteins released from PEG with a ‘tag’ as described above, reagents that release the native protein without ‘tags’ seem to be a better choice for protein modification. The first such reagent was PEG maleic anhydride used by Garman etal. to attach PEG to tissue plasminogen activator andurokinase (Fig. 10)56. Both of the conjugatesRushabh Shah, IJPRBS, 2012; Volume 1(5): IJPRBS Available Online At regenerated the native protein under physiological conditions and had a 5–103 slower clearance rate than the native protein in the guinea pig.Another example of a releasable PEG reagent was prepared by Bentley et al. 57. In this work, mPEG phenyl ether succinimidyl carbonatesandmPEGbenzamidesuccinimidyl carbonates (Fig. 11) are used to conjugate to amino groups on lysozyme. Both conjugates regenerated the native protein under physiological conditions and the rate of release was controlled by the substitution position on the phenyl. Greenwald et al. also synthesized a releasable PEG reagent that released native protein by a 1,6 elimination mechanism (Fig. 12) 58. Again, the native protein was regenerated with nearly 100% of its bioactivity.A further example of a releasable PEG was proposed by Zalipsky et al., which released the native protein by a mechanism other than hydrolysis 59. The linkage as shown in Fig. 13 employs a p or o-disulfide of a benzyl urethane. When subjected to mild reducing environments, such as that present in endosomal compartments of a cell, theoriginal amine component is regenerated. PEG structuresIn addition to the linear structure of the PEG molecule shown above, branched structures have proven useful for protein and peptide modificationThe first branched PEG structure, 2,4-bis(methoxypolyethylene glycol)-6-chloro-s-triazine (mPEG chlorotriazine), was based on a triazine core and synthesized by Inada et al. 24.Yamasaki et al. first synthesized a more useful branched PEG structure, based on a lysine core 64. A highly purified branched PEG or PEG2 (Fig. 14A) was constructed by Veronese et al. using two linear PEG-BTC (or the related PEG-SC) chains linked to the a- and ´-amino groups of lysine65. Thisconstruct allows for a large molecular weight (upward of 60 kDa) and highly pure PEG to be synthesized with a single reactive end group. The standard preparation of PEG2 intermediate acid contains impurities. These impurities consist of unreacted PEG-BTC, a lysine residue that has only one PEG chain attached to one of the amino groups (‘PEG1’), and ‘PEG3’, which is a linear PEG。
Heterogeneity,Group Size and Collective Action:The Role of Institutions in Forest ManagementAmy R.Poteete and Elinor OstromABSTRACTCollective action for sustainable management among resource-dependentpopulations has important policy implications.Despite considerable progressin identifying factors that affect the prospects for collective action,no con-sensus exists about the role played by heterogeneity and size of group.Thedebate continues in part because of a lack of uniform conceptualization ofthese factors,the existence of non-linear relationships,and the mediating roleplayed by institutions.This article draws on research by scholars in theInternational Forestry Resources and Institutions(IFRI)research networkwhich demonstrates that some forms of heterogeneity do not negatively affectsome forms of collective action.More importantly,IFRI research draws outthe interrelations among group size,heterogeneity,and institutions.Institu-tions can affect the level of heterogeneity or compensate for it.Group sizeappears to have a non-linear relationship to at least some forms of collectiveaction.Moreover,group size may be as much an indicator of institutionalsuccess as a precondition for such success.INTRODUCTIONProblems of collective action emerge from several sources,including inad-equate information and conflicting interests,as well as the nature of the good itself.When people lack information,co-ordination is difficult despite com-mon goals(assurance games).If multiple solutions exist but have different distributional consequences,competition over distributional issues can result in failures to co-operate(chicken games).Rivalry in consumption and difficulty of exclusion make provision and protection of common-pool resources particularly challenging.The temptation to let others bear the costs of providing joint benefits threatens provision of these goods.Obs-tacles to exclusion encourage individuals to free-ride on the efforts of others, resulting in under-provision or degradation of the common resource(for example,social dilemmas).Funding from the Ford Foundation,the MacArthur Foundation,and the National Science Foundation(SBR9521918)is gratefully acknowledged.The authors thank Clark Gibson and two anonymous reviewers for thoughtful comments,Lauren Persha for research assistance,and Patty Lezotte for her careful editing.Development and Change35(3):435–461(2004).#Institute of Social Studies2004.Published by Blackwell Publishing,9600Garsington Road,Oxford OX42DQ,UK and350Main St., Malden,MA02148,USA436Amy R.Poteete and Elinor Ostrom A considerable body of theory suggests that collective-action problems will be overcome only rarely(Hardin,1968;Olson,1965;Sandler,1992). Empirical studies,both experimental and field-based,show that these the-oretical expectations are overly pessimistic;groups achieve co-operation and co-ordination in a wide variety of settings(Baland and Platteau,2000; Bromley et al.,1992;National Research Council,2002;Ostrom,1990; Ostrom et al.,1994;Ude hn,1993).Yet there is no guarantee that actors in any given situation will overcome co-ordination or social dilemma prob-lems.Many groups fail to solve these problems.Others experience an unravelling of collective action after initial success.Many natural resource systems,such as forests,fall under collective management or are subject to use by multiple individuals,often for a variety of purposes(Edwards and Steins,1998;Quiggin,1993).Failures to over-come collective-action problems contribute to the degradation or loss of natural resources around the world.Sustaining these resources in the face of demographic and economic pressures depends upon successful co-ordination and co-operation.An understanding of the factors influencing prospects for collective action for sustainable management among resource-dependent populations has important policy implications.This article focuses on the debate about the role of group size and heterogeneity.Recent contributions by scholars using the International Forestry Resources and Institutions (IFRI)1research programme suggest that the debate continues because of a lack of uniform conceptualization of these factors,the existence of non-linear relationships,and the mediating role played by institutions.We begin by describing the IFRI research programme.We then summarize the debate over group size and heterogeneity and review contributions from IFRI studies.These studies highlight the importance of how concepts are operationalized,of non-linear relations,and of institutions.THE INTERNATIONAL FORESTRY RESOURCES AND INSTITUTIONS (IFRI)RESEARCH PROGRAMMEThe IFRI research programme brings together a network of collaborating research centres(CRCs)in a long-term,comparative study of factors affect-ing forests and the people who use them(Ostrom,1998a).Data collection encompasses biophysical measures of forest conditions,climate and soil conditions,demographic information,and economic indicators,as well as details about institutions affecting use of forest resources.IFRI researchers 1.The IFRI research programme involves the study of forests,people,and institutions by anetwork of collaborating research centres(CRCs).The Workshop in Political Theory and Policy Analysis and the Center for the Study of Institutions,Population,and Environmental Change at Indiana University are jointly responsible for co-ordination of this programme.Heterogeneity,Group Size and Collective Action437 return to their study sites every three to five years.The interdisciplinary approach allows assessments of hypothesized relationships among demo-graphic,economic,institutional,and biophysical variables.With the slow accumulation of time-series data,it will be possible to analyse social and institutional processes that take years to unfold.Organization as a network of research centres facilitates comparative research.Scholars interested in IFRI’s inherently interdisciplinary approach have formed CRCs in Africa,Asia,Latin America,and North America.2 Members of the IFRI network use the same methods,collect data on a common set of variables,3and share data in a growing international database,thereby maintaining the comparability required for cross-sectional analysis.The IFRI database currently contains data on157study sites in thirteen countries,with the number of sites per country ranging from one to forty.By building an international database of comparable and repeated studies,IFRI scholars gain the ability to conduct large-N studies and time series analyses.4IFRI studies encompass a wide array of forests and institutions.With studies in temperate forests in the US,the mountain forests of the Himalayas, and tropical forests in Africa,Asia,and Latin America,the research programme encompasses diverse ecological conditions.Forests range from a1-hectare cultural or sacred forest in Uganda to a Bolivian forest reserve of just under45,000hectares.Many of these forests are owned and managed by a national government,reflecting historical preferences for state control of natural resources in many countries.Other forests fall under private or communal ownership.These categories mask further munal management,for example,occurs when governments grant villagers formal control,but also when local residents exercise de facto control in the absence of formal rights.A number of these forests,owned as private property by groups of unrelated individuals,do not fit the general understanding of private or communal property.A variety of management regimes exist in government-owned forests,ranging from management for timber produc-tion,protection for wildlife or biodiversity conservation,to joint manage-ment with local residents for multiple uses.The IFRI research protocols were designed to further the study of collective action in the management of forest resources.Data collection includes measures of several potential dimensions of heterogeneity,including ethnicity, 2.As of2003,there are thirteen IFRI CRCs in eleven countries(see /~ifri/crcs.htm).The first were established in1993.Revisits to study sites have begun in India,Nepal,Uganda,the USA,and Kenya(see Becker et al.,1995;Gombya-Ssembajjwe, 1999;Schweik et al.,1997).3.Many IFRI research teams collect supplemental data to address specific researchquestions.4.IFRI scholars often analyse a subset of the database.These partial analyses range fromsmall-N studies involving one to three sites,to relatively large-N analyses involving fifteen or more sites.438Amy R.Poteete and Elinor Ostrom caste,religion,wealth,occupation,location relative to the forest,reliance on the forest,and patterns of resource use.Teams also collect population data for groups of users with the same rights to and responsibilities for a forest,and for the settlements in which members of these user groups reside.5IFRI’s inter-disciplinary methodology allows comparisons between actual forest conditions and patterns of use associated with particular institutional arrangements.These features make IFRI an attractive resource for the study of relationships between group size,heterogeneity,and collective action for forest management.PUZZLING OVER THE ROLE OF GROUP CHARACTERISTICSTo sustain long-term use of renewable resource systems like forests,collect-ive action is needed to limit resource use and to undertake various forms of active management.Attributes of the resource itself,characteristics of the resource users,and relations between the group and the resource affect the degree of difficulty associated with establishing restrictions on entry or extraction:scholars have identified the condition of the resource and its size,the level of trust among users,their prior experience in organizing activities and their autonomy,and the level of salience or dependence they have on a resource.Numerous studies point to the importance of each of these attributes,giving rise to the broad consensus on their role(see Baland and Platteau,2000;NRC,2002;Ostrom,1992,1999).Scholarly consensus breaks down,however,over other group character-istics hypothesized to influence prospects for collective action.Two of the most contentious debates concern the influence of group size and hetero-geneity.Group size and heterogeneity are widely expected to affect pros-pects for trust and the degree of divergence in interests,and thus to influence prospects for collective action.6No consensus has emerged on the exact nature of the relationships or the relative importance of either ck of agreement on conceptual issues,such as classifying group size and sorting out various forms of heterogeneity,increases the difficulty of resolving these debates with empirical tests.Interactions among group characteristics,and between those characteristics and institutions,further complicate empirical analysis.7We outline both the theoretical arguments and the problems encountered in testing them empirically.5.‘User group’is an analytical category,referring to a set of individuals with a commonunderstanding that they have the same rights and responsibilities to a forest.These individuals need not be organized in any manner,or even know all members of their er groups are thus potential units for collective action.6.See Agrawal and Gibson(1999,2001)for related discussions of the concept of communityand associated assumptions of small size,frequent interactions,homogeneity,shared interests,and norms.pare Kollock(1998);Sandler(1992);Ude hn(1993).Heterogeneity,Group Size and Collective Action439 Group SizeThere are many reasons to expect increasing group size to decrease pro-spects for successful collective action.Opportunities for frequent interaction increase as the size of the group decreases,and frequent interactions create opportunities to build reputations.The expectation of future interactions increases the value of reputations for co-operative behaviour.Moreover, frequent interaction facilitates mutual monitoring.The reputation-building and mutual monitoring associated with frequent interactions suggest that smaller groups foster higher levels of trust.If high levels of trust create conditions amenable to collective action,group size should be negatively correlated with collective action.Group size affects the calculus and strategy of collective action even if trust is not a limiting factor.Individuals may contribute because they think their contribution will make a difference,even if the benefits are dispersed among all group members.If individual contributions do not make a perceptible difference to the collective outcome,the individual incentive to contribute vanishes.The significance of each contribution depends on the technology of provision(Sandler,1992)or production function(Oliver and Marwell,2001); when contributions are summed,the perception that an individual contribu-tion does not make a difference increases with group size.Concerns about avoiding sanctions for defection in ongoing interactions can also promote co-operation(Axelrod,1984).As group size increases,threats of being defected against in the future become a less efficacious method of encouraging co-operation.Olson(1965)emphasized the influence of group size on the fixed costs of collective provision;transaction costs increase with group size,further raising the costs of initiating collective action.8Olson(1965)hypothesized that group size influenced collective action in three ways:(1)larger groups would be less likely to achieve collective action at all, (2)the overall level of collective provision would be lower for larger groups that did achieve collective action,and(3)the degree of sub-optimality in collective provision would increase with group size.Subsequent work generally suggests that group size is less problematic for collective action than Olson thought. Incorporating income effects into the analysis leads to significantly dif-ferent conclusions about the level of collective provision(Andreoni,1988; Chamberlin,1974;Sandler,1992).Most collective goods are normal goods, meaning that individuals who experience an increase in income decrease expenditure on the good by less than the amount of the increase in income. When a collective good is non-rival in consumption,a contribution by any member of the group may be thought of as an increase in income,however 8.The existence of transaction costs implies that there may be economies of scope(Sandler,1992;see also Olson,1965:46–7).If this is so,it makes more sense for a large group that successfully organizes to take on a wide array of activities than to attempt to organize anew for each activity.440Amy R.Poteete and Elinor Ostrom slight,for all other members.As Chamberlin’s(1974)formal model demon-strated,the level of provision of normal collective goods increases with group size,despite decreases in the size of individual contributions.Oliver and Marwell(1988)draw similar conclusions by focusing on jointness of supply and heterogeneity in contribution levels.Under these conditions,the number of individual contributions needed to provide the collective good may decrease with the size of the group.With empirical and theoretical validation,9a relationship between increasing group size and increasing collective provision and decreasing individual contribution size became the conventional wisdom(see also Pecorino,1999).Esteban and Ray(2001)offer additional theoretical reasons for optimism about the level of collective provision.Their formal model involves groups competing for provision of a collective good with a mix of public and private attributes(for example,placement of a public amenity),and assumes an increasing marginal cost for individual contributions.If the marginal costs of individual contributions are sufficiently high,the probability of success increases with group size;larger groups achieve higher levels of collective provision than smaller groups and the effectiveness of a given group increases with its size,all else being equal.Given the realistic scenario of group competition,the sub-optimality of collective provision loses its rger groups are more likely to achieve their desired outcome, even if the absolute level of collective provision is sub-optimal from the perspective of Pareto optimality.The Olsonian expectation of an inverse relationship between collective provision and group size is guaranteed to hold only if either the elasticity of individual effort is zero,or the elasticity of individual effort is between0and1and the good has no public attributes. The size of individual contributions may be less sensitive to group size than predicted by formal models.Parents at many schools in California are not satisfied with the level of state financing and have mobilized to make volun-tary contributions.10Brunner and Sonstelie(2003)analysed the relationship between voluntary contributions to schools and school enrolment,using 1994data from the IRS.The level of contributions increased more slowly than increases in enrolment,implying a decline in per family contributions, as expected.The rate of decline,however,was considerably slower than expected.Brunner and Sonstelie argue that interactions among active group members(parents)play an important role in setting and enforcing expect-ations about the size of per family contributions.Whether this hypothesized dynamic accounts for the observations cannot be discerned with the available data,but the bottom line is clear:At least in this setting,individual decisions about the size of contributions are less sensitive to group size than expected.9.See especially the review in Sandler(1992:49–51).10.Local financing through taxation was deemed unconstitutional because it resulted in aninequitable distribution of resources for education.Heterogeneity,Group Size and Collective Action441 Homogeneity/Heterogeneity of GroupsHomogeneity may also have a bearing on collective action.Sharing import-ant social,cultural,or economic characteristics may increase the predict-ability of interactions(Fearon and Laitin,1996).Predictability may in turn provide a basis for trust.Even if trust does not arise from predictability(for instance,if members of a homogeneous group consider themselves to be predictably opportunistic),common traits suggest common interests. Whether because it promotes trust or reflects common interests,homo-geneity may facilitate collective action.Considerable theoretical work has explored the relationship between group heterogeneity and the performance of common property institutions. Scholars have discussed multiple sources of heterogeneity.Baland and Platteau(2000)focus on the major sources of heterogeneity resulting from racial,ethnic,or other kinds of cultural divisions,and the differences in the nature of economic interests among individuals.Heckathorn(1993)de-velops a series of related theoretical models to try to tease apart the impact of diverse types of heterogeneity on collective action.He concludes that resource heterogeneity augments collective action in the early stages of organization but may impede collective action in groups that would other-wise have high levels of solidarity.Velded(2000)further specifies the diversity of forms of this variable by identifying five forms of heterogeneity: (1)heterogeneity in endowments;(2)political heterogeneity;(3)wealth and entitlements;(4)cultural heterogeneity;and(5)economic interests. Although complementarities among resource uses can sometimes pro-mote co-operative management of shared resources(Quiggin,1993),com-petition among socially differentiated resource uses often gives rise to conflict.The effect of several forms of heterogeneity has been studied empirically in regard to irrigation systems(Bardhan and Dayton-Johnson, 2002;Lam,1998;Tang,1991,1992).Several scholars have focused on important issues related to heterogeneity and forest regimes.11Kant (2000),for example,was concerned about how the product preferences of forest users would increase in diversity as income inequality became greater. Households with larger land holdings and livestock holdings are likely to have a higher demand for biomass as well as a greater need for animal fodder and agricultural compost.Poorer households,on the other hand,are more likely to be interested in the generation of cash or a way of increasing the production of non-timber forest products that are directly related to immediate consumption.Thus,scholars presume that there will be conflict between those who are wealthier and those who are poorer in regard to the use of a forest.In her panel study of six villages in the middle hills of Nepal over a fourteen-year 11.For a recent review,see Kurian(2003).442Amy R.Poteete and Elinor Ostrom period,for example,Cooke(2000)documents the creation of four new community forests.She finds that the time spent in collecting a unit of fuelwood for most households has dropped as a result of two factors:the increased planting of fuelwood trees on private property,and regrowth in the community forests due to more restrictive rules of harvesting.Not all households have been affected equally,however,by the restrictions.House-holds from the occupational castes have a higher demand for forest prod-ucts,but tend to own substantially smaller plots of land.Thus,they cannot easily substitute their own wood for that in the community forests.The harvesting restrictions from the community forests are substantially more costly for these households than for others due to their need for greater amounts of charcoal to make iron tools—the primary source of their family income.Such conflict may well weaken the effectiveness of self-organized groups, but the relationship between heterogeneity and collective action is non-linear and contingent upon other factors.Inequality in wealth,for example, interacts with the relative costs and benefits associated with co-operation in resource management to generate six distinctive situations:(1)sustainable use is in everybody’s interest and no collective-action problem exists;(2)sustainable use is in everybody’s interest but a collective-action problem exists;(3)sustainable use is in nobody’s interest and mutual defection occurs;(4)the benefits of sustainable use accrued by the rich are sufficiently high that they coerce the poor into respecting conservationist practices;(5)sustainable use disproportionately benefits the poor who cannot enforce collective action;and(6)sustainable use disproportionately benefits the poor but collective action is achieved,either because the rich need co-operative relations with the poor in other aspects of social interaction or because institutions give weight to the numerical strength of the poor.12 Somanathan et al.(2002)examined the effect of heterogeneity of villages located in the Kumaun and Garhwal regions of northern India where forest councils(the van panchayat system)were established in many villages during the1930s(see Agrawal,2001;Agrawal and Yadama,1997;Guha,1989). Somanathan and colleagues measured forest crown cover derived from satellite data for1998and conducted a village-level survey during1998–9 in sixty-five villages.They examined the potential effect of income inequal-ity and caste heterogeneity on two measures of collective action—the number of van panchayat meetings held during the previous year and whether a community hired a watchman for their forest.They found a modestly positive relationship between income inequality and frequency of meetings and an insignificant impact of caste heterogeneity of this measure of collective action.Neither measure of heterogeneity had an effect on the probability of a village hiring a watchman.Nor did they find any relationship 12.Ruttan and Borgerhoff Mulder(1999)identify and discuss the first four situations.Heterogeneity,Group Size and Collective Action443 between either form of heterogeneity and the extent of crown cover present in the forest managed by a village in1998.Heterogeneity can be related to different types of production technologies—particularly when the technology used by one group has negative impacts on the use of a resource by others.A recent paper by Balasubramanian and Selvaraj (2003)examines the impact of a growing number of privately owned tube wells in South India on the level of collective action related to the maintenance of irrigation tanks(small dams that are linked to irrigation systems).Collective action in their study was positively related to rice yields produced on the fields served by an irrigation system.Increasing numbers of tube wells in a watershed (as well as the size of the user group)has a negative relationship with collective action.Those who have their own private supply of water are less oriented to contribute to maintenance activities.Further,as more groundwater is withdrawn in the watershed,the physical condition of the irrigation tank is threatened.On the other hand,they also found that inequality in wealth had a U-shaped relationship with collective action.Furthermore—related to the importance of institutions that we discuss later in this article—they also found that the existence of traditional governance structures including rules for allocating water enhances the level of collective action within a system. Heterogeneity is commonly expected to be greater in larger groups.13 Because each new group member may add diversity on one or more dimensions,it is possible for heterogeneity to increase more rapidly than a group’s size.The predicted correspondence of small group size with homo-geneity of interests provides another reason to expect size to influence prospects for collective action.Unfortunately,the desirability of collective action does not decrease with group size;rather,the importance of collective action grows with demand for common-pool resources.Population growth will indeed threaten natural resources if larger groups have less success at developing or sustaining institutions for collective management of resources.Lower levels of collective action in larger groups could account for the association between population growth rates and rates of deforesta-tion in cross-national comparisons.14ChallengesThe lack of consensus reflects the impossibility of isolating the influence of group size or heterogeneity when these factors are interrelated with several 13.Baland and Platteau(2000:365–6)argue that claims for the desirability of small groupsrest more heavily on the expectation of homogeneity than benefits from frequent interactions.14.See the extensive empirical research summarized in Kaimowitz and Angelsen(1998)andRudel(1994).Some studies at these larger scales show no relationship.Mertens et al.(2000)explain the relationship between population growth and deforestation in Cameroon as mediated by a substantial economic crisis.444Amy R.Poteete and Elinor Ostrom other variables.In addition,conceptual and practical problems exist with the hypothesized links between small size,homogeneity,and collective action. It is widely agreed that the influence of any given factor depends on the form of collective action under consideration.Yet the form of collective action in empirical studies is often not specified,or may be misspecified.The tendency to describe any collective dilemma as a prisoner’s dilemma,public goods provision problem,or a tragedy of the commons continues(Kollock,1998), despite repeated efforts to stress the variety of situations involving collective action(Kollock,1998;Marwell and Oliver,1993;Oliver and Marwell,2001; Ostrom,1990,2003;Poteete and Ostrom,2002;Sandler,1992).Even if the form of collective action is clearly defined,the concepts of group size and heterogeneity require clarification.In common use and most academic studies,group size refers to the number of individuals in a group that could engage in collective action.Olson(1965),however,used group size to refer to a number of different concepts.The interpretation of group size most consistent with his theoretical claims equates size with the individ-ual gains per unit of collective provision(Esteban and Ray,2001;Sandler, 1992).‘Size’becomes another way of referring to whether a group is privileged,intermediate,or latent.If large groups are defined as being latent,then the inverse relationship between size and collective action becomes true by definition.Yet Olson conflates his notion of privilege and latency with numerical size.Throughout his text,he refers to group size in terms of the number of members.15Oliver and Marwell(2001)consider these comments to amount to a second,empirical hypothesis that increases in numerical size dampen prospects for collective action.Subsequent theor-etical and empirical work generally equates group size with the number of individuals.Even with agreement that group size refers to the number of individuals, there is no consensus on the turning point between small and large groups. What is a small group?To what extent,if at all,does the assessment of size depend on context?How is context important and why?Theoretical models and large-N analyses look at size as a continuous variable.Yet the observed range of sizes in empirical and experimental studies is inevitably censored on one or both sides.In Brunner and Sonstelie’s(2003)study, school enrolment ranges from a few hundred students to a maximum set by state education policy.16In experimental studies,logistical considerations limit the feasibility of working with truly large groups(Kollock,1998).15.Consider two examples:‘the partnership can be a workable institutional form when thenumber of partners is quite small,but is generally unsuccessful when the number of partners is very large’(Olson,1965:54);and‘social pressure and social incentives operate only in groups of smaller size,in the groups so small that the members can have face-to-face contact with one another’(ibid.:62).16.They report a mean enrolment of673and a standard deviation of308(Brunner andSonstelie,2003:2171).The actual range is not reported.。