Matlab图形绘制经典案例
- 格式:pdf
- 大小:3.05 MB
- 文档页数:18
实验四MATLAB 高级图形绘制一、实验目的及要求:1.熟悉各种绘图函数的使用;2.掌握图形的修饰方法和标注方法;3.了解MATLAB 中图形窗口的操作。
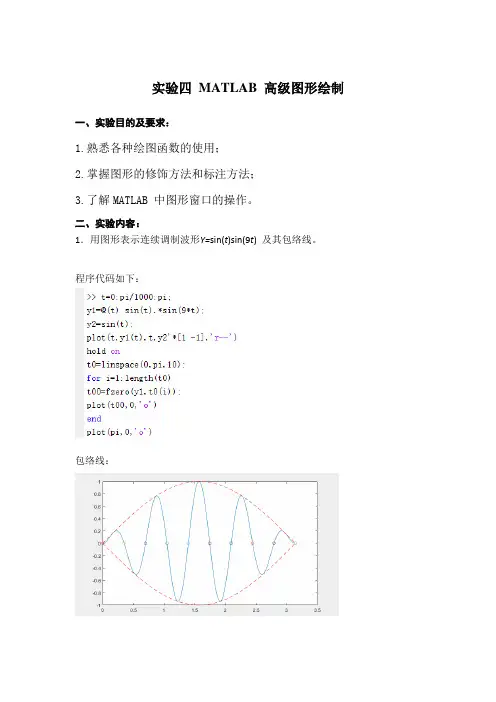
二、实验内容:1.用图形表示连续调制波形Y=sin(t)sin(9t)及其包络线。
程序代码如下:包络线:2.x=[-2π,2π],y1=sinx、y2=cosx、y3=sin2x、y4=cos 2x①用MATLAB语言分四个区域分别绘制的曲线,并且对图形标题及横纵坐标轴进行标注。
程序:结果:②另建一个窗口,不分区,用不同颜色、线型绘出四条曲线,并标注图例注解。
程序:结果:③绘制三维曲线:⎪⎩⎪⎨⎧=≤≤==)cos()sin()200()cos()sin(t t t z t t y t x π程序:结果:3.绘制极坐标曲线ρ=asin(b+nθ),并分析参数a、b、n对曲线形状的影响。
(1)a=1;b=1;n=1(2)a=10;b=1;n=1(3)a=10;b=10;n=1 (4)a=10;b=10;n=10参数a、b、n对曲线形状的影响:由上面绘制的图形可知:a决定图形的大小,当a为整数时,图形半径大小就是a;b决定图形的旋转角度,图形的形状及大小不变;n决定图形的扇叶数,当n 为奇数时,扇叶数为n,当n为偶数时,扇叶数为2n。
三、结论本次实验用到了曲线绘图、三位曲线绘图的知识,与老师上课的内容一致,让我学的matlab绘图的知识得到了巩固,我还学会了如何使用title、subplot、plot、axis等函数。
在做实验的过程复习了hold on指令是覆盖函数继续绘图的意思。
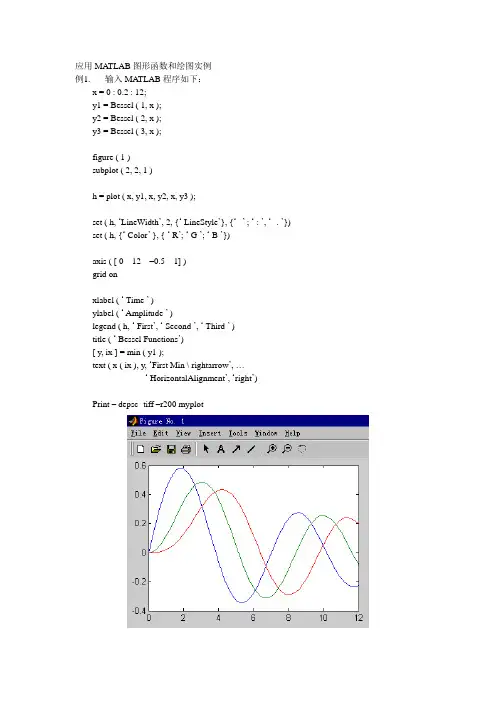
应用MATLAB图形函数和绘图实例例1.输入MATLAB程序如下:x = 0 : 0.2 : 12;y1 = Bessel ( 1, x );y2 = Bessel ( 2, x );y3 = Bessel ( 3, x );figure ( 1 )subplot ( 2, 2, 1 )h = plot ( x, y1, x, y2, x, y3 );set ( h, ‘LineWidth’, 2, {‘ LineStyle’}, {‘--’ ; ‘ : ’, ‘ -. ’}) set ( h, {‘ Color’ }, { ‘ R’; ‘ G ’; ‘ B ’})axis ( [ 0 12 –0.5 1] )grid onxlabel ( ‘ Time ’ )ylabel ( ‘ Amplitude ’ )legend ( h, ‘ First’, ‘ Second ’, ‘ Third ’ )title ( ‘ Bessel Functions’)[ y, ix ] = min ( y1 );text ( x ( ix ), y, ‘First Min \ rightarrow’, …‘ HorizontalAlignment’, ‘right’)Print – depsc -tiff –r200 myplot应用图形编辑模式 如图所示。
同学们自己练习各项功能。
例2. 输入MATLAB 程序如下:t = 0 : pi/100 : 2*pi; y = sin ( t ); plot ( t, y ) grid on继续输入程序如下: y2 = sin ( t – 0.25 ); y3 = sin ( t – 0.5 ); plot ( t, y, t, y2, t, y3 )按此按钮开始图形编辑模式按这些钮开始增加字符箭头和线 改变一个轴的3D 视角可以对线的类型进行定义:t = 0 : pi/100 : 2*pi;y = sin ( t );y2 = sin ( t – 0.25 );y3 = sin ( t – 0.5 );plot ( t, y, ‘ - ’, t, y2, ‘ -- ’, t, y3, ‘ : ’ )练习,对红的颜色进行编辑。
实验报告课程名称: 数学实验学院名称: 数学与统计学院班级:姓名:学号:2012-2013 学年第学期数学与统计学院制(二)参数方程作图例2: 画出星形线{ 及旋轮线{ 的图形解: 输入以下命令:%星形线作图t=linspace(0,2*pi,5000);x=2*(cos(t)).^3;y=2*(sin(t)).^3;plot(x,y),grid;结果:%旋轮线作图t=linspace(0,4*pi,5000); x=2*(t-sin(t));y=2*(1-cos(t));plot(x,y),axis equal; axis(0,8*pi,0,5);grid;结果:(三)极坐标方程图形例3:画出四叶玫瑰线的图形。
知其极坐标方程: ρ=acos(2 )。
解: 取a=5做图。
在命令窗口输入下命令theta=linspace(0,2*pi);r=2*cos(2*theta);polar(theta,r)结果:(四)空间曲面(线)的绘制例4: 绘制双曲抛物面z= 。
解:将其化为参数方程:{ , 编写m文件运行以下命令r=linspace(-4,4,30);s=r;[u,v]=meshgrid(r,s);x=u;y=v;z=(u.^2-v.^2)./4;surf(x,y,z);bix on;结果:(五)空间曲线在坐标平面上的投影曲面和投影柱面例5: 画出螺旋线{ , 在xOz面上的正投影曲线的图形。
解:化为参数方程{ , 运行下列程序t=linspace(-2*pi,2*pi);x=10*cos(t);z=2*t;h=plot(x,z);grid;xlabel('x');ylabel('z');set(h,'linewidth',2);结果:(一)实验分析:(二)在本次实验中我们初步了解了matlab。
(三)学会了一些简单绘图。
(四)在编制中我们要很明确“点乘的重要性”。
案例28使用MATLAB 绘制专业图形绘制曲线和曲面图案例主要信息提示 ● 案例内容:使用MATLAB 进行专业作图。
● 关键词:MATLAB ,作图,二维作图,三维作图 ● 建议课时:2课时● 适合专业:理工科各专业●光盘中的数字资源:二维曲线绘图M 文件graph_line.m三维曲面绘图M 文件graph_surface.m一、 实验内容实验内容1.绘制曲线图在1个绘图窗口的4个不同子窗口中分别绘制以下曲线: ①在子窗口1中绘制两条二维曲线,分别为:0.510.2cos(4)x y e x π-=和0.522cos()x y e x π-=并显示网格线。
②在子窗口2中绘制两条二维曲线,分别为:0.512x y e -=和2cos(2)y x π=并添加标题、x/y 轴名称、图形说明和图例。
③在子窗口3中绘制一条极坐标曲线,如下:sin()cos()r t t =④在子窗口4中绘制一条极三维螺旋线。
全部4个子窗口绘制效果如图28-1所示。
图28-1曲线绘制效果图实验内容2.绘制曲面图在1个绘图窗口的4个不同子窗口中分别绘制以下曲面:①在子窗口1和子窗口2中以不同着色方式绘制两个球面。
②在子窗口3和子窗口4中以不同视角绘制两个直径相等的圆管相交的图形。
全部4个子窗口绘制效果如图28-2所示。
图28-1曲面绘制效果图二、预备知识2.1 MATLAB绘图功能简介MA TLAB软件提供了丰富的图形表达功能,包括常用的二维图形和三维图形。
其中,各种二维图形近30种,三维图形20多种。
应用MA TLAB除了能作一般的曲线、散点图、条形图等,还能绘制流线图、三维矢量图等工程实用图形。
下面我们介绍一些基本的二维和三维绘图函数。
2.2 二维图形的绘制二维图形是将平面坐标上的数据点连接起来的平面图形。
可以采用不同的坐标系,如直角坐标、对数坐标、极坐标等。
二维图形的绘制是其他绘图操作的基础。
2.2.1绘制二维曲线的plot函数在MATLAB中,plot函数是最简单、最基本而且应用最为广泛的线性绘图函数,利用它可以在二维平面上生成线段、曲线和参数方程曲线等的函数图形。
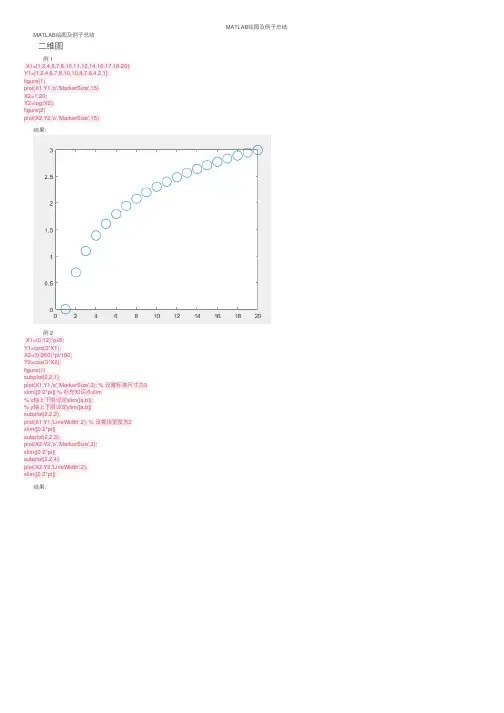
MATLAB 绘图及例⼦总结MATLAB 绘图及例⼦总结⼆维图例 1结果:例 2结果:X1=[1,2,4,6,7,8,10,11,12,14,16,17,18,20];Y1=[1,2,4,6,7,8,10,10,8,7,6,4,2,1];figure(1)plot(X1,Y1,'o','MarkerSize',15)X2=1:20;Y2=log(X2);figure(2)plot(X2,Y2,'o','MarkerSize',15)X1=(0:12)*pi/6;Y1=cos(3*X1);X2=(0:360)*pi/180;Y2=cos(3*X2);figure(1)subplot(2,2,1);plot(X1,Y1,'o','MarkerSize',3); % 设置标准尺⼨为3xlim([0 2*pi]) % 补充知识点xlim% x 轴上下限设定xlim([a,b]);% y 轴上下限设定ylim([a,b])subplot(2,2,2);plot(X1,Y1,'LineWidth',2); % 设置线宽度为2xlim([0 2*pi])subplot(2,2,3);plot(X2,Y2,'o','MarkerSize',3);xlim([0 2*pi])subplot(2,2,4);plot(X2,Y2,'LineWidth',2);xlim([0 2*pi])例 3结果:例 4x=-pi/2:0.01:pi/2;y=x+sin(x)+exp(x);plot(x,y,'-ro'); % 颜⾊红⾊grid on % ⽹格title('y 的函数图像');xlabel('x');ylabel('y');legend('y=x+sinx+e^(x)');A=magic(20);A(9:20,:)=[];figure(1);结果:例 5结果:figure(1);plot(A);for i=1:5for j=1:6B(i,j)=i+j;endendx=0.2:0.2:1;figure(2)subplot(2,2,1);plot(B,x,'LineWidth',1.5);subplot(2,2,2);plot(x,B,'LineWidth',1.5);C=reshape(1:30,5,6); % 变换成特定维数5×6的矩阵subplot(2,2,3);plot(B,C,'LineWidth',1.5);subplot(2,2,4);plot(C,B,'LineWidth',1.5);x=-pi:pi/10:pi;y=tan(sin(x))-sin(tan(x));plot(x,y,'--rs','LineWidth',2,'MarkerEdgeColor','k','MarkerFaceColor','g','MarkerSize',10);% MarkerFaceColor :点符号填充颜⾊% MarkerEdgeColor :点边框颜⾊例 6结果:例 7结果:clear allx=-pi:pi/10:pi;y=[sin(x);sin(x+3);sin(x+5)];z=[cos(x);cos(x+3);cos(x+5)];figure;plot(x,y,'r:*',x,z,'g-.v');% r 是红⾊,:是点线,*是星号标记% g 是绿⾊,-.是点画线,v 是倒三⾓形% 绘制双坐标轴figureangl=0:0.01*pi:2*pi;ampl=sin(0:0.01*pi:2*pi);z=ampl.*(cos(angl)+sqrt(-1)*sin(angl));[AX,H1,H2]=plotyy(0:200,abs(z),0:200,angle(z)*180/pi);% angle ⽤来求复数矩阵相位⾓的弧度值,其取值为-pi 到pi ,z 是⼀个复数,abs(z)是复数的模set(get(AX(1),'Ylabel'),'String','amplitude') % amplitude 振幅set(get(AX(2),'Ylabel'),'String','phase') % phase 阶段% get 返回某些对象属性的当前值set(H1,'LineWidth',3);set(H2,'LineStyle',':','LineWidth',3)例 8结果1:结果2:% x 轴对数坐标x=10.^(0.1:0.1:4);y=1./(x+1000);figuresubplot(1,2,1);semilogx(x,y,'+','MarkerSize',5,'LineWidth',2);title('y=(x+1000)^{-1}')subplot(1,2,2);plot(x,y,'+','MarkerSize',5,'LineWidth',2);title('y=(x+1000)^{-1}')% y 轴对数坐标同理% x 轴和y 轴均为对数坐标a=0.1:0.1:5;x=log10(a);y=10.^a;figuresubplot(1,2,1)loglog(x,y,'+','MarkerSize',5,'LineWidth',2)title('lgy=10^x')subplot(1,2,2)plot(x,y,'+','MarkerSize',5,'LineWidth',2)title('lgy=10^x')例 9结果:例 10结果:y=[75.995,91.972,105.711,123.203,131.669...150.697,179.323,203.212,226.505,249.633,281.422];figure;bar(y);x=-2:2;Y=[6,8,7,4,5;4,8,1,12,0;4,6,21,1,3];subplot(1,2,1),bar(x',Y','stacked')xlabel('x'),ylabel('\Sigma y'),colormap(cool)legend('因素 1','因素 2','因素 3')subplot(1,2,2),barh(x',Y','grouped') % barh 创建⽔平直⽅图xlabel('y'),ylabel('x')例 11结果:例 12结果:例 13x=[1,5,0.5,3.5,2];explode=[0,1,0,0,0];pie(x,explode) % 饼图colormap jetfigurepie3(x,explode)colormap hsvx=-4:0.1:4;y=randn(5000,1);hist(y,x) % 直⽅图clearfigure;结果:三维图例 1结果:例 2结果:figure;x=[1,5,6,7,9,5,1,3,12,20];y=[20,15,6,3,1,5,3,0,1,5];subplot(121);scatter(x,y); % 散点图subplot(122);scatter(x,y,[],[1,0,0],'fill');theta=0:0.01*pi:2*pi;x=sin(theta);y=cos(theta);z=cos(4*theta);figureplot3(x,y,z,'LineWidth',2);hold on;theta=0:0.02*pi:2*pi;x=sin(theta);y=cos(theta);z=cos(4*theta);plot3(x,y,z,'rd','MarkerSize',10,'LineWidth',2)X=-10:0.1:10;Y=-10:0.1:10;[X,Y]=meshgrid(X,Y);Z=-X.^2-Y.^2+200;mesh(X,Y,Z)例 3结果:例 4···[X,Y,Z]=peaks(30); %peaks 函数是⼀个典型的多元函数,本质上是⼀个⼆元⾼斯分布的概率密度函数subplot(1,2,1);surfl(X,Y,Z),colormap(copper),title('Default Lighting'),shading interpsubplot(1,2,2);surfl(X,Y,Z,[-90,30],[.55,.6,2,10]),shading interp···结果:figuresurf(X,Y,Z,'FaceColor','red','EdgeColor','none');camlight left; % 左侧加⼀个发光物体lighting phong % 光照模式,使图表⾯光滑细腻,⾊彩丰富view(-15,65) % 视⾓的⾓度例 5结果:例 6结果:% 等⾼线图[X,Y,Z]=peaks(30);figuresubplot(2,2,1);contour(X,Y,Z);axis square subplot(2,2,2);contour(X,Y,Z,10);axis squaresubplot(2,2,3);contour(X,Y,Z,-10:1:10);axis square subplot(2,2,4);contour(X,Y,Z,':');axis square[X,Y,Z]=peaks(30);R=sqrt(X.^2+Y.^2);subplot(1,2,1);surf(X,Y,Z,Z);axis tightsubplot(1,2,2);surf(X,Y,Z,R);axis tight。
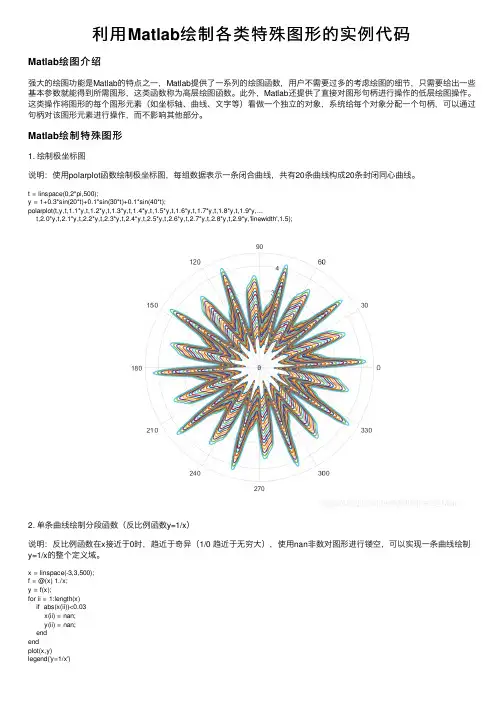
利⽤Matlab绘制各类特殊图形的实例代码Matlab绘图介绍强⼤的绘图功能是Matlab的特点之⼀,Matlab提供了⼀系列的绘图函数,⽤户不需要过多的考虑绘图的细节,只需要给出⼀些基本参数就能得到所需图形,这类函数称为⾼层绘图函数。
此外,Matlab还提供了直接对图形句柄进⾏操作的低层绘图操作。
这类操作将图形的每个图形元素(如坐标轴、曲线、⽂字等)看做⼀个独⽴的对象,系统给每个对象分配⼀个句柄,可以通过句柄对该图形元素进⾏操作,⽽不影响其他部分。
Matlab绘制特殊图形1. 绘制极坐标图说明:使⽤polarplot函数绘制极坐标图,每组数据表⽰⼀条闭合曲线,共有20条曲线构成20条封闭同⼼曲线。
t = linspace(0,2*pi,500);y = 1+0.3*sin(20*t)+0.1*sin(30*t)+0.1*sin(40*t);polarplot(t,y,t,1.1*y,t,1.2*y,t,1.3*y,t,1.4*y,t,1.5*y,t,1.6*y,t,1.7*y,t,1.8*y,t,1.9*y,...t,2.0*y,t,2.1*y,t,2.2*y,t,2.3*y,t,2.4*y,t,2.5*y,t,2.6*y,t,2.7*y,t,2.8*y,t,2.9*y,'linewidth',1.5);2. 单条曲线绘制分段函数(反⽐例函数y=1/x)说明:反⽐例函数在x接近于0时,趋近于奇异(1/0 趋近于⽆穷⼤),使⽤nan⾮数对图形进⾏镂空,可以实现⼀条曲线绘制y=1/x的整个定义域。
x = linspace(-3,3,500);f = @(x) 1./x;y = f(x);for ii = 1:length(x)if abs(x(ii))<0.03x(ii) = nan;y(ii) = nan;endendplot(x,y)legend('y=1/x')3. 正⽅体内绘制随机分布的颜⾊⽚图说明:使⽤plot3绘制正⽅体12条边,使⽤fill3函数绘制颜⾊⽚,颜⾊⽚位置和填充颜⾊随机⽣成。
1-32是:图形应用篇33-66是:界面设计篇67-84是:图形处理篇85-100是:数值分析篇实例2:三角函数曲线(2)function shili02h0=figure('toolbar','none',...'position',[200 150 450 350],...'name','实例02');x=-pi:0.05:pi;y=sin(x)+cos(x);plot(x,y,'-*r','linewidth',1);grid onxlabel('自变量X');ylabel('函数值Y');title('三角函数');实例3:图形的叠加function shili03h0=figure('toolbar','none',...'position',[200 150 450 350],...'name','实例03');x=-pi:0.05:pi;y1=sin(x);y2=cos(x);plot(x,y1,...'-*r',...x,y2,...'--og');grid onxlabel('自变量X');ylabel('函数值Y');title('三角函数');实例4:双y轴图形的绘制function shili04h0=figure('toolbar','none',...'position',[200 150 450 250],...'name','实例04');x=0:900;a=1000;b=0.005;y1=2*x;y2=cos(b*x);[haxes,hline1,hline2]=plotyy(x,y1,x,y2,'semilogy','plot'); axes(haxes(1))ylabel('semilog plot');axes(haxes(2))ylabel('linear plot');实例6:图形标注function shili06h0=figure('toolbar','none',...'position',[200 150 450 400],...'name','实例06');t=0:pi/10:2*pi;h=plot(t,sin(t));xlabel('t=0到2\pi','fontsize',16);ylabel('sin(t)','fontsize',16);title('\it{从0to2\pi 的正弦曲线}','fontsize',16)x=get(h,'xdata');y=get(h,'ydata');imin=find(min(y)==y);imax=find(max(y)==y);text(x(imin),y(imin),...['\leftarrow最小值=',num2str(y(imin))],...'fontsize',16)text(x(imax),y(imax),...['\leftarrow最大值=',num2str(y(imax))],...'fontsize',16)实例7:条形图形function shili07h0=figure('toolbar','none',...'position',[200 150 450 350],...'name','实例07');tiao1=[562 548 224 545 41 445 745 512];tiao2=[47 48 57 58 54 52 65 48];t=0:7;bar(t,tiao1)xlabel('X轴');ylabel('TIAO1值');h1=gca;h2=axes('position',get(h1,'position'));plot(t,tiao2,'linewidth',3)set(h2,'yaxislocation','right','color','none','xticklabel',[]) 实例8:区域图形function shili08h0=figure('toolbar','none',...'position',[200 150 450 250],...'name','实例08');x=91:95;profits1=[88 75 84 93 77];profits2=[51 64 54 56 68];profits3=[42 54 34 25 24];profits4=[26 38 18 15 4];area(x,profits1,'facecolor',[0.5 0.9 0.6],...'edgecolor','b',...'linewidth',3)hold onarea(x,profits2,'facecolor',[0.9 0.85 0.7],...'edgecolor','y',...'linewidth',3)hold onarea(x,profits3,'facecolor',[0.3 0.6 0.7],...'edgecolor','r',...'linewidth',3)hold onarea(x,profits4,'facecolor',[0.6 0.5 0.9],...'edgecolor','m',...'linewidth',3)hold offset(gca,'xtick',[91:95])set(gca,'layer','top')gtext('\leftarrow第一季度销量')gtext('\leftarrow第二季度销量')gtext('\leftarrow第三季度销量')gtext('\leftarrow第四季度销量')xlabel('年','fontsize',16);ylabel('销售量','fontsize',16);实例9:饼图的绘制function shili09h0=figure('toolbar','none',...'position',[200 150 450 250],...'name','实例09');t=[54 21 35;68 54 35;45 25 12;48 68 45;68 54 69];x=sum(t);h=pie(x);textobjs=findobj(h,'type','text');str1=get(textobjs,{'string'});val1=get(textobjs,{'extent'});oldext=cat(1,val1{:});names={'商品一:';'商品二:';'商品三:'};str2=strcat(names,str1);set(textobjs,{'string'},str2)val2=get(textobjs,{'extent'});newext=cat(1,val2{:});offset=sign(oldext(:,1)).*(newext(:,3)-oldext(:,3))/2; pos=get(textobjs,{'position'});textpos=cat(1,pos{:});textpos(:,1)=textpos(:,1)+offset;set(textobjs,{'position'},num2cell(textpos,[3,2]))实例10:阶梯图function shili10h0=figure('toolbar','none',...'position',[200 150 450 400],...'name','实例10');a=0.01;b=0.5;t=0:10;f=exp(-a*t).*sin(b*t);stairs(t,f)hold onplot(t,f,':*')hold offglabel='函数e^{-(\alpha*t)}sin\beta*t的阶梯图'; gtext(glabel,'fontsize',16)xlabel('t=0:10','fontsize',16)axis([0 10 -1.2 1.2])实例11:枝干图function shili11h0=figure('toolbar','none',...'position',[200 150 450 350],...'name','实例11');x=0:pi/20:2*pi;y1=sin(x);y2=cos(x);h1=stem(x,y1+y2);hold onh2=plot(x,y1,'^r',x,y2,'*g');hold offh3=[h1(1);h2];legend(h3,'y1+y2','y1=sin(x)','y2=cos(x)') xlabel('自变量X');ylabel('函数值Y');title('正弦函数与余弦函数的线性组合'); 实例12:罗盘图function shili12h0=figure('toolbar','none',...'position',[200 150 450 250],...'name','实例12');winddirection=[54 24 65 84256 12 235 62125 324 34 254];windpower=[2 5 5 36 8 12 76 14 10 8];rdirection=winddirection*pi/180;[x,y]=pol2cart(rdirection,windpower); compass(x,y);desc={'风向和风力','北京气象台','10月1日0:00到','10月1日12:00'};gtext(desc)实例13:轮廓图function shili13h0=figure('toolbar','none',...'position',[200 150 450 250],...'name','实例13');[th,r]=meshgrid((0:10:360)*pi/180,0:0.05:1); [x,y]=pol2cart(th,r);z=x+i*y;f=(z.^4-1).^(0.25);contour(x,y,abs(f),20)axis equalxlabel('实部','fontsize',16);ylabel('虚部','fontsize',16);h=polar([0 2*pi],[0 1]);delete(h)hold oncontour(x,y,abs(f),20)实例14:交互式图形function shili14h0=figure('toolbar','none',...'position',[200 150 450 250],...'name','实例14');axis([0 10 0 10]);hold onx=[];y=[];n=0;disp('单击鼠标左键点取需要的点'); disp('单击鼠标右键点取最后一个点'); but=1;while but==1[xi,yi,but]=ginput(1);plot(xi,yi,'bo')n=n+1;disp('单击鼠标左键点取下一个点');x(n,1)=xi;y(n,1)=yi;endt=1:n;ts=1:0.1:n;xs=spline(t,x,ts);ys=spline(t,y,ts);plot(xs,ys,'r-');hold off实例14:交互式图形function shili14h0=figure('toolbar','none',...'position',[200 150 450 250],...'name','实例14');axis([0 10 0 10]);hold onx=[];y=[];n=0;disp('单击鼠标左键点取需要的点'); disp('单击鼠标右键点取最后一个点'); but=1;while but==1[xi,yi,but]=ginput(1);plot(xi,yi,'bo')n=n+1;disp('单击鼠标左键点取下一个点');x(n,1)=xi;y(n,1)=yi;endt=1:n;ts=1:0.1:n;xs=spline(t,x,ts);ys=spline(t,y,ts);plot(xs,ys,'r-');hold off实例15:变换的傅立叶函数曲线function shili15h0=figure('toolbar','none',...'position',[200 150 450 250],...'name','实例15');axis equalm=moviein(20,gcf);set(gca,'nextplot','replacechildren')h=uicontrol('style','slider','position',...[100 10 500 20],'min',1,'max',20)for j=1:20plot(fft(eye(j+16)))set(h,'value',j)m(:,j)=getframe(gcf);endclf;axes('position',[0 0 1 1]);movie(m,30)实例16:劳伦兹非线形方程的无序活动function shili15h0=figure('toolbar','none',...'position',[200 150 450 250],...'name','实例15');axis equalm=moviein(20,gcf);set(gca,'nextplot','replacechildren') h=uicontrol('style','slider','position',...[100 10 500 20],'min',1,'max',20) for j=1:20plot(fft(eye(j+16)))set(h,'value',j)m(:,j)=getframe(gcf);endclf;axes('position',[0 0 1 1]);movie(m,30)实例17:填充图function shili17h0=figure('toolbar','none',...'position',[200 150 450 250],...'name','实例17');t=(1:2:15)*pi/8;x=sin(t);y=cos(t);fill(x,y,'r')axis square offtext(0,0,'STOP',...'color',[1 1 1],...'fontsize',50,...'horizontalalignment','center') 例18:条形图和阶梯形图function shili18h0=figure('toolbar','none',...'position',[200 150 450 250],...'name','实例18');subplot(2,2,1)x=-3:0.2:3;y=exp(-x.*x);bar(x,y)title('2-D Bar Chart')subplot(2,2,2)x=-3:0.2:3;y=exp(-x.*x);bar3(x,y,'r')title('3-D Bar Chart')subplot(2,2,3)x=-3:0.2:3;y=exp(-x.*x);stairs(x,y)title('Stair Chart')subplot(2,2,4)x=-3:0.2:3;y=exp(-x.*x);barh(x,y)title('Horizontal Bar Chart')实例19:三维曲线图function shili19h0=figure('toolbar','none',...'position',[200 150 450 400],...'name','实例19');subplot(2,1,1)x=linspace(0,2*pi);y1=sin(x);y2=cos(x);y3=sin(x)+cos(x);z1=zeros(size(x));z2=0.5*z1;z3=z1;plot3(x,y1,z1,x,y2,z2,x,y3,z3)grid onxlabel('X轴');ylabel('Y轴');zlabel('Z轴');title('Figure1:3-D Plot')subplot(2,1,2)x=linspace(0,2*pi);y1=sin(x);y2=cos(x);y3=sin(x)+cos(x);z1=zeros(size(x));z2=0.5*z1;z3=z1;plot3(x,z1,y1,x,z2,y2,x,z3,y3)grid onxlabel('X轴');ylabel('Y轴');zlabel('Z轴');title('Figure2:3-D Plot')实例20:图形的隐藏属性function shili20h0=figure('toolbar','none',...'position',[200 150 450 300],...'name','实例20');subplot(1,2,1)[x,y,z]=sphere(10);mesh(x,y,z)axis offtitle('Figure1:Opaque')hidden onsubplot(1,2,2)[x,y,z]=sphere(10);mesh(x,y,z)axis offtitle('Figure2:Transparent')hidden off实例21PEAKS函数曲线function shili21h0=figure('toolbar','none',...'position',[200 100 450 450],...'name','实例21');[x,y,z]=peaks(30);subplot(2,1,1)x=x(1,:);y=y(:,1);i=find(y>0.8&y<1.2);j=find(x>-0.6&x<0.5);z(i,j)=nan*z(i,j);surfc(x,y,z)xlabel('X轴');ylabel('Y轴');zlabel('Z轴');title('Figure1:surfc函数形成的曲面')subplot(2,1,2)x=x(1,:);y=y(:,1);i=find(y>0.8&y<1.2);j=find(x>-0.6&x<0.5);z(i,j)=nan*z(i,j);surfl(x,y,z)xlabel('X轴');ylabel('Y轴');zlabel('Z轴');title('Figure2:surfl函数形成的曲面') 实例22:片状图function shili22h0=figure('toolbar','none',...'position',[200 150 550 350],...'name','实例22');subplot(1,2,1)x=rand(1,20);y=rand(1,20);z=peaks(x,y*pi);t=delaunay(x,y);trimesh(t,x,y,z)hidden offtitle('Figure1:Triangular Surface Plot');subplot(1,2,2)x=rand(1,20);y=rand(1,20);z=peaks(x,y*pi);t=delaunay(x,y);trisurf(t,x,y,z)title('Figure1:Triangular Surface Plot'); 实例23:视角的调整function shili23h0=figure('toolbar','none',...'position',[200 150 450 350],...'name','实例23');x=-5:0.5:5;[x,y]=meshgrid(x);r=sqrt(x.^2+y.^2)+eps;z=sin(r)./r;subplot(2,2,1)surf(x,y,z)xlabel('X-axis')ylabel('Y-axis')zlabel('Z-axis')title('Figure1')view(-37.5,30)subplot(2,2,2)surf(x,y,z)xlabel('X-axis')ylabel('Y-axis')zlabel('Z-axis')title('Figure2')view(-37.5+90,30)subplot(2,2,3)surf(x,y,z)xlabel('X-axis')ylabel('Y-axis')zlabel('Z-axis')title('Figure3')view(-37.5,60)subplot(2,2,4)surf(x,y,z)xlabel('X-axis')ylabel('Y-axis')zlabel('Z-axis')title('Figure4')view(180,0)实例24:向量场的绘制function shili24h0=figure('toolbar','none',...'position',[200 150 450 350],...'name','实例24');subplot(2,2,1)z=peaks;ribbon(z)title('Figure1')subplot(2,2,2)[x,y,z]=peaks(15);[dx,dy]=gradient(z,0.5,0.5);contour(x,y,z,10)hold onquiver(x,y,dx,dy)hold offtitle('Figure2')subplot(2,2,3)[x,y,z]=peaks(15);[nx,ny,nz]=surfnorm(x,y,z);surf(x,y,z)hold onquiver3(x,y,z,nx,ny,nz)hold offtitle('Figure3')subplot(2,2,4)x=rand(3,5);y=rand(3,5);z=rand(3,5);c=rand(3,5);fill3(x,y,z,c)grid ontitle('Figure4')实例25:灯光定位function shili25h0=figure('toolbar','none',...'position',[200 150 450 250],...'name','实例25');vert=[1 1 1;1 2 1;2 2 1;2 1 1;1 1 2;12 2;2 2 2;2 1 2];fac=[1 2 3 4;2 6 7 3;4 3 7 8;15 8 4;1 2 6 5;5 6 7 8];grid offsphere(36)h=findobj('type','surface');set(h,'facelighting','phong',...'facecolor',...'interp',...'edgecolor',[0.4 0.4 0.4],...'backfacelighting',...hold onpatch('faces',fac,'vertices',vert,...'facecolor','y');light('position',[1 3 2]);light('position',[-3 -1 3]);material shinyaxis vis3d offhold off实例26:柱状图function shili26h0=figure('toolbar','none',...'position',[200 50 450 450],...'name','实例26');subplot(2,1,1)x=[5 2 18 7 39 8 65 5 54 3 2];bar(x)xlabel('X轴');ylabel('Y轴');title('第一子图');subplot(2,1,2)y=[5 2 18 7 39 8 65 5 54 3 2];barh(y)xlabel('X轴');ylabel('Y轴');title('第二子图');实例27:设置照明方式function shili27h0=figure('toolbar','none',...'position',[200 150 450 350],...'name','实例27');subplot(2,2,1)spherecamlight leftcamlight rightlighting flatcolorbaraxis offtitle('Figure1')subplot(2,2,2)sphereshading flatcamlight leftcamlight rightlighting gouraudcolorbaraxis offtitle('Figure2')subplot(2,2,3)sphereshading interpcamlight rightcamlight leftlighting phongcolorbaraxis offtitle('Figure3')subplot(2,2,4)sphereshading flatcamlight leftcamlight rightlighting nonecolorbaraxis offtitle('Figure4')实例28:羽状图function shili28h0=figure('toolbar','none',...'position',[200 150 450 350],...'name','实例28');subplot(2,1,1)alpha=90:-10:0;r=ones(size(alpha));m=alpha*pi/180;n=r*10;[u,v]=pol2cart(m,n);feather(u,v)title('羽状图')axis([0 20 0 10])subplot(2,1,2)t=0:0.5:10;x=0.05+i;y=exp(-x*t);feather(y)title('复数矩阵的羽状图')实例29:立体透视(1)function shili29h0=figure('toolbar','none',...'position',[200 150 450 250],...'name','实例29');[x,y,z]=meshgrid(-2:0.1:2,...-2:0.1:2,...-2:0.1:2);v=x.*exp(-x.^2-y.^2-z.^2);grid onfor i=-2:0.5:2;h1=surf(linspace(-2,2,20),...linspace(-2,2,20),...zeros(20)+i);rotate(h1,[1 -1 1],30)dx=get(h1,'xdata');dy=get(h1,'ydata');dz=get(h1,'zdata');delete(h1)slice(x,y,z,v,[-2 2],2,-2)hold onslice(x,y,z,v,dx,dy,dz)hold offaxis tightview(-5,10)drawnowend实例30:立体透视(2)function shili30h0=figure('toolbar','none',...'position',[200 150 450 250],...'name','实例30');[x,y,z]=meshgrid(-2:0.1:2,...-2:0.1:2,...-2:0.1:2);v=x.*exp(-x.^2-y.^2-z.^2);[dx,dy,dz]=cylinder;slice(x,y,z,v,[-2 2],2,-2)for i=-2:0.2:2h=surface(dx+i,dy,dz);rotate(h,[1 0 0],90)xp=get(h,'xdata');yp=get(h,'ydata');zp=get(h,'zdata');delete(h)hold onhs=slice(x,y,z,v,xp,yp,zp);axis tightxlim([-3 3])view(-10,35)drawnowdelete(hs)hold offend实例31:表面图形function shili31h0=figure('toolbar','none',...'position',[200 150 550 250],...'name','实例31');subplot(1,2,1)x=rand(100,1)*16-8;y=rand(100,1)*16-8;r=sqrt(x.^2+y.^2)+eps;z=sin(r)./r;xlin=linspace(min(x),max(x),33); ylin=linspace(min(y),max(y),33); [X,Y]=meshgrid(xlin,ylin);Z=griddata(x,y,z,X,Y,'cubic');mesh(X,Y,Z)axis tighthold onplot3(x,y,z,'.','Markersize',20)subplot(1,2,2)k=5;n=2^k-1;theta=pi*(-n:2:n)/n;phi=(pi/2)*(-n:2:n)'/n;X=cos(phi)*cos(theta);Y=cos(phi)*sin(theta);Z=sin(phi)*ones(size(theta)); colormap([0 0 0;1 1 1])C=hadamard(2^k);surf(X,Y,Z,C)axis square实例32:沿曲线移动的小球h0=figure('toolbar','none',...'position',[198****8468],...'name','实例32');h1=axes('parent',h0,...'position',[0.15 0.45 0.7 0.5],...'visible','on');t=0:pi/24:4*pi;y=sin(t);plot(t,y,'b')n=length(t);h=line('color',[0 0.5 0.5],...'linestyle','.',...'markersize',25,...'erasemode','xor');k1=uicontrol('parent',h0,...'style','pushbutton',...'position',[80 100 50 30],...'string','开始',...'callback',[...'i=1;',...'k=1;,',...'m=0;,',...'while 1,',...'if k==0,',...'break,',...'end,',...'if k~=0,',...'set(h,''xdata'',t(i),''ydata'',y(i)),',...'drawnow;,',...'i=i+1;,',...'if i>n,',...'m=m+1;,',...'i=1;,',...'end,',...'end,',...'end']);k2=uicontrol('parent',h0,...'style','pushbutton',...'position',[180 100 50 30],...'string','停止',...'callback',[...'k=0;,',...'set(e1,''string'',m),',...'p=get(h,''xdata'');,',...'q=get(h,''ydata'');,',...'set(e2,''string'',p);,',...'set(e3,''string'',q)']);k3=uicontrol('parent',h0,...'style','pushbutton',...'position',[280 100 50 30],...'string','关闭',...'callback','close');e1=uicontrol('parent',h0,...'style','edit',...'position',[60 30 60 20]);t1=uicontrol('parent',h0,...'style','text',...'string','循环次数',...'position',[60 50 60 20]);e2=uicontrol('parent',h0,...'style','edit',...'position',[180 30 50 20]);t2=uicontrol('parent',h0,...'style','text',...'string','终点的X坐标值',...'position',[155 50 100 20]);e3=uicontrol('parent',h0,...'style','edit',...'position',[300 30 50 20]);t3=uicontrol('parent',h0,...'style','text',...'string','终点的Y坐标值',...'position',[275 50 100 20]);实例33:曲线转换按钮h0=figure('toolbar','none',...'position',[200 150 450 250],...'name','实例33');x=0:0.5:2*pi;y=sin(x);h=plot(x,y);grid onhuidiao=[...'if i==1,',...'i=0;,',...'y=cos(x);,',...'delete(h),',...'set(hm,''string'',''正弦函数''),',...'h=plot(x,y);,',...'grid on,',...'else if i==0,',...'i=1;,',...'y=sin(x);,',...'set(hm,''string'',''余弦函数''),',...'delete(h),',...'h=plot(x,y);,',...'grid on,',...'end,',...'end'];hm=uicontrol(gcf,'style','pushbutton',...'string','余弦函数',...'callback',huidiao);i=1;set(hm,'position',[250 20 60 20]);set(gca,'position',[0.2 0.2 0.6 0.6])title('按钮的使用')hold on实例34:栅格控制按钮h0=figure('toolbar','none',...'position',[200 150 450 250],...'name','实例34');x=0:0.5:2*pi;y=sin(x);plot(x,y)huidiao1=[...'set(h_toggle2,''value'',0),',...'grid on,',...];huidiao2=[...'set(h_toggle1,''value'',0),',...'grid off,',...];h_toggle1=uicontrol(gcf,'style','togglebutton',...'string','grid on',...'value',0,...'position',[20 45 50 20],...'callback',huidiao1);h_toggle2=uicontrol(gcf,'style','togglebutton',...'string','grid off',...'value',0,...'position',[20 20 50 20],...'callback',huidiao2);set(gca,'position',[0.2 0.2 0.6 0.6])title('开关按钮的使用')实例35:编辑框的使用h0=figure('toolbar','none',...'position',[200 150 350 250],...'name','实例35');f='Please input the letter';huidiao1=[...'g=upper(f);,',...'set(h2_edit,''string'',g),',...];huidiao2=[...'g=lower(f);,',...'set(h2_edit,''string'',g),',...];h1_edit=uicontrol(gcf,'style','edit',...'position',[100 200 100 50],...'HorizontalAlignment','left',...'string','Please input the letter',...'callback','f=get(h1_edit,''string'');',...'background','w',...'max',5,...'min',1);h2_edit=uicontrol(gcf,'style','edit',...'HorizontalAlignment','left',...'position',[100 100 100 50],...'background','w',...'max',5,...'min',1);h1_button=uicontrol(gcf,'style','pushbutton',...'string','小写变大写',...'position',[100 45 100 20],...'callback',huidiao1);h2_button=uicontrol(gcf,'style','pushbutton',...'string','大写变小写',...'position',[100 20 100 20],...'callback',huidiao2);实例36:弹出式菜单h0=figure('toolbar','none',...'position',[200 150 450 250],...'name','实例36');x=0:0.5:2*pi;y=sin(x);h=plot(x,y);grid onhm=uicontrol(gcf,'style','popupmenu',...'string',...'sin(x)|cos(x)|sin(x)+cos(x)|exp(-sin(x))',...'position',[250 20 50 20]);set(hm,'value',1)huidiao=[...'v=get(hm,''value'');,',...'switch v,',...'case 1,',...'delete(h),',...'y=sin(x);,',...'h=plot(x,y);,',...'grid on,',...'case 2,',...'delete(h),',...'y=cos(x);,',...'h=plot(x,y);,',...'grid on,',...'case 3,',...'delete(h),',...'y=sin(x)+cos(x);,',...'h=plot(x,y);,',...'grid on,',...'case 4,',...'delete(h),',...'y=exp(-sin(x));,',...'h=plot(x,y);,',...'grid on,',...'end'];set(hm,'callback',huidiao)set(gca,'position',[0.2 0.2 0.6 0.6]) title('弹出式菜单的使用')实例37:滑标的使用h0=figure('toolbar','none',...'position',[200 150 450 250],...'name','实例37');[x,y]=meshgrid(-8:0.5:8);r=sqrt(x.^2+y.^2)+eps;z=sin(r)./r;h0=mesh(x,y,z);h1=axes('position',...[0.2 0.2 0.5 0.5],...'visible','off');htext=uicontrol(gcf,...'units','points',...'position',[20 30 45 15],...'string','brightness',...'style','text');hslider=uicontrol(gcf,...'units','points',...'position',[10 10 300 15],...'min',-1,...'max',1,...'style','slider',...'callback',...'brighten(get(hslider,''value''))'); 实例38:多选菜单h0=figure('toolbar','none',...'position',[200 150 450 250],...'name','实例38');[x,y]=meshgrid(-8:0.5:8);r=sqrt(x.^2+y.^2)+eps;z=sin(r)./r;h0=mesh(x,y,z);hlist=uicontrol(gcf,'style','listbox',...'string','default|spring|summer|autumn|winter',...'max',5,...'min',1,...'position',[20 20 80 100],...'callback',[...'k=get(hlist,''value'');,',...'switch k,',...'case 1,',...'colormap default,',...'case 2,',...'colormap spring,',...'case 3,',...'colormap summer,',...'case 4,',...'colormap autumn,',...'case 5,',...'colormap winter,',...'end']);实例39:菜单控制的使用h0=figure('toolbar','none',...'position',[200 150 450 250],...'name','实例39');x=0:0.5:2*pi;y=cos(x);h=plot(x,y);grid onset(gcf,'toolbar','none')hm=uimenu('label','example');huidiao1=[...'set(hm_gridon,''checked'',''on''),',...'set(hm_gridoff,''checked'',''off''),',...'grid on'];huidiao2=[...'set(hm_gridoff,''checked'',''on''),',...'set(hm_gridon,''checked'',''off''),',...'grid off'];hm_gridon=uimenu(hm,'label','grid on',...'checked','on',...'callback',huidiao1);hm_gridoff=uimenu(hm,'label','grid off',...'checked','off',...'callback',huidiao2);实例40:UIMENU菜单的应用h0=figure('toolbar','none',...'position',[200 150 450 250],...'name','实例40');h1=uimenu(gcf,'label','函数');h11=uimenu(h1,'label','轮廓图',...'callback',[...'set(h31,''checked'',''on''),',...'set(h32,''checked'',''off''),',...'[x,y,z]=peaks;,',...'contour3(x,y,z,30)']);h12=uimenu(h1,'label','高斯分布',...'callback',[...'set(h31,''checked'',''on''),',...'set(h32,''checked'',''off''),',...'mesh(peaks);,',...'axis tight']);h13=uimenu(h1,'label','Sinc函数',...'callback',[...'set(h31,''checked'',''on''),',...'set(h32,''checked'',''off''),',...'[x,y]=meshgrid(-8:0.5:8);,',...'r=sqrt(x.^2+y.^2)+eps;,',...'z=sin(r)./r;,',...'mesh(x,y,z)']);h2=uimenu(gcf,'label','色彩');hl2(1)=uimenu(h2,'label','Default',...'checked','on',...'callback',...[...'set(hl2,''checked'',''off''),',...'set(hl2(1),''checked'',''on''),',...'colormap(''default'')']);hl2(2)=uimenu(h2,'label','spring',...'callback',...[...'set(hl2,''checked'',''off''),',...'set(hl2(2),''checked'',''on''),',...'colormap(spring)']);hl2(3)=uimenu(h2,'label','Summer',...'callback',...[...'set(hl2,''checked'',''off''),',...。

MATLAB绘图二维数据曲线图pplot函数的基本调用格式为:x,y) )plot(plot(x,y其中x和y为长度相同的向量,分别用于存储x坐标和y坐标数据。
数据例1 在0≤x2π区间内,绘制曲线y=2e-0.5x cos(4πx)1≤区间内绘制曲线205x(4)程序如下:x=0:pi/100:2*pi;cos(4*pi*x);0.5*x).*cos(4*pi*x);y=2*exp(--0.5*x).*y=2*exp(x,y))plot(x,yplot(x yplot(x y)例2 绘制曲线。
绘制曲线程序如下:t=0:0.1:2*pi;x=t.sin(3t);x=t*sin(3*t);y=t.*sin(t).*sin(t); plot(x,y););plot(x,y数最简单的调用格式是包含个输参数plot函数最简单的调用格式是只包含一个输入参数:p()plot(x)在这种情况下,当x是实向量时,以该向量元素的下标为横坐标,元素值为纵坐标画出条连续曲线,标为横坐标,元素值为纵坐标画出一条连续曲线,这实际上是绘制折线图。
绘制多根二维曲线1.plot函数的输入参数是矩阵形式时数的输参数是矩阵形式时(1) 当x是向量,y是有一维与x同维的矩阵时,则绘制出多根不同颜色的曲线。
曲线条数等于y矩阵的另一维数,x被作为这些曲线共同的横坐标。
(2) 当x,y是同维矩阵时,则以x,y对应列元素为横、纵坐标分别绘制曲线,曲线条数等于矩阵的列数。
纵坐标分别绘制曲线曲线条数等于矩阵的列数(3) 对只包含一个输入参数的plot函数,当输入参数对包含个输参数的数当输参数是实矩阵时,则按列绘制每列元素值相对其下标的曲线曲线条数等于输入参数矩阵的列数的曲线,曲线条数等于输入参数矩阵的列数。
当输入参数是复数矩阵时,则按列分别以元素实部和虚部为横、纵坐标绘制多条曲线。
2.含多个输入参数的plot函数含多个输参数的数调用格式为:plot(x1,y1,x2,y2,…,xn,yn)(1) 当输入参数都为向量时,x1和y1,x2和y2,…,(1)当输入参数都为向量时xn和yn分别组成一组向量对,每一组向量对的长度可以不同每一向量对可以绘制出一条曲线度可以不同。
Matlab图形绘制经典案例1、三维曲线>> t=0:pi/50:10*pi;>> plot3(sin(2*t),cos(2*t),t)>> axis square>> grid on2、一窗口多图形>> t=-2*pi:0.01:2*pi; >> subplot(3,2,1)>> plot(t,sin(t))>> subplot(3,2,2)>> plot(t,cos(t))>> subplot(3,2,3)>> plot(t,tan(t))>> axis([-pi pi -100 100]) >> subplot(3,2,4)>> plot(t,cot(t))>> axis([-pi pi -100 100]) >> subplot(3,2,5)>> plot(t,atan(t))>> subplot(3,2,6)>> plot(t,acot(t))3、图形样式、标注、题字(也可以利用菜单直接Insert) >> x=0:pi/20:2*pi;>> plot(x,sin(x),'b-.')>> hold on>> plot(x,cos(x),'r--')>> hold on>> plot(x,sin(x)-1,'g:')>> hold on>> plot(x,cos(x)-1)>> xlabel('x');>> xlabel('x轴');>> ylabel('y轴');>> title('图形样式、标注等');>> text(pi,sin(pi),'x=\pi');>> legend('sin(x)','cos(x)','sin(x)-1','cos(x)-1');>> [x1,y1]=ginput(1) %利用鼠标定位查找线上某点的值x1 =2.0893y1 =-0.5000>> gtext('x=2.5') %鼠标定位放置所需的值在线上4、>> fplot('[sin(x),cos(x),sqrt(x)-1]',[0 2*pi]) M文件:myfun.m内容如下:function y=myfun(x)y(:,1)=sin(x);y(:,2)=cos(x);y(:,3)=x^(1/2)-1;再运行:>> fplot('myfun',[0 2*pi])同样可以得到下图5、>> [x,y]=fplot('sin',[0 2*pi]); >> [x1,y1]=fplot('cos',[0 2*pi]); >> plot(x,y,'-r',x1,y1,'-.k')>> legend('y=sinx','y=cosx')6、>> x=[-2:0.2:2];>> y=exp(x)-sin(x);>> plot(x,y,'-or','linewidth',2)7、画出y1=6(sinx-cosx),y2=x2^x-1的图形>> x=[-3:0.1:3];>> y1=6*(sin(x)-cos(x));>> y2=x.*2.^x-1;>> plot(x,y1,'-r',x,y2,'-.k','linewidth',2)8、绘制心形图r=2(1-cosθ)的极坐标图形>> theta=[0:0.01:2*pi];>> polar(theta,2*(1-cos(theta)),'-k')>> polar(theta,2*(1-cos(theta)),'-or')9、用双轴对数坐标绘制y=x*3^x-30的图形>> x=logspace(-3,3);>> y=x.*3.^x-30;>> loglog(y,'-or','linewidth',2);>> grid on10、绘制数据向量的单轴对数坐标图形>> x=[1:50];>> y=[1:50];>> semilogx(x,y,'-*b')%绘制横轴为对数坐标%纵轴为线性坐标>> grid on>> semilogy(x,y,'-*b')%绘制纵轴为对数坐标%横轴为线性坐标>> grid on11、绘制矩阵的条形图,并求出句柄属性值向量。
Matlab绘图系列之高级绘图Matlab绘图系列之高级绘图一、目录1.彗星图二维彗星图三维彗星图2.帧动画3.程序动画4.色图变换5.V oronoi图和三角剖分V oronoi图三角剖分6.四面体7.彩带图彩带图三维流彩带图8.伪彩图9.切片图切片图切片轮廓线图10.轮廓图显示轮廓线显示围裙瀑布效果带光照模式的阴影图11.函数绘图轮廓线、网格图、曲面图、轮廓网格图轮廓曲面图、二维曲线、极坐标曲线图、自定义函数12.三维图形控制视点灯光效果色彩控制二、图形示例1.彗星图二维彗星图t=0:.01:2*pi;x=cos(2*t).*(cos(t).^2);y=sin(2*t).*(sin(t).^2);comet(x,y);title('二维彗星轨迹图')hold onplot(x,y)三维彗星图a=12;b=9;T0=2*pi;%T0是轨道的周期T=5*T0;dt=pi/100;t=[0:dt:T]';f=sqrt(a^2-b^2);%地球与另一焦点的距离th=12.5*pi/180;%未经轨道与x-y平面的倾角E=exp(-t/20);%轨道收缩率x=E.*(a*cos(t)-f);y=E.*(b*cos(th)*sin(t));z=E.*(b*sin(th)*sin(t));plot3(x,y,z,'g')%画全程轨线hold on,sphere(20);%画地球axis offtitle('卫星返回地球示例')x1=-18*T0;x2=6*T0;y1=-12*T0;y2=12*T0;z1=-6*T0;z2=6*T0;axis([x1 x2 y1 y2 z1 z2])% axis([-15 10 -15 10 -10 10])axis equalcomet3(x,y,z,0.02);%画运动轨线hold off2.帧动画Z=peaks;surf(Z)%绘制网格表面图axis tightset(gca,'nextplot','replacechildren');%设定axis覆盖重画模式title('帧动画播放示例')for j=1:20surf(sin(2*pi*j/20)*Z,Z)%重新绘制网格表面图,这里后面一个Z 当成了颜色矩阵F(j)=getframe;%创建帧endmovie(F,20)%播放动画20次3.程序动画t=0:pi/50:10*pii=1;h=plot3(sin(t(i)),cos(t(i)),t(i),'*','erasemode','none');%设定擦除模式grid onaxis([-2 2 -2 2 -1 10*pi])title('程序动画示例')for i=2:length(t)set(h,'xdata',sin(t(i)),'ydata',cos(t(i)),'zdata',t(i));drawnowpause(0.01)end4.色图变换load spineimage(X)colormap coolspinmap(10)5.V oronoi图和三角剖分V oronoi图rand('state',5)x=rand(1,10);y=rand(1,10);subplot(131)voronoi(x,y);%绘制voronoi图形axis equalaxis([-0.2 1.6 -0.5 2.5])subplot(132)[vx,vy]=voronoi(x,y);plot(x,y,'r+',vx,vy,'b-');%应用返回值绘制axis equalaxis([-0.2 1.6 -0.5 2.5])subplot(133)rand('state',5);x=rand(10,2);[v,c]=voronoin(x);%返回值v参数维voronoi顶点矩阵,返回值c参数为voronoi元胞数组for i=1:length(c)if all(c{i}~=1)patch(v(c{i},1),v(c{i},2),i);%应用色图iendendaxis equalaxis([-0.2 1.6 -0.5 2.5])box on三角剖分[x,y]=meshgrid(1:15,1:15);tri=delaunay(x,y);z=peaks(15);trimesh(tri,x,y,z)6.四面体d=[-1 1];[x,y,z]=meshgrid(d,d,d);%定义一个立方体x=[x(:);0];y=[y(:);0];z=[z(:);0];%[x,y,z]分别为加上中心的立方体顶点X=[x(:) y(:) z(:)];Tes=delaunayn(X);%返回m×n的数组值tetramesh(Tes,X);%绘制四面体图camorbit(20,0);%旋转摄像目标位置7.彩带图彩带图[x,y]=meshgrid(-3:.5:3,-3:.1:3);z=peaks(x,y);ribbon(y,z)三维流彩带图load wind%打开保存的数据lims=[100.64 116.67 17.25 28.75 -0.02 6.86];%定义坐标轴范围[x,y,z,u,v,w]=subvolume(x,y,z,u,v,w,lims);%lims来定义数据子集[sx sy sz]=meshgrid(110,20:5:30,1:5);%定义网格点verts=stream3(x,y,z,u,v,w,sx,sy,sz,.5);%计算彩带顶点cav=curl(x,y,z,u,v,w);%计算卷曲角速度wind_speed=sqrt(u.^2+v.^2+w.^2);%计算流速h=streamribbon(verts,x,y,z,cav,wind_speed,2);%绘制流彩带图view(3)8.伪彩图n=6%定义轮数r=(0:n)'/n;%定义轮的半径theta=pi*(-n:n)/n;%定义轮的扇区角X=r*cos(theta);Y=r*sin(theta);%定义网格顶点C=r*cos(2*theta);%定义色图pcolor(X,Y,C)%绘制伪彩图axis equal tight 9.切片图切片图[x,y,z] = meshgrid(-2:.2:2,-2:.25:2,-2:.16:2);v = x.*exp(-x.^2-y.^2-z.^2);xslice = [-1.2,.8,2]; yslice = 2; zslice = [-2,0];slice(x,y,z,v,xslice,yslice,zslice)colormap hsv切片轮廓线图[x y z v]=flow;%打开水流数据h=contourslice(x,y,z,v,[1:9],[],[0],linspace(-8,2,10));%切片轮廓线view([-12 30])10.轮廓图显示轮廓线[x,y,z]=peaks;subplot(1,2,1)meshc(x,y,z);%同时画出网格图与轮廓线title('meshc 网格图与轮廓线')axis([-inf inf -inf inf -inf inf]);subplot(1,2,2)surfc(x,y,z);%同时画出曲面图与轮廓线title('surfc 曲面图与轮廓线')axis([-inf inf -inf inf -inf inf]);显示围裙[x y z]=peaks;meshz(x,y,z);瀑布效果[X,Y,Z]=peaks(30);waterfall(X,Y,Z)带光照模式的阴影图[x,y]=meshgrid(-3:1/8:3);z=peaks(x,y);surfl(x,y,z);shading interp%着色处理colormap(gray);%灰度处理axis([-3 3 -3 3 -8 8])11.函数绘图轮廓线、网格图、曲面图、轮廓网格图%图1绘制轮廓线、网格图、曲面图、轮廓网格图subplot(221)f=['3*(1-x)^2*exp(-(x^2)-(y+1)^2)-10*(x/5-x^3-y^5)*exp(-x^2-y^2)-1/3*exp(-(x+1)^2-y^2)'];%定义双变量x、y的函数式ezcontour(f,[-3,3],49)%x、y为[-3 3],网格为49×49 subplot(222) ezmesh('sqrt(x^2+y^2)');subplot(223)ezsurf('real(atan(x+i*y))')%经过滤波,如果相同数据surf绘图没有滤波subplot(224)ezmeshc('y/(1+x^2+y^2)',[-5,5,-2*pi,2*pi])%x、y的数值范围分别为[-5 5]、[-2*pi 2*pi]轮廓曲面图、二维曲线、极坐标曲线图、自定义函数%图2绘制轮廓曲面图、二维曲线、极坐标曲线图、自定义函数figure(2)subplot(221)ezsurfc('sin(u)*sin(v)')subplot(222)ezplot('x^2-y^4');subplot(223)ezpolar('1+cos(t)')subplot(224)fplot('myfun',[-20 20])function Y=myfun(x)Y(:,1)=200*sin(x(:))./x(:);Y(:,2)=x(:).^2;三维曲线图%绘制三维曲线图figure(3)ezplot3('sin(t)','cos(t)','t',[0,6*pi])12.三维图形控制视点View图形旋转subplot(121)surf(peaks);title('旋转前图形');subplot(122)h=surf(peaks);rotate(h,[1 0 1],180)title('旋转后图形');灯光效果%灯光效果(1)camlight(2)light(3)lightangle(4)lighting(5)materialsphere;camlight色彩控制%色彩控制(1)缺省设置colordef、whitebg(2)色图colormap(3)浓淡处理shadingload flujetimage(X)colormap(jet)subplot(131)sphere(16)axis squareshading flattitle('Flat Shading')subplot(132)sphere(16)axis squareshading facetedtitle('Faceted Shading')subplot(133)sphere(16)axis squareshading interptitle('Interpolated Shading')。
MATLAB绘图案例1. 三维曲线» t=0:pi/50:10*pi;»plot3(sin(2*t),cos(2*t)Λ)» axis SqUare» grid On2、一窗口多图形»t=-2*pi:0.01:2*pi;» SUbPIot(321)» plot(t,sin(t))» SUbPIOt(3,2,2)» plot(tcos(t))» SlIbPIot(3,2,3)» plot(t z tan(t))» axis([-pipi -100 100])» SUbPIot(3,2,4)» plot(tcot(t))»axis([ψi Pi -100 IOOl)» SUbPIot(325)»plot(ζatan(t))» SUbPIOt(3,2,6)» plot(tacot(t))3、图形样式、标注、题字 (也可以利用菜单直接InSert) »x=0:pi/20:2*pi;» Plotfx z Sin(X)Zb-.')» hold On» Plotfx z Cos(X)Zr-')» hold On» PIOt(X,s∣n(x)-l∕g:1)MATLAB绘用案例» hold On» PIOt(X Z COS(X)-I)>>×label(,x,);>>xlabel(,x 轴,);» ylabel(,y 轴» tide('图形样式、标注等J;»text(PLSin(Pi)∕x=∖pi');»Iegend(I Sin(x)7COS(X)l∕sin(x)-l l∕cos(x)-l l);» [xXyl]=ginput(l) %利用R l标定位査找线上某点的值xl =2.0893yi =-0.5000» gte×t(,x=2.5,)%鼠标定位放置所盂的值在线上4.»fplot(,[sin(x)Λθs(×hSqrt(X)-l]∖[0 2*pi])M 文件:myfun.m内容如下:function y=myfun(x)y(:, I)=Sin(x);y(:,2)=COS(x);y(:,3)二T(l∕2)-1;再运行•:»fplot(,myfun',[0 2*pi])同样可以得到右图5、»[×,y]=⅛lot(,sin,40 2*pi]);»[×l,yl]=fplot('cos'40 2*pi]);6.» PIOt(X z y,,-r∖xXyl,'-.k,)»Iegend(,y=sinx,∕y=cos×,)MATLAB绘用案例>> X=卜2:0.2:2];» y=exp(x)-sin(x);» PlOt(X j y∕-or l∕linewidth∖2)7^ 画出yl=6(sinx-COSX)z y2 =×2ΛX-1的图形>> X=卜3:0.1:3];» yl=6*(sin(x)-cos(x));» y2=x.*2.A x-l;» PlOt(X z yl∕-r l p<,y2∕-k7∣inewidth l,2)8、绘制心形图“2⑴O)Se)的极坐标图形»theta=[0:0.01:2*pi|;» PoIar(theta z2*(l-cos(theta)),,-k')» polar(theta,2*(l-cos(theta))∕-or,)90 42709、用双轴对数坐标绘制y=x*3^x-30的图形» x=lOgSPaCel ・3,3);» y=×.*3.^x-30;»IOglOg(y∕-or,∕linewidth∖2);» grid OnMATLAB绘图案例10.绘制数据向最的单轴对数坐标图形»x=[l:50];» y=[150];» SemilOg×(x z y∕-*b,)%绘制横轴为对数坐标%纵轴为线性坐标» grid On»SemilOgy(X√∕-*b')%绘制纵轴为对•数坐标%横轴为线性坐标» grid On□、绘制矩阵A=(: 5 I)的条形图, \7 8 9/并求出句柄属性值向量。