Abstract Charge Balancing Fill Rate Monitor
- 格式:pdf
- 大小:30.44 KB
- 文档页数:2


文献出处:标题 : A ssessm ent of Financial R isk in Firm 's Profitability A naly sis作者 : S olomon, Daniela C ristina; M untean, M i rcea出版物名称 : Economy Transdisciplinarity C og nition卷 : 15期 : 2页 : 58 -67页数 : 10出版年份 : 2012A ssessm en t of F in a n c ia l R isk in F ir m ' s P r ofita b i l i t y A n a ly sisA bstract: In the contex t of g lobalization w e are w i tnessing an unprecedented diversification of risk situations and uncertainty in the business w orld, the w hole ex i stence of an org anization being related to risk . The notion of risk i s inextricably l inked to the return. R eturn includes ensuring remuneration of production factors and invested capital but a lso resources manag em ent in terms of efficiency and effectiveness. A full financial and econom ic diag nosis can not be done w i thout reg a rd to the return-risk ra tio.S tock profitability analy s i s should not be dissociated from risk analy s i s to w hich the com pany i s subdued. R isk analy sis i s useful in decision making concerning the use of economic-financial potential or investm ent decisions, in developing business plans, and a lso to inform partners about the enterprise's performa nce level.R i sk takes many form:, operational risk, financial risk and tota l risk , risk of bankruptcy ( other risk categ ories) each influencing the business activity on a g reater or lesser extent. Financial risk analy s i s, realized w i th the use of specific indicators such as: financial leverag e , financial breakeven and leverag e ra tio ( C LF) accompany ing call to debt, presents a major interest to optim ize the financial s tructure and viability of any com pany operating under a g enuine m arket econom y .Key w ords: risk analy sis fina ncial risk , financial leverag e , breakeven point.IntroductionR i sk and return a re tw o interdependent aspects in the activity of a com pany , so the question i s assuming a certain level of risk to achieve the profitability that it a l low s. R eturn can only be assessed but on the basis of supported risk . This risk a ffects econom ic asset returns first, and secondly of capital invested. Therefore it can be addressed both in terms of business, as the org anizer of the production process driven by intention to increase property ow ners and adequate remuneration of production factors and the position of outside financial investors, interested in carry ing the best investm ent, in financial market conditions w i th several areas of return and different risk levels.R isk assessm ent should consider manag ing chang e : people chang e , methods chang e , the risks chang e [ 1 , 36 ] .C onsequently , profitability i s subject to the g eneral condition of risk w here the org anization operates. R i sk takes m any forms, each a ffecting the ag ents' econom ic activity on a lesser or g reater ex tent. For econom ic and financial analy sis a t the micro level presents a particular interest those form s of risk that ca n be influenced, in the sense of reduction, throug h the actions and measures the economic ag ents can underg o.1.. Financial R i sk in Economic Theory and PracticeFinancial activity , in i ts m any seg m ents is influenced by unex pectedly restrictive e lem ents as evolution, often unexpected, not depending directly on economic ag ents. Impact of various factors ( m a rket, competition, tim e factor,inflation, ex chang e rates, interest, com missions, human factors and not least the company culture) often mak es financial decision become a decision under risk.Financial risk characterizes variability in net profit, under the company 's financial structure. There a re no financial templa te features, each business activity prints i ts ow n sig nificant varia tions from case to case. In the case of reta i l ers, "intang ible assets a re less important, but stocks a re significant, and the appeal to credit provider is frequently used, being very useful for treasury business" [ 2 , 40 ] .A n optim a l capital structure w i l l max imize enterprise value by balancing the deg ree of risk and ex pected return rate.M anag em ent of financial risk is an integ ra l part of planning and financial control, subm itted to strateg ic and tactical decisions for a continuous adaptation to inside and outside company conditions, constantly chang ing and it requires:-identification of a reas that are prone to risk;-l ikelihood estima tion of financial risk production;-determining the independence relations betw een financial risk and other significant risks ( operational risk , market risk - interest rate fluctuations);-delim i ta tion of risk and keeping i t under observation to stop or diminish ( minim ize) the effect;-identify causal factors for financial risk, in order to define potential adverse effects induced on the overall activity of the company ;-determining the risk as quantifiable s i ze, as w ell as the effects associated to risk occurrence;-determining the routes to follow and strateg ies to fit the company 's financial activity in an area of financial certainty .Financial risk i ssues can be found a t the heart of R om anian accountant's norma l izors. A ccording to the OM PF 3055 /2 009 , the B oard m ust prepare for each financial y ear a report, called a M anag ers ' report, w hich must include, besides an accurate presentation of development and performance of the entity 's activity and i ts financial position, a lso a description of main risks and uncertainties that i t fa ces.Thus, M anag ers report must provide information on: the objectives and policies of the entity concerning financial risk m anag ement, including i ts policy for risk covering for each major ty pe of forecasted transaction for w hich risk coverag e accounting i s used, and entity 's exposure to market risk, credit risk , l i quidity risk and cash flow .R equired disclosures provide information to help users of financial statem ents in evaluating the risk financial instrum ents, recog nized or not in balance sheet.The m a in categ ories of financial risks a ffecting the company 's performance a re [ 3 ] :1 . M arket risk that com prises three ty pes of risk :0 currency risk - the risk that the value of a financial instrument { Financial instrum ent i s defined according OM FP 3055 /2 009 , A rt. 126 , as: ''... any contract that s im ultaneously g enerates a financial active for an entity and a financial debt or equity instrument for another entity ") w i l l fluctuate because of chang es in currency exchang e rates; the low ering of ex chang e rate can lead to a loss of value of assets denominated in foreig n currency thus influencing business perform ance;0 fa i r value interest rate risk - the risk that the value of a financial instrument w i l l fluctuate due to chang es in market interest ra tes;0 price risk - the risk that the value of a financial instrum ent w i l l fluctuate as a result of chang ing market prices, eveni f these chang es are caused by factors specific to individual instruments or their i ssuer, or factors a ffecting a l l instrum ents traded in the ma rket. The term "market risk " incorporates not only the potential loss but as w e l l the g a in.2.. C redit risk - the risk that a party of financial instrument w i l l not to com ply w i th the undertaking , causing the other party a financial loss.3.. Liquidity risk - ( a lso called funding risk) is risk that an entity meets in difficulties in procuring the necessary funds to m eet com mitm ents related to financial instrum ents. L iquidity risk ma y result from the inability to quickly se l l a financial asset a t a value close to i ts fa i r va lue.4.. Interest ra te risk from cash flow - i s the risk that future cash flow s w i l l fluctuate because of chang es in ma rket interest rates. For ex am ple, i f a variable rate debt instruments, such fluctuations a re to chang e the effective interest rate financial instrument, w i thout a corresponding chang e in its fa i r va lue.Financial environment i s characterized by a hig h interest rate volatility , w hich translates in term s of risk and indiscriminate harm s the va lue and profitability of any enterprise [ 4 , 89 ] . Interest ra te risk on the balance sheet i s reflected by chang es in m arket value of an asset, as the present value of an asset i s determ ined by discounting cash flow s using interest rate or w eig hted averag e cost of capital [ 5 , 89 ] .2 . Financial R isk A ssessmentFinancial risk assessm ent is performed by using specific indicators such as: financial leverag e, financial breakeven and leverag e factor ( C L F) w hose values ex press fluctuations in net profit, under the company 's financial structure chang e .Financial leverag e effectFinancial ri sk or capital concerns the com pany 's financial structure and depends on the manner of funding the activity : i f it is w holly financed by equity , i t w i l l not involve financial risk . This risk appears only if loan financing sources involving charg e to pay interest and show s a direct influence on financial profitability ( of equity ) [ 6 , 170 ] .Debt, the size and cost drives the variability of results and autom a tica l l y chang es the financial risk. The size of influence of financial structure on firm performance has produced financial leverag e effect, w hich can be defined as the m echanism throug h w hich debt a ffects return on equity , return on the ratio of benefits ( net income) and equity .B etw een economic profitability and financial return there i s a tig ht correlation. Financial return is rooted in economic returns. The difference betw een the tw o rates is g enerated by com pany policy options for funding . U sually , on equal economic rate return, financial profitability ra tes vary depending on finance source - from ow n equity or borrow ed capital.In econom ic theory the link betw een financial profitability ra te ( R f) and econom ic ra te of return ( R e) is hig hlig hted by the follow ing equation:...w here: d = averag e interest rate; D= total debts; C pr = ow n equity ;...If for calculation of return ra tes profit tax i s taken into account, the relationship becomes [ 6 , 170 ] :w here: i=the tax rate....W e can see the influence that financial structure, respective "all financial resources or capital composition that financial manag er use to increase the needed funding " [ 7 , 36 ] , has on the overall profitability of the company . B y reporting total debt ( D) to ow n equity ( C PR ) i s determined financial leverag e ( L F) ( or leverag e ratio) reflecting the proportion of g rants to loans and g rants to i ts ow n resources. The report should not ex ceed the value 2 , otherw i se the debt capacity of the enterprise i s considered saturated, and borrow ing above this l im i t lead to the risk of insolvency , both to the borrow er and the lender.The financial leverag e effect ( E L F) results from the difference betw een financial and economic return and "ex pressesthe impact of debt on the entity 's equity , the ratio betw een ex ternal and domestic financing ( dom estic resources) " [ 2 , 40 ] thus reflecting the influence offinancial structure on the perform ance of an entity :...Depending or not on the consideration of income tax , net or g ross ra tes of return can be measured, i.e . net or raw financial leverag e effect, as follow s:Debt i s favorable w hile the interest rate i s inferior to the ra te of economic profitability , w hich has a positive influence on financial ra te of the company .Financial leverag e i s even g reater as the difference betw een economic profitability and interest rate i s hig her, in this respect can be seen several cases presented in Table 1 .Leverag e effect a l low s evolution stimulation for financial profitability according to the chang e in funding policy of the enterprise being an im portant param eter for stra teg ic business decisions [ 8 , 164 -165 ] .B ased on the balance sheet and profit and loss account of tw o studied companies' rates of return and financial leverag e a re determ ined, as presented in table no. 2 .From the analy sis of the data presented in Table 2 w e may see the follow ing conclusions:1.. Economic and financial rates of return, in the case of S .C . A L FA S .A . follow s an upw a rd trend recently analy zed aspect reflecting the increased efficiency in the use of equity capital invested, w hile for S .C . B ETA S .A . evolution is a descendant one.2.. R eturn on equity ( equity efficiency ) w as hig her than the ra te of economic profitability ( econom ic efficiency of assets, invested capital respectively ) throug hout the period under review follow ing a positive financial leverag e ( EL F> 0 ) and hig her econom ic efficiency cost of borrow ing ( R e> d).3.. R educing financial leverag e for S .C . A L FA S .A . reduced the favorable effect of the debt presence on financial efficiency ra te , w hich w as due to low er w e ig ht ra tio of tota l debt and equity g row th.4.. Total debt increased during N-l and N y ears for S .C . B ETA S .A . resulted in increased financial leverag e that potentiates financial return ahead as the economic ra te of return.The evolution of the relationship betw een g ross economic return ( R ebr) and g ross financial profitability ( R fbr) for S .C . A L FA S .A . is g raphically presented in Fig ure 1 , and for S .C . B ETA S .A . in Fig ure 2 .A naly zing the evolution offinancial leverag e ( Fig ure 3 ) one can see that risk capital i s not placed a t a level too hig h, w hich m ig ht jeopardize the financial autonom y of enterprises.S ome financiers, as M odig l i ani and Fisher a rg ue that i t i s more advantag eous for the company to finance from loans than from equity [ 6 , 170 ] as the cost of borrow ed capital ( debt interest) i s a lw a y s deductible company 's tax , w hile the cost of equity ( preserved benefits and dividends) i s not tax deductible for the com pany . S hareholders tend to fa ll into debt to g et more tax sa ving , in this w a y , "indebted enterprise va lue appears to be hig her than the company that i s not under debt"[ 7 , 36 ] .Financial breakeven returnEstablishing the company 's position in relation to financial return breakeven for financial risk analy s i s i s determined taking into account fix ed costs and fix ed financial costs, meaning interest ex penses. In this s ituation turnover is calculated corresponding to a financial breakeven return or "financial standstill".B reakeven thus determ ined depends on four fundam ental variables [ 10 ] :-three parameters that influence the stability results of operations:*stability of turnover;*costs structure;*firm position in relation to i ts dead point;-financial ex penses level, respective the debt policy practiced by the company .B ased on these values safety indicators or position indicators are estimated, presented in Table 3 .w here: C A ^tic= financial breakeven;C f = fix ed ex penses;C hfin = financial ex pensesC V = variable ex penses; CA = turnover;R mcv = variable ex penses rate marg in.Financial risk deepens econom ic risk ( in addition to repa y ment of loans, interest costs need to be paid), and finally g enerates a pay ment default of the company that can lead to bankruptcy risk [ 11 , 36 ] .Financial leverag e ratio ( C L F)Financial risk assessment and evaluation can be m ade based on financial leverag e factor ( C L F). It ex presses the sensitivity of net income ( R net) to operating results variations ( R exp) and m easures the percentag e increase of net incom e in response to increase w i th one percentag e of results from operations. C a lculation relationship is as follow s:...respective: ...The C L F calculation takes into account only the current result and financial ex penses, only that correlate w i th the operation, w hich reduces net income relationship: R net = ( R ex p - C hfin) * ( ! - /)In these c ircum stances, financial leverag e coefficient g a ins ex pression: d c . \ /. .v i R exp...C L F= R qx PIt notes that the financial leverag e ratio i s directly proportional to financial ex penses w hich increase hig her the value of C L F and therefore increase in financial risk .Financial risk as measured by financial leverag e ra tio meets vary ing deg rees depending on know ing the coefficient values from zero to infinity [ 6 , 170 ] :B ased on profit and loss account of the tw o studied companies w e determine financial risk indicators presented in Table no. 4 .It can be noticed that, based on the data in Table 4 , the com panies have a com fortable s i tuation in term s of financial risk , because financial expenses have insig nificant values, and in N-2 y ear their absence a l low ed to obtain a financial leverag e ra tio equal to 1 , companies' ex posure to financial risk being m inor.A ctual turnover for the tw o com panies w ere above breakeven financial ( o ver critical turnover) in the analy zed period, aspect w hich a l low ed the recording of safety m arg ins, safety spaces and positive efficiency g a ins.Graphical representation of comparative evolution of financial leverag e ratio i s sug g estively show n in Fig ure no. 4 .In the case of S . C . A L FA S .A . the entire period financial risk is minor due to low level of financial costs, the company preferring to use only i ts ow n resources to finance the activity . Poor values of financial leverag e ra tio ( very c lose to 1 ) support the previous sta tements.Greatest financial risk to w hich S .C . B ETA S .A . i s ex posed to i s manifested in financial y ear N, w hen the value ofcoefficient C L F is max imum , respectively 1 ,11047 w hich show s increasing dependence of net result on the operating result, and consequently , increased financial risk due to the g ap betw een the index and results of operations index of financial ex penses ( l R ex p <Ichfin)- How ever, financial risk i s minor, the society proves superior financial perform ance as turnover i s w e l l above the critical turnover ( financial breakeven), rang e safety hovering w ell above the 20 % in the analy zed period.C onclusionsDebt had a positive effect on financial profitability m anifested as a "financial leverag e" ( positive leverag e effect). Ex tremely low level of debt and low er value of financial l iabilities inferior to ow n equity makes companies not ri sk y in term s of financial solvency . In this situation, for both com panies, i s m ore advantag eous to use the medium and long term loans to finance business, thus ensuring them an additional profit. U s ing debt should be made w i th caution in order not to l imit the financial independence of firm s and reduce additional debt opportunities in times of crisis.A naly sis of financial risk and leverag e effect that accom pany the call to debt, presents a major interest to optim ize the financial structure and viability of any com pany operating under a real market econom y .The use of loans can be risky for the entity and i ts shareholders, but this m ethod of financing becom es advantag eous for entity shareholders s imply because they are able to hold an asset more im porta nt than equity value, increasing their economic pow er. The financing of company ex pansion activity can be achieved by a s ig nificant increase in borrow ed capital provided economic returns exceed the averag e interest rate.C ompany 's risk assessment on the basis of leverag e coefficients i s required for the predicted behavior analy s i s for estimating future results, w hich must be taken into account in decision m aking process.R efer en ces[ 1 ] M orariu, A ., C recanä,C ., D., ( 2009 ) , ''Internal audit. S tra teg y in manag em ent advising ", Theoretical and A pplied Economics - supplem ent, B ucharest, p. 36 .[ 2 ] M orariu, A ., C recanä, C ., D., ( 2009 ) , ''The im pact of economic performance on financial position", Financial A udit, no. 5 , The C hamber of Financial A uditors from R omania Publish house ( C A FR ) , B ucharest, p. 40 .[ 3 ] OM FP, 3055 /2 009 , A rt. 306 , a l .( 3) .[ 4 ] J offre, P., S im on, Z., ( 2007 ) , Ency c lopédie de g estion, Economie Publish house, Paris, 1989 , quoted by J ianu, L , p. 89 .[ 5 ] J ianu, I., ( 2007 ) , Evaluation, presentation and analy sis of enterprise's performance - A n approach from International Financial R eporting S tandards, C EC C A R Publish house, B ucharest, p. 89 .[ 6 ] Petrescu, S ., ( 2010 ) , A naly sis and financial - accounting diag nostic -Theoreticapplicative g uide, 3 rd edition, revised and enlarg ed, C EC C A R Publish house, B ucharest, p. 170 .[ 7 ] M i roniuc, M ., ( 2007 ) , A ccounting and financial manag ement of the company . C oncepts. Policies. Practices, S edcom L ibris Publish house, Iaçi, p. 36 .[ 8 ] Zait, D., ( 2008 ) , Evaluation and manag em ent of direct investments, S edcom Libris Publish house, Ia §i, p. 164 -165 .[ 9 ] National B ank of R om ania, R eference Interest - history , available on[ 10 ] Quiry , P., Le Fur, Y ., Pierre V emim men ( 2008 ) , Finance d'entreprise 2009 , 7 th edition , Dalloz Publisher, Paris.[ 11 ] B erheci, M ., ( 2009 ) , "The risks in l i fe business and accounting outcom e variability " - Part II, A ccounting , auditing and business expertise, p. 36 .。

锂电高压电解液设计方法-概述说明以及解释1.引言1.1 概述随着电动汽车、移动电子设备等市场的快速发展,锂电池作为一种高性能、高能量密度的能源存储装置,受到了广泛关注和应用。
而锂电解液作为锂离子电池的重要组成部分之一,其质量和性能直接影响到电池的安全性、循环寿命和能量密度等关键性能指标。
因此,设计一种合适的锂电高压电解液成为了当前研究的热点之一。
本文将围绕锂电高压电解液的设计方法展开讨论,通过对相关文献的综述和分析,总结出一些有效的设计方法,并对其优缺点进行评估。
同时,本文还将对未来锂电高压电解液的发展前景进行展望,希望能够为相关研究和应用提供一定的参考和借鉴。
1.2 文章结构本文将分为引言、正文和结论三部分来展开讨论锂电高压电解液的设计方法。
在引言部分,我们将对锂电高压电解液的概念进行概述,介绍本文的结构并阐明本文的撰写目的。
接着在正文部分,我们将重点讨论锂电高压电解液的重要性,并提出两种设计方法,分别进行详细的阐述和分析。
最后在结论部分,我们将对整个文中的内容进行总结概括,并展望锂电高压电解液在未来的应用前景,最终得出结论。
通过以上结构的安排,我们将全面系统地介绍锂电高压电解液设计方法的相关内容,为读者提供更深入的了解和参考价值。
1.3 目的:本文旨在探讨锂电高压电解液的设计方法,通过对目前存在的设计方法进行分析和比较,提出更加合理有效的设计方案。
通过深入研究锂电高压电解液的重要性和设计方法,可以有效提高电池性能、延长电池寿命,并推动锂电池技术的进一步发展和应用。
同时,本文还旨在为相关领域的研究人员和工程师提供参考,促进行业内的合作与交流,促进锂电池技术的进步和创新。
2.正文2.1 锂电高压电解液的重要性锂电高压电解液是锂离子电池中至关重要的组成部分,它直接影响着电池的性能和稳定性。
在锂离子电池中,电解液主要起着传递锂离子、带走电荷、维持电池内部离子平衡的作用。
高压电解液的设计是为了提高电池的能量密度、充放电速率和循环寿命,从而实现更高性能和更安全可靠的电池系统。
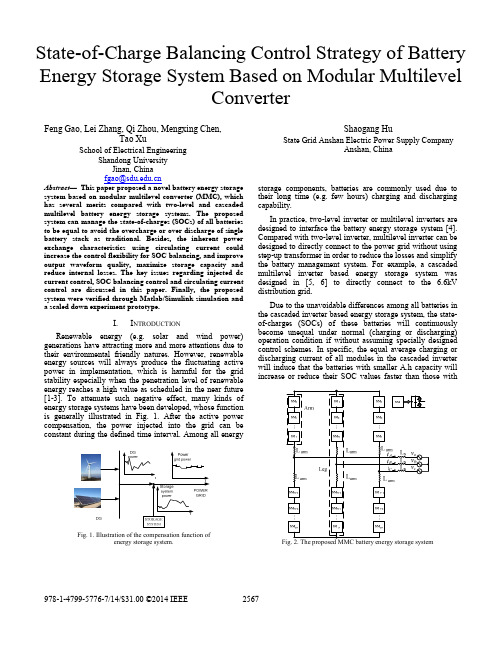
State-of-Charge Balancing Control Strategy of Battery Energy Storage System Based on Modular Multilevel ConverterFeng Gao, Lei Zhang, Qi Zhou, Mengxing Chen, Tao XuSchool of Electrical Engineering Shandong University Jinan, China fgao@Abstract— This paper proposed a novel battery energy storage system based on modular multilevel converter (MMC), which has several merits compared with two-level and cascaded multilevel battery energy storage systems. The proposed system can manage the state-of-charges (SOCs) of all batteries to be equal to avoid the overcharge or over discharge of single battery stack as traditional. Besides, the inherent power exchange characteristics using circulating current could increase the control flexibility for SOC balancing, and improve output waveform quality, maximize storage capacity and reduce internal losses. The key issues regarding injected dc current control, SOC balancing control and circulating current control are discussed in this paper. Finally, the proposed system were verified through Matlab/Simulink simulation and a scaled down experiment prototype.Shaogang HuState Grid Anshan Electric Power Supply Company Anshan, Chinastorage components, batteries are commonly used due to their long time (e.g. few hours) charging and discharging capability. In practice, two-level inverter or multilevel inverters are designed to interface the battery energy storage system [4]. Compared with two-level inverter, multilevel inverter can be designed to directly connect to the power grid without using step-up transformer in order to reduce the losses and simplify the battery management system. For example, a cascaded multilevel inverter based energy storage system was designed in [5, 6] to directly connect to the 6.6kV distribution grid. Due to the unavoidable differences among all batteries in the cascaded inverter based energy storage system, the stateof-charges (SOCs) of these batteries will continuously become unequal under normal (charging or discharging) operation condition if without assuming specially designed control schemes. In specific, the equal average charging or discharging current of all modules in the cascaded inverter will induce that the batteries with smaller A.h capacity will increase or reduce their SOC values faster than those withI.INTRODUCTIONRenewable energy (e.g. solar and wind power) generations have attracting more and more attentions due to their environmental friendly natures. However, renewable energy sources will always produce the fluctuating active power in implementation, which is harmful for the grid stability especially when the penetration level of renewable energy reaches a high value as scheduled in the near future [1-3]. To attenuate such negative effect, many kinds of energy storage systems have been developed, whose function is generally illustrated in Fig. 1. After the active power compensation, the power injected into the grid can be constant during the defined time interval. Among all energyFig. 1. Illustration of the compensation function of energy storage system.Fig. 2. The proposed MMC battery energy storage system978-1-4799-5776-7/14/$31.00 ©2014 IEEE2567higher A.h capacity. Then some batteries will reach their operational limitations earlier than others and consequently quit their operation. Finally, the whole energy storage system will cease its operation earlier than the analytical expectation and loss its power compensation capacity partially. In order to overcome this inherent operational limitation, one solution is to build redundant modules in the cascaded inverter. Once some batteries are out of service, the rest in the multilevel inverter can still provide qualified output performance. But such construction is not cost effective and cannot solve the problem in nature. Another is to use specially designed control scheme to balance all SOCs by specifically controlling the average current per battery module [5-7]. Doing so, all modules in the cascaded inverter can operate at the same SOC level to maximize the storage capacity in operation. However, the SOC balancing operation of cascaded inverter will unavoidably worsen the output quality due to the different modulation reference derived for each Hbridge module especially when the capacities of battery modules are highly different. To further increase the control performance and battery management flexibility, a more distributed battery allocation is preferable. Compared with cascaded multilevel inverter, the modular multilevel converter (MMC) could have more independent dc sources (batteries) with the same number of switches, which means when using a MMC as the interfacing converter the batteries could be managed more precisely. In addition, the internal circulating current among three phases in MMC could help balance the SOCs among three phases when needed, which is superior to the cascaded inverter. Upon all SOCs are balanced in MMC battery energy storage system, normally a dc current as unexpected will inject into the grid due to the unequal summed voltage between the upper and lower arms per phase. But fortunately the injected dc current can be eliminated by a specific designed control method. This paper proposes a MMC battery energy storage system, as drawn in Fig. 2, with improved circulating current suppression control scheme, SOC balancing control scheme and grid dc current attenuation scheme. The proposed control strategies have been verified by Matlab simulations and ascaled down experimental prototype. II. PROBELEM ANALYSIS OF BATTERY ENERGY STORAGE SYSTEM BASED ON MMCAs described above, unbalanced SOCs have great influence on normal operation of battery energy storage system. Their inconsistent characteristics can lead to some operational problems. For example, unequal battery voltages can induce dc component of injected grid current and fundamental frequency component of internal circulating current. Assuming that modulation reference of a single module can be expressed as ref = m Xi sin(ω t + θ X ) (X = A, B or C;i = 1: 2N; θA=0, θB=-2π/3, θC=2π/3). Then the equivalent output voltage of single module can be expressed as equation (1) (without considering high frequency components):v Xi = Vbat _ Xi 2 + Vbat _ Xi 2 ⋅ m Xi sin(ω t + θ X )(1)As equation (1) shows, module voltage contains a dc offset, which is determined by battery voltage. The magnitude of fundamental frequency component of module voltage is determined by both battery voltage and modulation index. When MMC battery energy storage system operates without assuming circulating current suppressing control and SOC balancing control strategies, the modulation index will keep consistent for all modules. Similarly, the summed voltage of each arm can be expressed as equation (2):N N N ⎧ Vbat_Xi mXi ∑Vbat_Xi ∑ ∑Vbat_Xi ⎪ ⎪v Xu = i=1 + i=1 sin(ωt+θ X )= i=1 +Vm _ xu sin(ωt+θ X ) ⎪ 2 2 2 ⎨ 2N 2N 2N ⎪ ∑ Vbat_Xi i=N+1 ∑ Vbat_Xi mXi ∑ Vbat_Xi ⎪ i=N+1 sin(ωt+θ X )= i=N+1 -Vm _ xd sin(ωt+θ X ) ⎪v Xd = ⎩ 2 2 2(2)According to equation (2) the series-connected modules in each arm can be simplified as a voltage source, which(a)(b) Fig. 3. Equivalent circuit of MMC battery storage system(c)2568contains dc component and fundamental frequency component as shown in Fig. 3(a). In order to analyze dc component and ac component separately, the equivalent circuit shown in Fig. 3(a) can be further divided into two equivalent circuits as shown in Fig. 3(b) and (c), respectively. Fig. 3(b) shows the ac equivalent circuit of MMC battery energy storage system, which can be used to analyze fundamental frequency component of circulating current. Fig. 3(c) shows the dc equivalent circuit of MMC battery energy storage system, which can be used to analyze dc component of injected grid current and dc component of circulating current. When battery voltages are inconsistent, the dc component and fundamental frequency component magnitude among six arms would be unequal. Usually, battery voltage with respect to larger capacity and higher SOC value should be higher than those with smaller capacity and lower SOC value. The different dc components among arm voltages can induce dc current of injected grid current and dc component of circulating current. Similarly, the different fundamental frequency component magnitude of arm voltage can induce fundamental frequency component of circulating current. In addition, as analyzed in [8, 9], circulating current contains second order harmonic component, which is traditionally regarded as internal losses. Usually, when MMC battery energy storage system operates without circulating current suppressing control and SOC balancing control strategies, the dc component and fundamental frequency component of circulating current always flow from the phase with larger battery capacity and higher SOC values to the phase with smaller battery capacity and lower SOC value, which will benefit the SOC balancing among batteries in nature. However, since circulating current is always regarded as internal losses, circulating current should be suppressed during normal operation. Only when MMC battery energy storage system operates near its boundary condition, for example, some batteries will reach their lowest or highest SOC boundaries and others still have enough capacity left, the power exchanging through circulating current could be implemented as intended. Doing so, the MMC battery energy storage system will have a qualified output performance and high operational efficiency. The corresponding control strategy will be addressed in below Sections. III. SOC BALANCING CONTROL STRATEGY As described above, unbalanced SOCs have great influence on normal operation of battery energy storage system and induce some other problems. Thus SOCs should be balanced through balancing control strategy. In order to balance SOCs, real power of each half-bridge module should be adjusted according to the difference among SOCs. As analyzed above, arm current contains dc component, fundamental frequency component and second order harmonic component. Thus the arm voltage vXp, vXn (X = A, B, C) and arm current iXu, iXd (as shown in Fig. 3(a))can be expressed as equation (3):⎧ ⎪v Xp = VXu _ dc - Vm _ Xu sin(ω t + θ X ) + I m _100 Hz ⋅ | Z arm | sin(2ω t + θ X ) ⎨ ⎪ ⎩v Xn = VXd _ dc -Vm _ Xd sin(ω t + θ X ) - I m _ 100 Hz ⋅ | Z arm | sin(2ω t + θ X ) ⎧i Xu = I Xu _ dc -I m _ Xu sin(ω t + θ X − ϕ ) + I m _100 Hz sin(2ω t + θ X + ϕ ) ⎪ ⎨ ⎪ ⎩i Xd = I Xd _ dc -I m _ Xd sin(ω t + θ X − ϕ ) - I m _100 Hz sin(2ω t + θ X + ϕ )(3)where, Ixu_dc and Ixd_dc are dc components of arm current, Vxu_dc and Vxd_dc are dc components of arm voltage. Assuming the grid voltage can be expressed as vx =Vmsin(ωt+ +θX), magnitude of fundamental frequency component of arm voltage and arm current can be calculated:N ⎧ Vbat _ Xi mXi ∑ ⎪ i =1 ⎪Vm _ Xu = ⎪ 2 ⎨ 2N ⎪ V ∑ bat _ Xi mXi ⎪ i = N +1 ⎪Vm _ Xd = ⎩ 2(4)−Vm _ Xu sin(ω t + θ X ) − Vm sin(ω t + θ X + φ ) ⎧ ⎪iXu _ 50 Hz = ω 2 (L arm + 2 L s ) 2 ⎪ ⎪ = − I m _ Xu sin(ω t + θ X − ϕ ) ⎪ ⎨ −Vm _ Xd sin(ω t + θ X ) − Vm sin(ω t + θ X + φ ) ⎪i = ⎪ Xd _ 50 Hz ω 2 (L arm + 2 L s ) 2 ⎪ ⎪ = − I m _ Xd sin(ω t + θ X + ϕ ) ⎩(5)The module power consists of dc component, fundamental frequency component, second order component and high frequency components. The dc component of module power is introduced by dc component of circulating current and fundamental frequency component of arm current. Thus, in order to adjust module power, modulation index mXi can be adjusted. In order to clarify SOC balancing control strategy, some variations are defined as follows:⎧ SOC A = ( SOC A _1 + ⋅⋅⋅ + SOC A _ 2 N ) / (2 N ) ⎪ ⎨ SOCB = ( SOCB _1 + ⋅⋅⋅ + SOCB _ 2 N ) / (2 N ) ⎪ ⎩ SOCC = ( SOCC _ 1 + ⋅⋅⋅ + SOCC _ 2 N ) / (2 N ) SOCave = ( SOC A + SOCB + SOCC ) / 3(6)Where SOCX (X = A, B, C) are SOC average value per phase and SOCave is average value of all batteries. Then differences between SOCave and SOCX and differences between SOCX and individual SOC values can be expressed as equation (7):⎧ ΔSOC A = SOCave − SOC A ⎪ ⎨ ΔSOCB = SOCave − SOCB ⎪ ΔSOC = SOC − SOC ⎩ C ave C ΔSOC Xi = SOC X − SOC Xi(7)where, X = A, B or C and i = 1:2N. Then the modulation index of single module can be2569adjusted by PI controller according to SOC differences as shown in Fig. 4(a) and (b). The SOC balancing control strategy can be divided into two stages: SOC balancing among three phases and SOC balancing in single phase as shown in Fig. 4(c). However, solely SOC balancing through adjusting modulation index will lead to several significant problems. When adding SOC balancing control strategy, those batteries with larger capacity and higher SOC should discharge more than those with smaller capacity and lower SOC. Thus voltages of those batteries with larger capacity and higher SOC will decline due to the increase of voltage drop on battery internal resistance. This will influence dc component of circulating current, even influence SOC balancing among batteries. This scenario will also increase differences of dc component of module voltage in each arm, which can aggravate dc component of injected grid current. In order to maximize operational capacity, meanwhile to reduce internal losses and increase output performance, the average SOCs among different arms can be carefully adjusted without sacrificing the whole operational performance thanks to the special inherent power exchange capability transported by circulating currents as described below. SUPPRESSING CONTROL METHODS OF CIRCULATING CURRENT AND GRID DC CURRENT As described above, to solve the operational challenges, this paper proposes a novel suppressing control methods of circulating current and grid dc current. The overview of control strategy for MMC battery energy storage system is shown in Fig. 5, which can be divided into real power and reactive power control scheme, SOC balancing control strategy, circulating current suppressing control method and IV.grid dc current suppressing control method. The SOC balancing control strategy has been introduced above. A. Circulating Current Suppressing Control Method As described above, the circulating current mainly contains dc component, fundamental frequency component and second order harmonic component, which should be suppressed to reduce losses. In order to attenuate the second order harmonic component, a second order component is added into modulation reference as written in equation (8):N N ⎧ Vbat _ Xi ∑ Vbat _ Xi [mXi sin(ω t + θ X ) + m Xi _100 Hz sin(2ω t + θ X )] ∑ ⎪ ⎪v Xu = i =1 + i =1 2 2 ⎪ ⎪ = VXu _ dc + v Xu _ 50 Hz + v X _100 Hz ⎪ ⎨ 2N 2N ⎪ Vbat _ Xi [−m Xi sin(ω t + θ X ) + mXi _100 Hz sin(2ω t + θ X )] ∑ Vbat _ Xi i =∑ ⎪ i = N +1 + N +1 ⎪v Xd = 2 2 ⎪ ⎪ ⎩ = VXd _ dc + vXd _ 50 Hz + v X _100 Hz(8)Doing so, in the equivalent circuit, it can be treated to add an ac voltage source with second order harmonic into each arm as shown in Fig. 6(a). If properly controlled, it can counteract second order harmonic component of arm voltage. The second order component of modulation(a) Control block of SOC balance among different phases(b) Control block of SOC balance in single phases(c) Control block of modulation index adjustment Fig. 4. Control block of battery SOC balancing control strategyFig. 5. Overview of control strategy of MMC battery energy storage system2570reference can be generated through a PR controller, as shown in Fig. 6(b). Similarly, due to unequal dc component of module voltages, circulating current contains dc component. As described above, SOC balancing control strategy will influence dc circulating current. But on the other side, dc circulating current will also influence SOC balancing among batteries. Therefore in order to attenuate dc circulating current, dc component needs to be added to modulationreference. The additional dc component reference can be generated through a low-pass filter and a PI controller, as shown in Fig. 7. The fundamental frequency component is now left to exchange power among six arms. Indeed, other circulating current components can be employed to exchange power as well. But when employing a higher order circulating current to exchange power among three phases, the system controller would equip a high bandwidth. However, in general, circulating current will induce additional power losses which should be reduced. To suppress circulating current, voltages of upper arm and lower arm should be consistent. As a result, current of upper arm will keep consistent with lower arm current without circulating current and SOCX among six arms cannot be balanced. But the SOCs of all batteries per arm can be balanced by properly controlling the modulation references. For example, ac current of each module is equal to the corresponding arm current. But the module voltages can be adjusted by regulating the modulation index. Then output power of each module can be adjusted by controlling modulation index. Thus, SOCs per arm can be balanced through adjusting modulation index of each module. B. Grid DC Current Suppressing Control Method As analyzed above, due to unequal dc component of module voltages, arm voltage contains dc component, which will induce grid dc current as shown in equation (3). Being similar as circulating current suppressing control method, in order to attenuate dc component of arm voltage, additional equivalent dc voltage sources should be added in each arm, which can be implemented by adding dc component into modulation references as shown in equation (9):⎧ ⎪v Xu = VXu _ dc + vXu _ 50 Hz + v X _100 Hz + ΔVX _ dc ⎨ ⎪ ⎩v Xd = VXd _ dc + v Xd _ 50 Hz + vX _100 Hz − ΔVX _ dc(a) Equation circuit of second order harmonic component suppressing of circulating current(b) Control block of second order harmonic component suppressing of circulating current Fig. 6. Equivalent circuit and control block of second order harmonic component suppressing of circulating current.(9)Fig. 7. Control block of dc component suppressing of circulating current.VAudc VA_dc+ -VBudc IAdcVB_dc+ -VCudcVC_dc IBdc+ R RThis scenario can also be drawn in the equivalent circuit as shown in Fig. 8(a). Fig. 8(b) shows the control block of grid dc current suppressing control method. V. SIMULATION AND EXPERIMENTAL VERIFICATIONVAdcVBdc VB_dc VBddcVA_dc VAddc-+VCdc VC_dc VCddcICdcR++(a) Equation circuit of dc current of power grid suppressing control method(b) Control block of dc current of power grid suppressing control method Fig. 8. Control block of circulating current and dc component of grid current suppressing control method.A. Simulation Verification The proposed control strategy was simulated using a MMC battery energy storage system built in Matlab/Simulink. Two modules were connected per arm. The output filter Lac=2mH, the arm filter Larm=2mH, parallel capacitor C=550μF and the rms value of grid line voltage is 110V. The power references are set to be Pref = 5kW and Qref = 0kVar. The total simulation time is 17.5s due to the limitation of computer memory. In addition, in order to verify the proposed control strategy in the total simulation duration, the differences among SOCs and rated capacities of all modules are not too large within the limitation of±10%.2571As described above, in general, circulating current should be suppressed. Under this scenario, only SOCs among each arm can be balanced. When SOCs of all batteries need to be balanced, fundamental frequency component of circulating current would be assumed to transfer power among three phases. Thus, two cases are simulated as illustrated below. For the first case, in order to balance SOCs of all batteries, fundamental component of circulating current will not be suppressed. The simulation progress can be divided into four stages: Stage I: 0~0.2s, circulating current and grid dc current suppressing control methods and SOC balancing control scheme are not added; Stage II: 0.2~0.5s, circulating current control method is added; Stage III: 0.5~4s, SOC balancing control scheme is added; Stage IV: 4~17.5s, grid dc current suppressing control method is added. Fig. 9(a) shows the SOC values of all batteries. Fig. 9(b) shows the differences between SOC average and individual SOC values. All SOCs can reach consistent as shown in Fig. 9 after adding SOC balancing control scheme. Fig. 10 shows the three phase grid currents and dc components of grid currents. The dc component of grid current can be effectively attenuated after adding the grid dc current suppressing control method. Fig. 11 shows arm current and circulating current of MMC battery system. Fig. 12 shows FFT analysis results of circulating current during stage I, II and III. For the second case, where all components of circulating current could be suppressed, only SOCs in one arm can be balanced. The simulation progress can also be divided into four stages the same as above. Fig. 13 shows SOCs values of each phase, in which, SOCs per arm can be balanced. However battery SOCs in different arms are unbalanced. Fig. 14 shows circulating currents and currents of upper arm and lower arm. Fig.15 shows FFT analysis results of circulating current during stage I and III. When the balancing of SOCs in different arms is not necessary, all components of circulating current can be suppressed. B. Experiment VerificationTABLE I. CIRCUIT PARAMETER OF THE EXPERIMENT SYSTEM Lead-acid battery 36V,3.3 Ah ×12 2 1mH 2mH 550μF 5000Hz 17.5Vbattery unit module number in each arm arm inductance AC inductance DC capacitor PWM carrier frequency grid phase rms voltage75 74.5 74.1 73.7 0 2 4 6 8 10 Time(s) 12 14 16SOC(%)(a)0.1 ΔSOC(%) 0.05 0 -0.05 -0.1 0 2 4 6 8 10 Time(s) 12 14 16(b) Fig. 9. (a) SOC values of all batteries and (b) differences between SOC average value and individual SOC value40 Current(A) 20 0 -20 -40 3.5 40 Current(A) 20 0 -20 -40 4.65 4.66 4.67 4.68 4.69 4.7 4.71 Time(s) 4.72 4.73 4.74 4.75 3.51 3.52 3.53 3.54 3.55 3.56 Time(s) 3.57 3.58 3.59 3.6(a)1 Current(A) 0.5 0 -0.5 -1 1.5 1 Current(A) 0.5 0 -0.5 -1 4.5 5 Time(s) 5.5 6 2 2.5 3Time(s)(b) Fig. 10. (a) three phase grid current and (b) DC component of grid current before and after suppressing dc component of grid currentCurrent(A) -40 0.1 Current(A) 40 20 0 -20 -40 0.1 Current(A) 20 10 0 -10 -20 0.1 0.12 0.14 0.16 0.18 0.12 0.14 0.16 0.18Current(A)40 20 0 -200.120.140.160.180.2 0.22 Time(s)0.240.260.280.3Current(A)30 15 0 -15 -30 0.4 30 15 0 -15 -30 0.4 100.420.440.460.480.5 0.52 Time(s)0.540.560.580.60.2 0.22 Time(s)0.240.260.280.3Current(A)0.420.440.460.480.5 0.52 Time(s)0.540.560.580.60 -10 0.40.2 0.22 Time(s)0.240.260.280.30.420.440.460.480.5 0.52 Time(s)0.540.560.580.6(a) (b) Fig. 11. Arm current and circulating current of MMC battery system (a) stage I, II and (b) stage II, III.10 Mag2 1 05 0Mag0 50 100 150 200 250 300 350 400 450 500 Frequency (Hz)0 50 100 150 200 250 300 350 400 450 500 Frequency (Hz)(a)(b)2 Mag 1 0050 100 150 200 250 300 350 400 450 500 Frequency (Hz)(c) Fig. 12. FFT of circulating current in stage (a) I, (b) II, (c) III.257275 SOC% 74.5 74 0 75 SOC% 74.5 74 0 75 SOC% 74.5 74 0 5 Time(s) 10 15 5 Time(s) 10 155Time(s)1015Fig. 13. SOC values in each phase50 Current(A)Current(A) 50 0 -50 0.4 50 Current(A) 0 -50 0.4 10 Current(A) 0 -10 0.4 0.42 0.44 0.46 0.48 0.5 0.52 Time(s) 0.54 0.56 0.58 0.6 0.42 0.44 0.46 0.48 0.5 0.52 Time(s) 0.54 0.56 0.58 0.6 0.42 0.44 0.46 0.48 0.5 0.52 Time(s) 0.54 0.56 0.58 0.60 -50 0.1 50 0 -50 0.1 20 0 -20 0.1 0.12 0.14 0.16 0.18 0.2 0.22 Time(s) 0.24 0.26 0.28 0.3 0.12 0.14 0.16 0.18 0.2 0.22 Time(s) 0.24 0.26 0.28 0.3 0.12 0.14 0.16 0.18 0.2 0.22 Time(s) 0.24 0.26 0.28 0.3Current(A)Fig. 16. Photograph of experimental prototype.Current(A)(a) (b) Fig. 14. Circulating current and current of upper arm and lower arm8 Mag0.4 Mag 0.2 06 4 2 0 0 50 100 150 200 250 300 350 400 450 500 Frequency (Hz)050 100 150 200 250 300 350 400 450 500 Frequency (Hz)(a) (b) Fig. 15. FFT of circulating current of stage I, III. (a)A scaled down experimental prototype has been built as shown in Fig. 16. The MMC battery system was connected with a programmable ac source. And a resistance load was connected with ac source either. Some circuit parameters are listed in TABLE I. The experimental results shown in Fig. 17 include the suppressed arm current, ac circulating current, injected grid current and grid voltage. In addition, the FFT analysis results are shown in Fig. 18. Fig. 17(a) shows the experiment results without adding circulating current control strategy. Fig. 17(b) shows the experiment results with circulating current control. It is noted that the circulating current has been well suppressed. Fig. 18(a) shows the FFT analysis results of circulating current without adding circulating current control strategy. Fig. 18(b) shows the FFT analysis results of circulating current when circulating current had been suppressed. In addition, Fig. 19(a) shows the FFT analysis results of grid current, in which dc component had not been suppressed. Fig. 19(b) shows the FFT analysis results of grid current with dc component suppressing control. Compared with FFT analysis results in Fig. 19 (a) and (b), it is noted that dc component of grid current can be effectively suppressed through grid dc current suppressing control strategy.(b) Fig. 17. Experiment results of MMC battery system (a) without circulating current control and (b) with circulating current control.0.8 0.6 Mag 0.4 0.2 0 0 50 100 150 200 250 300 350 400 450 500 Frequency (Hz)Mag 0.2 0.15 0.1 0.05 0 0 50 100 150 200 250 300 350 400 450 500 Frequency (Hz)(a) (b) Fig. 18. FFT of circulating current (a) without circulating current control and (b) with circulating current control.0.2 0.15 Mag 0.1 0.05 0 -10 0 10 20 Frequency (Hz) 30 400.2 0.15 Mag 0.1 0.05 0 -10 0 10 20 Frequency (Hz) 30 40(a) (b) Fig. 19. FFT of grid current (a) without dc current suppressing control and (b) with dc current suppressing control.2573VI.CONCLUSION[4]This paper proposes a MMC battery energy storage system, which has several merits compared with cascaded multilevel inverter based battery storage system. A control strategy including SOC balancing control scheme, circulating current suppressing control scheme and grid dc current suppressing control scheme has been proposed in this paper. The proposed SOC balancing control strategy can effectively balance SOCs of all batteries, meanwhile effectively attenuate grid dc current and circulating current. The proposed control strategy has been verified by simulations and experimental prototype. REFERENCES[1] Y.T.Tan, D.S.Kirschen, and N.Jenkins, “A model of PV generationsuitable for stability analysis,” IEEE Trans. Energy Conversion,vol. 19, no. 4, pp. 748-755, Dec. 2004. Jie Zeng, Qisheng Liu, Jiaojiao Zhong, Shaopeng Jin, and Wancheng Pan,“Influnce on static voltage stability of system connected with wind power,” Power and Energy Egineering Conference Asia-Pacific 2012(APPEEC 2012), March 27-29, pp. 1-4 . M. Liserre, T. Sauter, and J.Y. Hung, “Future energy systems: Integrating renewable energy sources into the smart power grid through industrial electronics” IEEE Industrial Electronics Magazine, vol. 4, no. 1, pp. 18-37, March 2010.[5][6][7][8][2][9][3]X. Li, W. Zhang, C. Du, K. Ma, X. Wu, and D. Xu, “Investigation to power conversion topology for fuel cell power generation system,” in Proc. IEEE Int. Power Energy Conf., Jun. 21–24, 2010, vol. 1, pp. 114–120. Laxman Maharjan, Shigenori Inoue, Hirofumi Akagi, and Jun Asakura, “A transformerless battery energy storage system based on a multilevel Cascade PWM Converter,” in Proc. IEEE PESC 2008, June 15-19, pp. 4798-4804. Laxman Maharjan, Shigenori Inoue, Hirofumi Akagi, and Jun Asakura, “State-of-Charge (SOC) balancing Control of a battery energy storage system based on a Cascade PWM Converter,” IEEE Trans. Power Electronics, vol. 24, no. 6, pp. 1628-1636, June 2009. Laxman Maharjan, Tsukasa Yamagishi, Hirofumi Akagi, and Jun Asakura, “Fault-Tolerant Operation of a Battery-Energy-Storage System Based on a Multilevel Cascade PWM Converter With Star Configuration,” IEEE Trans. Power Electronics, vol. 25, no.9, pp. 1628-1636, September 2010. S. Ceballos, J. Pou, S. Choi, M. Saeedifard, and V. Agelidis, “Analysis of voltage balancing limits in modular multilevel converters,” in Proc. 37th Annu. Conf. IEEE Ind. Electron. Soc., Nov. 2011, pp. 4397–4402. R. Picas, J. POU, S. Ceballos, J. Zaragoza, G. Konstantinou and V. G. Agelidis,“Optimal Injection of Harmonics in Circulating Currents of Modular Multilevel Converters for Capacitor Voltage Ripple Minimization ” in Proc. IEEE ECCE Asia Downunder (ECCE Asia) 2013, Jun 3-6, pp. 318-324.2574。

Chapter11.supply chain management 供应链管理2.zero defect 零缺陷3.perfect order 完美订单4.six-sigma performance 六西格玛管理体系5.marketing channel 营销渠道6.economic value 经济价值7.economy of scale 规模效益8.market value 市场价值9.trade-off 背反关系rmation sharing paradigm 信息共享模式11.process specialization paradigm 过程专业化模式12.electronic data interchange(EDI)电子信息交换13.made to plan(MTP)根据计划推测生产14.lead-time 交货期15.made to order(MTO)根据订单生产16.logistic outsourcing 物流外包17.stock keeping unit(SKU)库存单位18.integrated service provider(ISP)一体化服务供应商19.public warehouse公共仓库20.value-added service 增值服务21.third-party service provider 3PL 第三方物流服务供应商22.fourth-party service provider 4PL 第四方物流服务供应商23.anticipatory business model(push)预测性商业模式24.responsive business model(pull)快速响应型商业模式25.logistics postponement 物流延迟26.cash-to-cash conversion 现金转化周期27.dead net pricing 完全净价28.cash spin 现金周转29.operational performance 运作绩效30.order processing 订单处理31.customer accommodation 市场分销Chapter2 Inbound logistics 采购运筹,进口物流1.Procurement perspective and strategies 采购远景和策略2.continuous supply 持续供应3.minimize inventory investment 减少存货投资-JIT4.quality improvement 质量改进5.lowest total cost of ownership-TCO 所有权总成本最低6.supplier-buyer integration 供方买方整合7.value management 价值管理8.sales synergy 销售协同9.Manufacturing perspective and strategies 生产远景和策略10.brand power 品牌力11.Lead time 备货期12.Make-to-stock(MTS)备货型生产13.Make-to-order(MTO)订货型生产14.Assemble-to-order(ATO)面向订单装配15.Material Requirement Planning(MRP) 物料需求计划Chapter3 Outbound Logistics 出货物流1.Supply chain service output 供应链营运功率2.Spatial convenience 空间便利性3.Lot size 批量4.Waiting time 等待时间5.Stock out frequency 缺货率6.Fill rate 供应比率7. Sales and operations planning 销售和运作计划8.Order shipped complete 订货完成率9.Operation Performance 运行性能:10.Service Reliability 服务可靠性11.Customer Satisfaction 顾客满意度:12.Value added service 增值业务:13.Customer-focused services顾客导向之服务14.Promotion-focused services促销导向之服务15.Manufacturing-focused services 生产导向之服务16.Time-based services 基于时间的服务17.Distribution Resource Planning (DRP) 配送资源计划18.Total Quality Management全面质量管理19.customer relationship management(CRM)客户关系管理20.International Organization for Standardization(ISO)国际标准化组织21.European Article Numbering(EAN)欧洲物品编码22.Total Cost of Ownership所有权的总成本23.Economic Order Quantity(EOQ)经济订货量24.authorized economic operator授权经济运营25.make-to-plan(MTP)计划型生产26.Assemble-to-order面向订单装配27.materials requirements planning(MRP)物料需求计划28.performance-based logistics基于性能的物流29.Master Production Schedule主生产计划30.Bill of Materials 物料清单31.Distribution Resource Planning分销资源计划32.Supply chain information systems 供应链信息系统33.Enterprise Resource Planning(ERP)企业资源规划34.transportation management system运输管理系统35.Warehouse management system存货管理系统36.Yard management system堆场管理系统Advanced Planning and Scheduling(APS) 高级计划与排程系统37. available to promise 可行性承诺38.Collaborative Planning, Forecasting and Replenishment(CPFR)协同规划,预测和补货39.bills of lading提单40. proof of delivery交货证明Chapter4Geographical specialization 地域专门化Decoupling 库存的“分离”作用Balancing supply and demand 平衡供需Buffering uncertainty 降低不确定性因素Service lever 服务水平Average inventory 平均库存Inventory policy 存货政策Cycle inventory, or base stock 周转库存Safety stock inventory 安全库存Transit inventory 在途库存Order quantity 订购数量Transit inventory 已中转存货Obsolete inventory陈旧存货Speculative inventory投机性存货Safety stock 安全储备Reorder point 再订货点Inventory turns库存周转次数performance cycle or lead time绩效循环Inventory carrying cost 库存持有成本Volume Transportation Rates体积运输率Free On board (FOB) 船上交货价Quantity Discount大批量折扣Other EOQ Adjustments其他存货调整Demand uncertainty 需求的不确定性Performance cycle uncertainty 运行周期的不确定性Standard deviation 标准差Poisson distribution 泊松分布Safety Stock with Combined Uncertainty安全库存结合的不确定性Numerical compounding 精确合成Estimating Fill Rate估计填充率Dependent Demand Replenishment相关需求补给Safety time 安全时间Over planning top-level demand 对高水平需求的超额预测Inventory control 库存控制Perpetual Review 永续盘存Periodic Review 定期盘存Reactive inventory system 反应式库存系统Pull inventory system 拉动式库存系统Fair Share Allocation 公平份额分配法Distribution Requirements Planning (DRP) 配送需求计划Collaborate Inventory Replenishment 联合库存补充Vendor-Managed Inventory (VMI) 供应商管理存货Profile Replenishment (PR) 系列补货Product Classification Analysis (ABC) 产品分类分析Product/Market Classification 产品/市场分类Segment Strategy Definition 战略定义Policies and Parameters 政策和参数Chapter5,6(第八、九、十章)第八章Transportation InfrastructureIn-transit inventory在途库存Diversion转移Economy of scale规模经济 economy of distance 距离经济Tapering principle 远距离递减原则Consignor 发货人 consignee 收货人United States Postal Service (USPS)美国邮政服务Department of Transportation(DOT)运输部门Interstate Commerce Commission (ICC) 洲际商会Surface Transportation Board (STB) 陆地运输局Rights-of-way 通行权Ton-mile 吨英里Truckload(TL) 整车运输less—than—truckload(LTL) 零担运输specialty 专项运输North America Free Trade Agreement (NAFTA) 北美自由贸易协定Central America Free Trade Act (CAFTA) 中美洲自由贸易法United Parcel Service (UPS) 联合包裹运输服务公司Piggyback service 驼背式运输服务Land bridge 大陆桥Freight forwarders 货运代理人第九章Transportation OperationsStowability 装载能力Hundredweight (CWT) 英担Transport lane 运输通道Back-haul 可带回去Deadheaded 空车返回Variable costs 可变成本Fixed costs 固定成本Joint costs 连带成本Common costs公共成本Cost-of-service 服务成本策略Value-of-service 服务价值策略Combination pricing strategy 组合定价策略Net-rate pricing 净费率定价策略Tariff 费率表Class rate 费率类别Minimum charges and surcharges最低收费和附加费Commodity rate 商品费率Exception rates 特价费率Aggregate tender rate累计费率Limited service rate 有限服务费率Shipper load and count rate 发货人装载和清点费率Released value rate 免责价值费率Freight-all-kind (FAK) rates 均价费率Local rate 地方费率Single-line rate单线费率Joint rate 联合费率Proportional rate比例费率Transit service 转运服务Diversion and reconsignment 转移并变更收货人Split delivery 分票交付Demurrage 滞期费Detention 滞留费用Special or accessorial service 特别的或者附属的费用Special equipment charges 特殊设备使用费Transportation management system (TMS)运输管理系统Core carrier strategy 核心承运人战略Integrated service providers (ISPs)Reactive and proactive反应性和主动性Market area 市场范围法Scheduled area delivery 定期运送Pooled delivery集中运送Preorder planning 预订计划Multi-vendor consolidation 多卖主集拼Expediting 加急Hours of service(HOS) 服务时间Federal Motor Carrier Safety Administration联邦汽车运输安全管理局Loss or damage 货物丢失和损伤Overcharge/undercharge索价过低Preaudit 事前审核Post audit 事后审核Bill of lading 提货单Order-notified 待命提单Freight bill运费账单Prepaid or collect 预付或到付Shipment manifest装货清单Free on board船上交货Freight on board 离岸价格F.O.B. Origin FOB原产地价格F.O.B. Destination pricing FOB交货地价格F.O.B. 离岸价Delivered pricing 交货价Single-zone delivered pricing单地区定价Multiple-zone delivered pricing多地区定价Base—point pricing system基点定价系统Phantom freight在售价上加计的运费Freight absorption 运费免收Substantially lessen competition 大大减少竞争Forward-buy 提前购买Every Day Low Pricing(EDLP)天天低价Activity-based costing 作业成本法Total cost-to-serve model总成本与服务模型第十章 WarehousingDistribution center 分销中心Just-in-time (JIT)准时制生产Cross-docking 越库式转运Mixing组合作业Assembly 装配作业Lead suppliers or tier one suppliers 主供应商或一级供应商Environmental Protection Agency(EPA)环境保护机构Food and Drug Administration(FDA)食品药物监管会Occupational Safety and Health Administration(OSHA)职业安全与卫生管理局Spot-stocked 定点储存Value-added services(VAS)增值服务Transfer and selection 货物的转移和分拣作业Flow-through or cross-dock distribution通过式配送或越库式转运Extended storage 长期储存Contract warehousing 合同仓储Selection or picking area 分拣作业的区域Discrete selection and wave selection 单独分拣和区域分拣Batch selection 批次挑选Chapter 7 Integrated Operations PlanningSupply Chain Planning供应链计划Supply chain visibility供应链的可见性Simultaneous resource consideration资源的同步考虑Resource utilization资源的利用率Supply Chain Planning Applications供应链计划应用系统Demand Planning需求计划Product Planning生产计划Logistics Planning 物流计划Sales and Operations Planning (S&OP)销售和作业计划系统Maximize production产量最大化Stable schedule稳定的生产进度Long lead times长的提前期Lower margins较低的利润Aggregate forecasts总体预测Rapid response 快速响应Maximize revenue 利润最大化Collaborative planning协同计划Exponential smoothing指数平滑法extended exponential smoothing扩展平滑法Adaptive smoothing调节性平滑法Multiple regression多元回归Chapter 8 Global Supply ChainGlobal Supply Chain Integration全球供应链一体化Stages of international development国际化发展的阶段Use restriction使用限制Price surcharges价格附加费Local presence本地经营Global Sourcing 国际采购Rationale for Low-Cost-Country sourcing低成本国家采购的理由Guidelines for sourcing采购的指导方针Achieve economies of scale实现规模经济Reduce direct cost减少直接成本Reduce market access uncertainty减少市场准入的不确定性Enhance sustainability增强可持续性Combined transport document联运单据Commercial invoice商业发票Insurance certificate保险证书Certificate of origin原产地证书Logistics Performance Index(LPI)物流绩效指数Chapter 9 Chapter 10(第十五、十六章)SDWT--self-directed work teams 自我指导工作小组Balanced scorecards 平衡计分卡Balance sheet 资产负债表Income statement 利润表The great divide 严重断层Reliability-based trust 以可靠性为基础的信任Character-based trust 以特性为基础的信任Average order cycle time 平均订货周期时间Order cycle consistency 订货周期一致性On-time delivery 准时交货Downtime 停工期Inventory turnover rate 库存周转率ROA---return on assets 资产回报率ROI---return on investment 投资回报率RONW---return on net worth 净值回报率Contribution approach 贡献毛利法Net profit approach 净利润法SPM---Strategic Profit Model 战略盈利模型CMROI---contribution margin return on inventory investment库存投资利润贡献率。
铜铝复合柱翼型散热器连接方式对散热量的影响青岛理工大学 张双喜 余才锐山东省建筑设计研究院 牟灵泉 楚广明高密中亚暖通设备有限公司 杨华杰摘要 根据我国目前广泛使用的铜铝复合柱翼型散热器的特点,研究了不同连接方式对其散热量的影响。
讨论了工程设计中散热器配置数量的计算方法。
关键词 铜铝复合 散热器 连接方式 修正因数Influence of connection modes on heat release of copper aluminum column wing type radiatorsB y Zhang S huangxi ,Y u Cairui,M ou L ingquan,Chu G uan gm ing an d Y ang H uajieAbstract Acc or ding to the char acter istics o f the copper aluminum co lumn wing ty pe ra diato rs usedpopular ly in China to da y,studie s the var iety of hea t r ele ase in diff ere nt co nnect io n mo de s,and discusses the metho d f o r calculating co lloca tio n quantities of ra diato rs in pro ject de sig n.Keywords c opper a luminum,r adia tor ,c onnection mo de,co rr ection co ef ficientQingd ao Technological University,Qingdao,S handong Province,Chinay0 引言散热器是供暖系统的末端装置。
Charge Balancing Fill Rate MonitorJ.L. Rothman and E.B. BlumNational Synchrotron Light Source, Brookhaven National Laboratory, Upton, New York 11973 AbstractA fill rate monitor has been developed for the NSLS stor-age rings to allow machine tuning over a very large dynamicrange of beam current. Synchrotron light, focused on a pho-todiode, produces a signal proportional to the beam current. A charge balancing circuit processes the diode current, creating an output signal proportional to the current injected into the ring. The unit operates linearly over a dynamic range of 120dB and can resolve pulses of injected beam as small as 1µA.I. INTRODUCTIONThe fill rate monitor is one of the most frequently used diagnostic tools in the NSLS control room, allowing the op-erator to optimize injection and reduce the time between fills. Previous fill rate monitors have used signals from pickup elec-trodes (PUEs) or from a DC current transformer (DCCT). A tuned receiver connected to a PUE can measure very small currents, but tends to saturate with large signals. The DCCT tolerates large signals but is too noisy to resolve small changes in current. The new unit combines the best elements of the other systems, providing both high sensitivity and a wide dy-namic range.II. DESIGNFigure 1: Schematic view of the mechanical designThe mechanical design is shown in figure 1. The lens is a standard video camera lens mounted on the light port via an adapter. It focuses the light into chassis 1 and onto the photo-diode. The diode is mounted on a micrometer so the ________________________* Work performed under the auspices of the U.S. Department of Energy beam spot can be centered. Current from the diode runs through a double shielded cable to the electronics located in Figure 2: Electronic System diagramFigure 3: Timing diagramThe electronic system and timing diagrams are shown in figure 2 and figure 3 respectively. At the end of timing cycle N-1, the absolute current in the ring is measured by closing SW1 and integrating the photodiode current on the bottom plate of C1 for 50mS. The interrupt flip flop is then reset in preparation for timing cycle N. A timing pulse sets the flip flop and interrupts the microcontroller 100mS after a shot has been injected into the ring. This allows the beam to damp andprevents fluctuations in the diode current due to beam motion.The microcontroller then reverses the polarity of SW2. SW1closes again and integrates the photodiode current on the top plate of C1. The charge remaining on C1 is proportional to the current injected into the ring. At this point SW4 closes, reset-ting the charge sensitive amplifier. After SW4 opens SW3closes to transfer the charge from C1 to C2, updating the out-put signal. Since C1 = 10µF and C2 = 4.7 nF the voltage gain = 2100. The output is buffered with a differential driver and transmitted to the control room for display on a digital oscillo-scope.The OPT201[1] is a low noise photodiode and a transim-pedance amplifier fabricated on the same chip. In this appli-cation it has been configured to provide a current output. SW1and SW2 are LTC1043 [2] FET switches. C1 is made large to keep the input signals near ground. This makes the switch charge injection less than 1pC, contributing less than 200µV to the output offset voltage. The ACF2101 [1] is a dual analog integrator also with low noise and low charge injection characteristics.A Basic Stamp TM[3] microcontroller sequences the FET switches. Since the Stamp is programmed in a dialect of the Basic programming language, only 11 executable lines of code are required to produce the needed timing signals. Pro-grams are downloaded from a PC via the parallel port.Variables can be sent back to the PC at run time for debugging purposes, making an emulator unnecessary. The code is stored in an EEPROM so programs can be updated at any time.III. PERFORMANCEThe resolution as a function of beam current is shown in figure 4. The noise floor is given by:I N = 1µA * (1 + (I BEAM µA/ 27369) )Despite the increase in noise at high currents the monitor can still resolve 37ppm changes in beam current with 850mA in the ring.10203040I B (mA)N o i s e (µA R M S )10−310−210−1100101102103Figure 4: Resolution as a function of beam currentIV. CONCLUSIONSThe charge balancing technique used in this fill rate moni-tor allows high resolution measurements to be made over a wide range of beam current. The performance can be further enhanced by moving the unit to a beam port that sees less beam motion. Even so, it measures small changes in current much better than previous detectors, opening the possibility of using charge balancing techniques to measure beam lifetime.VI. REFERENCES[1]Burr Brown Corporation, Linear Products, P.O. Box 11400Tucson, AZ 85734-1400[2]Linear Technology Corporation, 1630 McCarthy Blvd,Milpitas, CA 95035[3]Parallax, Inc. 3805 Atherton Road, #102, Rocklin, CA 95765V. ACKNOWLEDGMENTSThanks to Henry Link for technical support.。