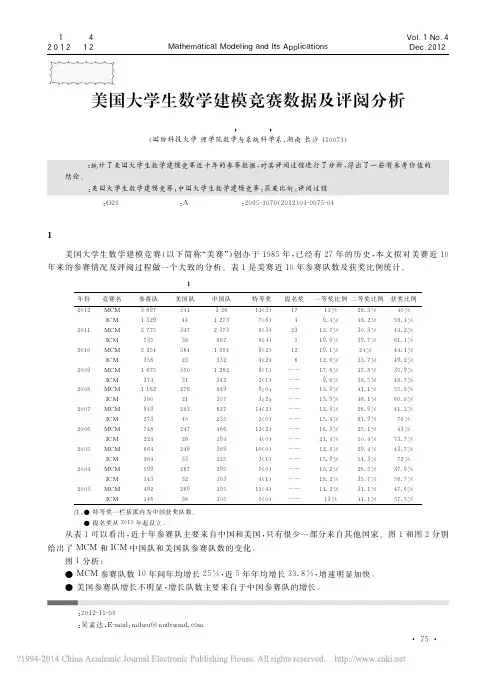
2016美国大学生数学建模比赛H奖
- 格式:pdf
- 大小:642.63 KB
- 文档页数:21
1985 年美国大学生数学建模竞赛MCM 试题1985年MCM:动物种群选择适宜的鱼类和哺乳动物数据准确模型。
模型动物的自然表达人口水平与环境相互作用的不同群体的环境的重要参数,然后调整账户获取表单模型符合实际的动物提取的方法。
包括任何食物或限制以外的空间限制,得到数据的支持。
考虑所涉及的各种数量的价值,收获数量和人口规模本身,为了设计一个数字量代表的整体价值收获。
找到一个收集政策的人口规模和时间优化的价值收获在很长一段时间。
检查政策优化价值在现实的环境条件。
1985年MCM B:战略储藏管理钴、不产生在美国,许多行业至关重要。
(国防占17%的钴生产。
1979年)钴大局部来自非洲中部,一个政治上不稳定的地区。
1946年的战略和关键材料储藏法案需要钴储藏,将美国政府通过一项为期三年的战争。
建立了库存在1950年代,出售大局部在1970年代初,然后决定在1970年代末建立起来,与8540万磅。
大约一半的库存目标的储藏已经在1982年收购了。
建立一个数学模型来管理储藏的战略金属钴。
你需要考虑这样的问题:库存应该有多大?以什么速度应该被收购?一个合理的代价是什么金属?你也要考虑这样的问题:什么时候库存应该画下来吗?以什么速度应该是画下来吗?在金属价格是合理出售什么?它应该如何分配?有用的信息在钴政府方案在2500万年需要2500万磅的钴。
美国大约有1亿磅的钴矿床。
生产变得经济可行当价格到达22美元/磅(如发生在1981年)。
要花四年滚动操作,和thsn六百万英镑每年可以生产。
1980年,120万磅的钴回收,总消费的7%。
1986 年美国大学生数学建模竞赛MCM 试题1986年MCM A:水文数据下表给出了Z的水深度尺外表点的直角坐标X,Y在码(14数据点表省略)。
深度测量在退潮。
你的船有一个五英尺的草案。
你应该防止什么地区的矩形(75200)X(-50、150)?1986年MCM B:Emergency-Facilities位置迄今为止,力拓的乡牧场没有自己的应急设施。
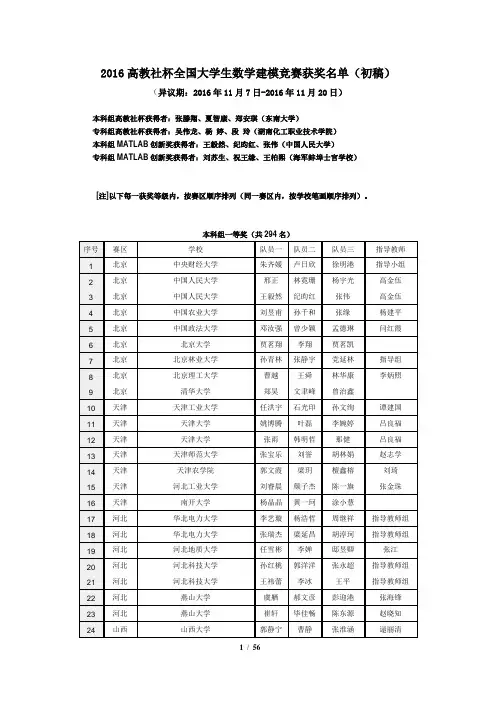
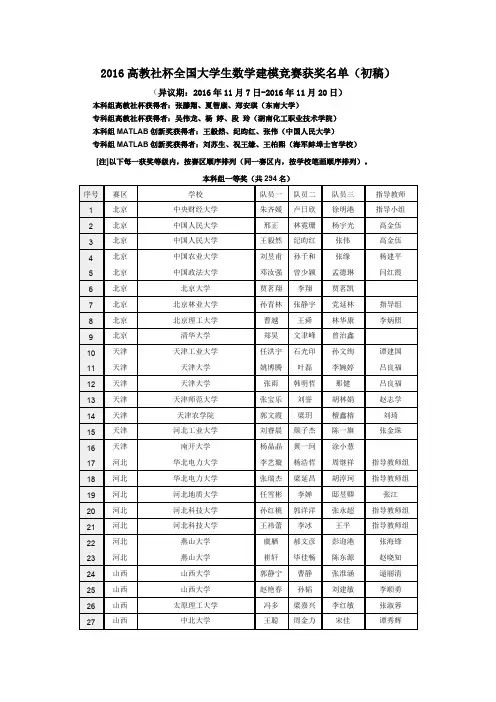
2016高教社杯全国大学生数学建模竞赛获奖名单(初稿)(异议期:2016年11月7日-2016年11月20日)
本科组高教社杯获得者:张滕翔、夏智康、郑安琪(东南大学)
专科组高教社杯获得者:吴伟龙、杨婷、段玲(湖南化工职业技术学院)
本科组MATLAB创新奖获得者:王毅然、纪昀红、张伟(中国人民大学)
专科组MATLAB创新奖获得者:刘苏生、祝王缘、王柏熙(海军蚌埠士官学校)
[注]以下每一获奖等级内,按赛区顺序排列(同一赛区内,按学校笔画顺序排列)。
本科组一等奖(共294名)
本科组二等奖(共1621名)
曹小
专科组一等奖(共60名)。
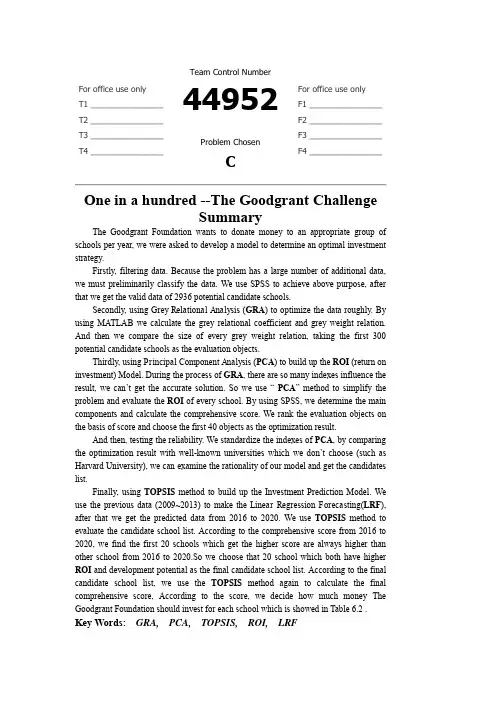
Contents1.Introduction (1)1.1 Background (1)1.2 Foundation & ROI (1)2 Task (1)3 Fundamental assumptions (2)4 Definitions and Notations (2)5 Models (3)5.1 Filter data (3)5.2 Object Selection Model (Grey Relational Analysis) (4)5.2.1 Model analysis (4)5.2.2 Model solution (4)5.3 ROI Model (Principal Component Analysis) (5)5.3.1 Model analysis (5)5.3.2 Model solution (6)5.4 Verify the possibility (9)5.4.1 Comparison (9)5.4.2 External factor (10)5.5 Investment Forecast Model (11)5.5.1 Linear Regression Forecasting Model (11)5.5.2 School potential Prediction (TOPSIS) (12)5.5.3 Final investment (TOPSIS) (13)6 Conclusions (16)7 Strengths and Weaknesses (18)7.1 Strengths (19)7.2 Weaknesses (20)8 Letter to Mr. Alpha Chiang (21)9 References (22)Team # 44952 Page 1 of 221 Introduction1.1 BackgroundThe Goodgrant Foundation is a charitable organization that wants to help improve educational performance of undergraduates attending colleges and universities in the United States. To do this, the foundation intends to donate a total of $100,000,000 (US100 million) to an appropriate group of schools per year, for five years, starting July 2016. In doing so, they do not want to duplicate the investments and focus of other large grant organizations such as the Gates Foundation and Lumina Foundation.Our team has been asked by the Goodgrant Foundation to develop a model to determine an optimal investment strategy that identifies the schools, the investment amount per school, the return on that investment, and the time duration that the organi zation’s money should be provided to have the highest likelihood of producing a strong positive effect on student performance. This strategy should contain a 1 to N optimized and prioritized candidate list of schools you are recommending for investment bas ed on each candidate school’s demonstrated potential for effective use of private funding, and an estimated return on investment (ROI) defined in a manner appropriate for a charitable organization such as the Goodgrant Foundation.1.2 Foundation & ROIFoundation (charitable foundation) refers to the nonprofit legal person who uses the property of the natural persons, legal persons or other organizations to engage in public welfare undertakings. In terms of its nature, foundation is a kind of folk non-profit organizations.ROI is a performance measure used to evaluate the efficiency of an investment or to compare the efficiency of a number of different investments. ROI measures the amount of return on an investment relative to the investment’s cost. To calculate ROI, the benefit (or return) of an investment is divided by the cost of the investment, and the result is expressed as a percentage or a ratio.2 Task●One-page summary for our MCM submission●Using our models to achieve the candidate list of schools●Calculate the time durati on that the organization’s money should be provided to have thehighest likelihood of producing a strong positive effect on student performance●Calculate the investment amount Goodgrant Foundation would pay for each school●Calculate the ROI of the Goodgrant Foundation●Forecast the development of this kind of investment mode●Write a letter to the CFO of the Goodgrant Foundation, Mr. Alpha Chiang, that describesthe optimal investment strategy。
2016高教社杯全国大学生数学建模竞赛获奖名单(初稿)(异议期:2016年11月7日-2016年11月20日)
本科组高教社杯获得者:张滕翔、夏智康、郑安琪(东南大学)
专科组高教社杯获得者:吴伟龙、杨婷、段玲(湖南化工职业技术学院)
本科组MATLAB创新奖获得者:王毅然、纪昀红、张伟(中国人民大学)
专科组MATLAB创新奖获得者:刘苏生、祝王缘、王柏熙(海军蚌埠士官学校)
[注]以下每一获奖等级内,按赛区顺序排列(同一赛区内,按学校笔画顺序排列)。
本科组一等奖(共294名)
本科组二等奖(共1621名)
曹小
专科组一等奖(共60名)。

For office use only T1T2T3T4T eam Control Number42939Problem ChosenCFor office use onlyF1F2F3F42016Mathematical Contest in Modeling(MCM)Summary Sheet (Attach a copy of this page to each copy of your solution paper.)SummaryIn order to determine the optimal donation strategy,this paper proposes a data-motivated model based on an original definition of return on investment(ROI) appropriate for charitable organizations.First,after addressing missing data,we develop a composite index,called the performance index,to quantify students’educational performance.The perfor-mance index is a linear composition of several commonly used performance indi-cators,like graduation rate and graduates’earnings.And their weights are deter-mined by principal component analysis.Next,to deal with problems caused by high-dimensional data,we employ a lin-ear model and a selection method called post-LASSO to select variables that statis-tically significantly affect the performance index and determine their effects(coef-ficients).We call them performance contributing variables.In this case,5variables are selected.Among them,tuition&fees in2010and Carnegie High-Research-Activity classification are insusceptible to donation amount.Thus we only con-sider percentage of students who receive a Pell Grant,share of students who are part-time and student-to-faculty ratio.Then,a generalized adaptive model is adopted to estimate the relation between these3variables and donation amount.Wefit the relation across all institutions and get afitted function from donation amount to values of performance contributing variables.Then we divide the impact of donation amount into2parts:homogenous and heterogenous one.The homogenous influence is modeled as the change infit-ted values of performance contributing variables over increase in donation amount, which can be predicted from thefitted curve.The heterogenous one is modeled as a tuning parameter which adjusts the homogenous influence based on deviation from thefitted curve.And their product is increase in true values of performance over increase in donation amount.Finally,we calculate ROI,defined as increase in performance index over in-crease in donation amount.This ROI is institution-specific and dependent on in-crease in donation amount.By adopting a two-step ROI maximization algorithm, we determine the optimal investment strategy.Also,we propose an extended model to handle problems caused by time dura-tion and geographical distribution of donations.A Letter to the CFO of the Goodgrant FoundationDear Chiang,Our team has proposed a performance index quantifying the students’educational per-formance of each institution and defined the return of investment(ROI)appropriately for a charitable organization like Goodgrant Foundation.A mathematical model is built to help predict the return of investment after identifying the mechanism through which the donation generates its impact on the performance.The optimal investment strategy is determined by maximizing the estimated return of investment.More specifically,the composite performance index is developed after taking all the pos-sible performance indicators into consideration,like graduation rate and graduates’earnings. The performance index is constructed to represents the performance of the school as well as the positive effect that a college brings to students and the community.From this point of view, our definition manages to capture social benefits of donation.And then we adopt a variable selection method tofind out performance contributing vari-ables,which are variables that strongly affect the performance index.Among all the perfor-mance contributing variables we select,three variables which can be directly affected by your generous donation are kept to predict ROI:percentage of students who receive a Pell Grant, share of students who are part-time and student-to-faculty ratio.Wefitted a relation between these three variables and the donation amount to predict change in value of each performance contributing variable over your donation amount.And we calculate ROI,defined as increase in the performance index over your donation amount, by multiplying change in value of each performance contributing variable over your donation amount and each performance contributing variable’s effect on performance index,and then summing up the products of all performance contributing variables.The optimal investment strategy is decided after maximizing the return of investment according to an algorithm for selection.In conclusion,our model successfully produced an investment strategy including a list of target institutions and investment amount for each institution.(The list of year1is attached at the end of the letter).The time duration for the investment could also be determined based on our model.Since the model as well as the evaluation approach is fully data-motivated with no arbitrary criterion included,it is rather adaptable for solving future philanthropic educational investment problems.We have a strong belief that our model can effectively enhance the efficiency of philan-thropic educational investment and provides an appropriate as well as feasible way to best improve the educational performance of students.UNITID names ROI donation 197027United States Merchant Marine Academy21.85%2500000 102711AVTEC-Alaska’s Institute of Technology21.26%7500000 187745Institute of American Indian and Alaska Native Culture20.99%2000000 262129New College of Florida20.69%6500000 216296Thaddeus Stevens College of Technology20.66%3000000 229832Western Texas College20.26%10000000 196158SUNY at Fredonia20.24%5500000 234155Virginia State University20.04%10000000 196200SUNY College at Potsdam19.75%5000000 178615Truman State University19.60%3000000 199120University of North Carolina at Chapel Hill19.51%3000000 101648Marion Military Institute19.48%2500000187912New Mexico Military Institute19.31%500000 227386Panola College19.28%10000000 434584Ilisagvik College19.19%4500000 199184University of North Carolina School of the Arts19.15%500000 413802East San Gabriel Valley Regional Occupational Program19.09%6000000 174251University of Minnesota-Morris19.09%8000000 159391Louisiana State University and Agricultural&Mechanical Col-19.07%8500000lege403487Wabash Valley College19.05%1500000 Yours Sincerely,Team#42939An Optimal Strategy of Donation for Educational PurposeControl Number:#42939February,2016Contents1Introduction51.1Statement of the Problem (5)1.2Baseline Model (5)1.3Detailed Definitions&Assumptions (8)1.3.1Detailed Definitions: (8)1.3.2Assumptions: (9)1.4The Advantages of Our Model (9)2Addressing the Missing Values93Determining the Performance Index103.1Performance Indicators (10)3.2Performance Index via Principal-Component Factors (10)4Identifying Performance Contributing Variables via post-LASSO115Determining Investment Strategy based on ROI135.1Fitted Curve between Performance Contributing Variables and Donation Amount145.2ROI(Return on Investment) (15)5.2.1Model of Fitted ROIs of Performance Contributing Variables fROI i (15)5.2.2Model of the tuning parameter P i (16)5.2.3Calculation of ROI (17)5.3School Selection&Investment Strategy (18)6Extended Model186.1Time Duration (18)6.2Geographical Distribution (22)7Conclusions and Discussion22 8Reference23 9Appendix241Introduction1.1Statement of the ProblemThere exists no doubt in the significance of postsecondary education to the development of society,especially with the ascending need for skilled employees capable of complex work. Nevertheless,U.S.ranks only11th in the higher education attachment worldwide,which makes thefinancial support from large charitable organizations necessary.As it’s essential for charitable organizations to maximize the effectiveness of donations,an objective and systematic assessment model is in demand to develop appropriate investment strategies.To achieve this goal,several large foundations like Gates Foundation and Lumina Foundation have developed different evaluation approaches,where they mainly focus on spe-cific indexes like attendance and graduation rate.In other empirical literature,a Forbes ap-proach(Shifrin and Chen,2015)proposes a new indicator called the Grateful Graduates Index, using the median amount of private donations per student over a10-year period to measure the return on investment.Also,performance funding indicators(Burke,2002,Cave,1997,Ser-ban and Burke,1998,Banta et al,1996),which include but are not limited to external indicators like graduates’employment rate and internal indicators like teaching quality,are one of the most prevailing methods to evaluate effectiveness of educational donations.However,those methods also arise with widely acknowledged concerns(Burke,1998).Most of them require subjective choice of indexes and are rather arbitrary than data-based.And they perform badly in a data environment where there is miscellaneous cross-section data but scarce time-series data.Besides,they lack quantified analysis in precisely predicting or measuring the social benefits and the positive effect that the investment can generate,which serves as one of the targets for the Goodgrant Foundation.In accordance with Goodgrant Foundation’s request,this paper provides a prudent def-inition of return on investment(ROI)for charitable organizations,and develops an original data-motivated model,which is feasible even faced with tangled cross-section data and absent time-series data,to determine the optimal strategy for funding.The strategy contains selection of institutions and distribution of investment across institutions,time and regions.1.2Baseline ModelOur definition of ROI is similar to its usual meaning,which is the increase in students’educational performance over the amount Goodgrant Foundation donates(assuming other donationsfixed,it’s also the increase in total donation amount).First we cope with data missingness.Then,to quantify students’educational performance, we develop an index called performance index,which is a linear composition of commonly used performance indicators.Our major task is to build a model to predict the change of this index given a distribution of Goodgrant Foundation$100m donation.However,donation does not directly affect the performance index and we would encounter endogeneity problem or neglect effects of other variables if we solely focus on the relation between performance index and donation amount. Instead,we select several variables that are pivotal in predicting the performance index from many potential candidates,and determine their coefficients/effects on the performance index. We call these variables performance contributing variables.Due to absence of time-series data,it becomes difficult tofigure out how performance con-tributing variables are affected by donation amount for each institution respectively.Instead, wefit the relation between performance contributing variables and donation amount across all institutions and get afitted function from donation amount to values of performance contribut-ing variables.Then we divide the impact of donation amount into2parts:homogenous and heteroge-nous one.The homogenous influence is modeled as the change infitted values of performance contributing variables over increase in donation amount(We call these quotientsfitted ROI of performance contributing variable).The heterogenous one is modeled as a tuning parameter, which adjusts the homogenous influence based on deviation from thefitted function.And their product is the institution-specific increase in true values of performance contributing variables over increase in donation amount(We call these values ROI of performance contributing vari-able).The next step is to calculate the ROI of the performance index by adding the products of ROIs of performance contributing variables and their coefficients on the performance index. This ROI is institution-specific and dependent on increase in donation amount.By adopting a two-step ROI maximization algorithm,we determine the optimal investment strategy.Also,we propose an extended model to handle problems caused by time duration and geographical distribution of donations.Note:we only use data from the provided excel table and that mentioned in the pdffile.Table1:Data SourceVariable DatasetPerformance index Excel tablePerformance contributing variables Excel table and pdffileDonation amount PdffileTheflow chart of the whole model is presented below in Fig1:Figure1:Flow Chart Demonstration of the Model1.3Detailed Definitions&Assumptions 1.3.1Detailed Definitions:1.3.2Assumptions:A1.Stability.We assume data of any institution should be stable without the impact from outside.To be specific,the key factors like the donation amount and the performance index should remain unchanged if the college does not receive new donations.A2.Goodgrant Foundation’s donation(Increase in donation amount)is discrete rather than continuous.This is reasonable because each donation is usually an integer multiple of a minimum amount,like$1m.After referring to the data of other foundations like Lumina Foundation,we recommend donation amount should be one value in the set below:{500000,1000000,1500000, (10000000)A3.The performance index is a linear composition of all given performance indicators.A4.Performance contributing variables linearly affect the performance index.A5.Increase in donation amount affects the performance index through performance con-tributing variables.A6.The impact of increase in donation amount on performance contributing variables con-tains2parts:homogenous one and heterogenous one.The homogenous influence is repre-sented by a smooth function from donation amount to performance contributing variables.And the heterogenous one is represented by deviation from the function.1.4The Advantages of Our ModelOur model exhibits many advantages in application:•The evaluation model is fully data based with few subjective or arbitrary decision rules.•Our model successfully identifies the underlying mechanism instead of merely focusing on the relation between donation amount and the performance index.•Our model takes both homogeneity and heterogeneity into consideration.•Our model makes full use of the cross-section data and does not need time-series data to produce reasonable outcomes.2Addressing the Missing ValuesThe provided datasets suffer from severe data missing,which could undermine the reliabil-ity and interpretability of any results.To cope with this problem,we adopt several different methods for data with varied missing rate.For data with missing rate over50%,any current prevailing method would fall victim to under-or over-randomization.As a result,we omit this kind of data for simplicity’s sake.For variables with missing rate between10%-50%,we use imputation techniques(Little and Rubin,2014)where a missing value was imputed from a randomly selected similar record,and model-based analysis where missing values are substituted with distribution diagrams.For variables with missing rate under10%,we address missingness by simply replace miss-ing value with mean of existing values.3Determining the Performance IndexIn this section,we derive a composite index,called the performance index,to evaluate the educational performance of students at every institution.3.1Performance IndicatorsFirst,we need to determine which variables from various institutional performance data are direct indicators of Goodgrant Foundation’s major concern–to enhance students’educational performance.In practice,other charitable foundations such as Gates Foundation place their focus on core indexes like attendance and graduation rate.Logically,we select performance indicators on the basis of its correlation with these core indexes.With this method,miscellaneous performance data from the excel table boils down to4crucial variables.C150_4_P OOLED_SUP P and C200_L4_P OOLED_SUP P,as completion rates for different types of institutions,are directly correlated with graduation rate.We combine them into one variable.Md_earn_wne_p10and gt_25k_p6,as different measures of graduates’earnings,are proved in empirical studies(Ehren-berg,2004)to be highly dependent on educational performance.And RP Y_3Y R_RT_SUP P, as repayment rate,is also considered valid in the same sense.Let them be Y1,Y2,Y3and Y4.For easy calculation and interpretation of the performance index,we apply uniformization to all4variables,as to make sure they’re on the same scale(from0to100).3.2Performance Index via Principal-Component FactorsAs the model assumes the performance index is a linear composition of all performance indicators,all we need to do is determine the weights of these variables.Here we apply the method of Customer Satisfaction Index model(Rogg et al,2001),where principal-component factors(pcf)are employed to determine weights of all aspects.The pcf procedure uses an orthogonal transformation to convert a set of observations of pos-sibly correlated variables into a set of values of linearly uncorrelated variables called principal-component factors,each of which carries part of the total variance.If the cumulative proportion of the variance exceeds80%,it’s viable to use corresponding pcfs(usually thefirst two pcfs)to determine weights of original variables.In this case,we’ll get4pcfs(named P CF1,P CF2,P CF3and P CF4).First,the procedure provides the linear coefficients of Y m in the expression of P CF1and P CF2.We getP CF1=a11Y1+a12Y2+a13Y3+a14Y4P CF2=a21Y1+a22Y2+a23Y3+a24Y4(a km calculated as corresponding factor loadings over square root of factor k’s eigenvalue) Then,we calculate the rough weights c m for Y m.Let the variance proportions P CF1and P CF2 represent be N1and N2.We get c m=(a1m N1+a2m N2)/(N1+N2)(This formulation is justifiedbecause the variance proportions can be viewed as the significance of pcfs).If we let perfor-mance index=(P CF 1N 1+P CF 2N 2)/(N 1+N 2),c m is indeed the rough weight of Y m in terms of variance)Next,we get the weights by adjusting the sum of rough weights to 1:c m =c m /(c 1+c 2+c 3+c 4)Finally,we get the performance index,which is the weighted sum of the 4performance indicator.Performance index= m (c m Y m )Table 2presents the 10institutions with largest values of the performance index.This rank-ing is highly consistent with widely acknowledged rankings,like QS ranking,which indicates the validity of the performance index.Table 2:The Top 10Institutions in Terms of Performance IndexInstitutionPerformance index Los Angeles County College of Nursing and Allied Health79.60372162Massachusetts Institute of Technology79.06066895University of Pennsylvania79.05044556Babson College78.99269867Georgetown University78.90468597Stanford University78.70586395Duke University78.27719116University of Notre Dame78.15843964Weill Cornell Medical College 78.143341064Identifying Performance Contributing Variables via post-LASSO The next step of our model requires identifying the factors that may exert an influence on the students’educational performance from a variety of variables mentioned in the excel table and the pdf file (108in total,some of which are dummy variables converted from categorical variables).To achieve this purpose,we used a model called LASSO.A linear model is adopted to describe the relationship between the endogenous variable –performance index –and all variables that are potentially influential to it.We assign appropriate coefficient to each variable to minimize the square error between our model prediction and the actual value when fitting the data.min β1J J j =1(y j −x T j β)2where J =2881,x j =(1,x 1j ,x 2j ,...,x pj )THowever,as the amount of the variables included in the model is increasing,the cost func-tion will naturally decrease.So the problem of over fitting the data will arise,which make the model we come up with hard to predict the future performance of the students.Also,since there are hundreds of potential variables as candidates.We need a method to identify the variables that truly matter and have a strong effect on the performance index.Here we take the advantage of a method named post-LASSO (Tibshirani,1996).LASSO,also known as the least absolute shrinkage and selection operator,is a method used for variableselection and shrinkage in medium-or high-dimensional environment.And post-LASSO is to apply ordinary least squares(OLS)to the model selected byfirst-step LASSO procedure.In LASSO procedure,instead of using the cost function that merely focusing on the square error between the prediction and the actual value,a penalty term is also included into the objective function.We wish to minimize:min β1JJj=1(y j−x T jβ)2+λ||β||1whereλ||β||1is the penalty term.The penalty term takes the number of variables into con-sideration by penalizing on the absolute value of the coefficients and forcing the coefficients of many variables shrink to zero if this variable is of less importance.The penalty coefficient lambda determines the degree of penalty for including variables into the model.After min-imizing the cost function plus the penalty term,we couldfigure out the variables of larger essence to include in the model.We utilize the LARS algorithm to implement the LASSO procedure and cross-validation MSE minimization(Usai et al,2009)to determine the optimal penalty coefficient(represented by shrinkage factor in LARS algorithm).And then OLS is employed to complete the post-LASSO method.Figure2:LASSO path-coefficients as a function of shrinkage factor sFigure3:Cross-validated MSEFig2.displays the results of LASSO procedure and Fig3displays the cross-validated MSE for different shrinkage factors.As specified above,the cross-validated MSE reaches minimum with shrinkage factor between0.4-0.8.We choose0.6andfind in Fig2that6variables have nonzero coefficients via the LASSO procedure,thus being selected as the performance con-tributing variables.Table3is a demonstration of these6variables and corresponding post-LASSO results.Table3:Post-LASSO resultsDependent variable:performance_indexPCTPELL−26.453∗∗∗(0.872)PPTUG_EF−14.819∗∗∗(0.781)StudentToFaculty_ratio−0.231∗∗∗(0.025)Tuition&Fees20100.0003∗∗∗(0.00002)Carnegie_HighResearchActivity 5.667∗∗∗(0.775)Constant61.326∗∗∗(0.783)Observations2,880R20.610Adjusted R20.609Note:PCTPELL is percentage of students who receive aPell Grant;PPTUG_EF is share of students who are part-time;Carnegie_HighResearchActivity is Carnegie classifica-tion basic:High Research ActivityThe results presented in Table3are consistent with common sense.For instance,the pos-itive coefficient of High Research Activity Carnegie classification implies that active research activity helps student’s educational performance;and the negative coefficient of Student-to-Faculty ratio suggests that decrease in faculty quantity undermines students’educational per-formance.Along with the large R square value and small p-value for each coefficient,the post-LASSO procedure proves to select a valid set of performance contributing variables and describe well their contribution to the performance index.5Determining Investment Strategy based on ROIWe’ve identified5performance contributing variables via post-LASSO.Among them,tu-ition&fees in2010and Carnegie High-Research-Activity classification are quite insusceptible to donation amount.So we only consider the effects of increase in donation amount on per-centage of students who receive a Pell Grant,share of students who are part-time and student-to-faculty ratio.We denote them with F1,F2and F3,their post-LASSO coefficients withβ1,β2andβ3.In this section,wefirst introduce the procedure used tofit the relation between performance contributing variables and donation amount.Then we provide the model employed to calcu-latefitted ROIs of performance contributing variables(the homogenous influence of increase in donation amount)and the tuning parameter(the heterogenous influence of increase in dona-tion amount).Next,we introduce how to determine stly,we show how the maximiza-tion determines the investment strategy,including selection of institutions and distribution of investments.5.1Fitted Curve between Performance Contributing Variables and Donation AmountSince we have already approximated the linear relation between the performance index with the3performance contributing variables,we want to know how increase in donation changes them.In this paper,we use Generalized Adaptive Model(GAM)to smoothlyfit the relations. Generalized Adaptive Model is a generalized linear model in which the dependent variable depends linearly on unknown smooth functions of independent variables.Thefitted curve of percentage of students who receive a Pell Grant is depicted below in Fig4(see the other two fitted curves in Appendix):Figure4:GAM ApproximationA Pell Grant is money the U.S.federal government provides directly for students who needit to pay for college.Intuitively,if the amount of donation an institution receives from other sources such as private donation increases,the institution is likely to use these donations to alleviate students’financial stress,resulting in percentage of students who receive a Pell Grant. Thus it is reasonable to see afitted curve downward sloping at most part.Also,in commonsense,an increase in donation amount would lead to increase in the performance index.This downward sloping curve is consistent with the negative post-LASSO coefficient of percentage of students who receive a Pell Grant(as two negatives make a positive).5.2ROI(Return on Investment)5.2.1Model of Fitted ROIs of Performance Contributing Variables fROI iFigure5:Demonstration of fROI1Again,we usefitted curve of percentage of students who receive a Pell Grant as an example. We modeled the bluefitted curve to represent the homogeneous relation between percentage of students who receive a Pell Grant and donation amount.Recallfitted ROI of percentage of students who receive a Pell Grant(fROI1)is change in fitted values(∆f)over increase in donation amount(∆X).SofROI1=∆f/∆XAccording to assumption A2,the amount of each Goodgrant Foundation’s donation falls into a pre-specified set,namely,{500000,1000000,1500000,...,10000000}.So we get a set of possible fitted ROI of percentage of students who receive a Pell Grant(fROI1).Clearly,fROI1is de-pendent on both donation amount(X)and increase in donation amount(∆X).Calculation of fitted ROIs of other performance contributing variables is similar.5.2.2Model of the tuning parameter P iAlthough we’ve identified the homogenous influence of increase in donation amount,we shall not neglect the fact that institutions utilize donations differently.A proportion of do-nations might be appropriated by the university’s administration and different institutions allocate the donation differently.For example,university with a more convenient and well-maintained system of identifying students who needfinancial aid might be willing to use a larger portion of donations to directly aid students,resulting in a lower percentage of under-graduate students receiving Pell grant.Also,university facing lower cost of identifying and hiring suitable faculty members might be inclined to use a larger portion of donations in this direction,resulting in a lower student-to-faculty ratio.These above mentioned reasons make institutions deviate from the homogenousfitted func-tion and presents heterogeneous influence of increase in donation amount.Thus,while the homogenous influence only depends on donation amount and increase in donation amount, the heterogeneous influence is institution-specific.To account for this heterogeneous influence,we utilize a tuning parameter P i to adjust the homogenous influence.By multiplying the tuning parameter,fitted ROIs of performance con-tributing variables(fitted value changes)convert into ROI of performance contributing variable (true value changes).ROI i=fROI i·P iWe then argue that P i can be summarized by a function of deviation from thefitted curve (∆h),and the function has the shape shown in Fig6.The value of P i ranges from0to2,because P i can be viewed as an amplification or shrinkage of the homogenous influence.For example,P i=2means that the homogeneous influence is amplified greatly.P i=0means that this homogeneous influence would be entirely wiped out. The shape of the function is as shown in Fig6because of the following reasons.Intuitively,if one institution locates above thefitted line,when deviation is small,the larger it is,the larger P i is.This is because the institution might be more inclined to utilize donations to change that factor.However,when deviation becomes even larger,the institution grows less willing to invest on this factor.This is because marginal utility decreases.The discussion is similar if one institution initially lies under thefitted line.Thus,we assume the function mapping deviation to P i is similar to Fig6.deviation is on the x-axis while P i is on the y-axis.Figure6:Function from Deviation to P iIn order to simplify calculation and without loss of generality,we approximate the function。
小区开放对道路通行的影响评价模型摘要本文针对小区开放对道路的影响进行了研究,建立了层次分析模型、通行能力评价模型,使用了MATLAB、EXCEL等软件,得出小区开放在不同条件下会对道路交通产生不同的影响。
首先运用层次分析法,分析得出整体一般情况下小区开放有利于周边道路交通的结论。
之后构建了不同类型的小区,并分析得出小区开放的效果与小区结构及周边道路结构、车流量有关,因此小区开放不能盲目采取,要因地制宜。
最后根据分析结果,从交通通行的角度,向城市规划和交通管理部门提出了关于小区开放的合理化建议。
本文的突出特点是使用了层次分析法定量的比较了小区开放前后道路合理性,构建了对于研究该问题具有代表性的三种类型的小区,并建立了影响评估模型,客观的对不同小区结构及周边道路结构、车辆通行的影响进行评价。
针对问题一,首先查阅相关资料选取影响道路通行的指标,并对选取的指标进行筛选,然后运用各项指标进行层次分析,通过小区开放和小区封闭对道路交通和理性的判断来分析小区开放对道路通行的影响最后得出从整体看来,小区开放有利于道路通行。
针对问题二,通过查阅有关道路通行能力的相关资料建立了通行能力评价模型,首先根据模型求出道路基本通行能力的表达式,基本通行能力是理想状态下的通行能力,与实际情况分析对比存在差异。
因此基于差异,通过各实际因素对道路通行能力的影响进行修正,得到实际道路通行能力的数据。
最终计算出小区开放前后实际通行能力的相对系数。
针对问题三,构建了三种类型的小区,不同类型的小区具有不同的结构及不同的周边道路结构、车流量,应用问题二建立的模型分别对三种小区开放和封闭条件下周边道路的实际通行能力进行了计算,通过相对系数评价不同类型的小区开放对道路通行的影响,分析得出小区开放与地理位置、内部结构等因素有关,不能一概而论。
针对问题四,结合前述模型结果分析结果,从交通出行角度对城市规划部门和交通管理部门提出了合理化意见。
小区开放要合理的实施以体现小区开放的意义。