PPT
祝你学习快乐!
PPT
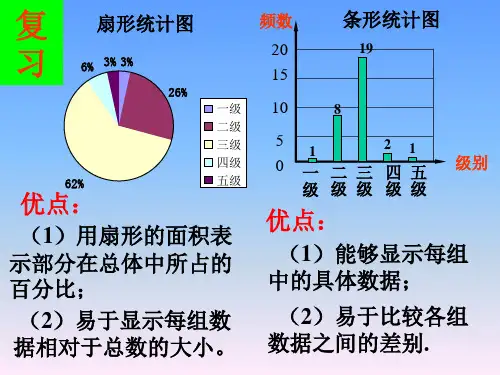
折线统计图
本编为大家提供各种类型的PPT课件,如数学课件、语文课件、英语课件、地理课件、历史课件、政治课件、化学课件、物理课件等等,想了解不同课件格式和写法,敬请下载! Moreover, our store provides various types of classic sample essays, such as contract agreements, documentary evidence, planning plans, summary reports, party and youth organization materials, reading notes, post reading reflections, essay encyclopedias, lesson plan materials, other sample essays, etc. If you want to learn about different formats and writing methods of sample essays, please stay tuned!
PPT
这样看着不太容易比较出生人口数和死亡人口数的情况啊!怎样比较方便呢?
有复式条形统计图,也应该有复式折线统计图吧?
你能完成下面的复式折线统计图吗?
PPT
PPT
PPT
从这个复式折线统计图中我们可以清楚地看到出生人口和死亡人口数的关系。
出生人口和死亡人口之差是人口自然增加数。上海人口从1995年开始负增长。
(4)从统计图中,你还能得到哪些信息,你还能提出哪些问题?
(2)哪个庙会的游览人数上升得快,下降得也快?
(3)假如明年要游览庙会,你认为哪天比较好?