中级微观经济学讲义-2
- 格式:ppt
- 大小:227.50 KB
- 文档页数:34






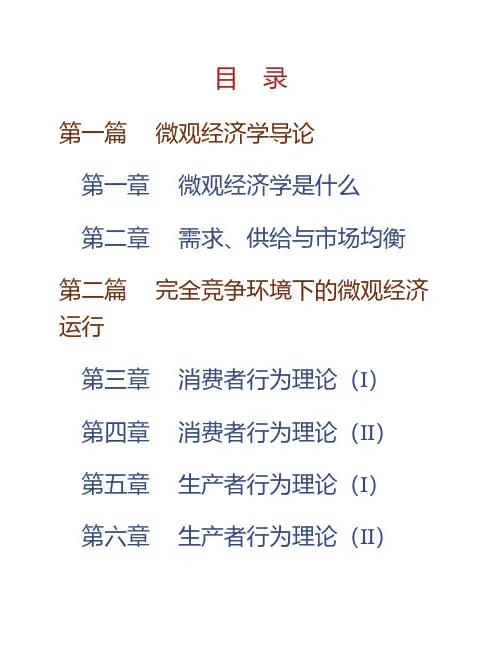
目 录第一篇 微观经济学导论第一章 微观经济学是什么第二章 需求、供给与市场均衡第二篇 完全竞争环境下的微观经济运行第三章 消费者行为理论(Ⅰ)第四章 消费者行为理论(Ⅱ)第五章 生产者行为理论(Ⅰ)第六章 生产者行为理论(Ⅱ)第七章 竞争性市场分析:产品市场第八章 竞争性市场分析:要素市场第九章 一般均衡与福利经济学第三篇 不完全竞争环境下的微观经济运行第十章 完全垄断理论第十一章 垄断竞争理论第十二章 寡头市场第十三章 博弈论与厂商的策略性行为第十四章 不完全竞争下的要素价格理论第四篇 不确定下、信息与市场失灵第十五章 不确定性、风险与信息非对称第十六章 市场失灵、外部性与公共物品第一篇 微观经济学导论第一章 微观经济学是什么1判断题(1)任何不对其索取价格的物品都是自由取用物品。
( )【答案】×【解析】自由取用物品是指相对于人类的欲望来说,其数量是无限的,取用时不需要花费任何代价,其价格为零,如自然界中的空气、水等。
但是不对其索取价格并不代表都是自由取用物品,如得到免费馈赠的物品,对于被赠与人来说未被索取任何价格,但该物品仍是经济物品。
(2)稀缺物品一定有一个直接以货币支付的价格。
( )【答案】×【解析】稀缺物品是指相对于人类无限多样性的需要或欲望而言,其数量是有限的,取用时需要付出一定的代价,其机会成本大于零。
但不是所有的稀缺性都可以用货币来表示。
例如,随着工业的发展和环境污染,清洁的水和新鲜的空气逐渐变得稀缺,但难以用货币来衡量。
(3)如果你得到两张免费的奥运会参观券,它们可以看作是自由取用物。
( )【答案】×【解析】自由物品的免费取用是对于所有社会成员而言的,奥运会参观券对于其他人来说,仍需支付一定的价格,所以是稀缺物品。
(4)如果某种资源免费供应时社会成员所需要的多于现有的,那么,这种资源就是稀缺的。
( )【答案】√【解析】当某种资源免费供应社会成员所需要的多于现有的,便出现了资源的有限性与欲望的无限性的矛盾,从而这种资源是稀缺的。
第二章:偏好、效用函数与消费者的选择 一、消费者行为模型1212,1122MAX (,)...X X U X X S T P X P X m +≤二、偏好的几个性质 1、完备性;completeness 2、自反性;reflexivity 3、传递性;transitivity 4、单调性;monotonicity 5、凸性;convexity6、局部非饱和性;local nonsatiation7、连续性:continuity 。
三、效用函数存在吗?()()x y u x u y =⇔≥四、几种典型的效用函数1、科布-道格拉斯效用函数;11212(,)U X X X X αα-=X 2a X0 x 1边际替代率MRS=2112//(0)x x mu mu du =-=,它是递减的。
2、(拟)线性效用函数; 1212(,)()U X X X V X =+1/2121212(,)()U X X X V X x x =+=+的图示如下:3、里昂惕夫效用函数;1212(,)min ,U X X aX bX ⎡⎤=⎣⎦4、固定弹性的效用函数:1/12(,)()12U X X aX bX ρρρ=+。
五、预算约束线 1、线性的;p 1x i +p 2x 2=mX 20 x 1X 20 x 1X 20 x 12、非线性的。
某人拥有初始财富A 元,同时按法律规定,他工作时间一天不得超过12小时。
如果他正常上班8小时之内,则每小时工资为w 元,如果超过8小时,则工资加倍。
六、求解需求曲线与间接效用函数1211212,1122MAX (,)...X X U X X X X S T P X P X m αα-=+≤求解此模型可得需求函数和间接效用函数,即:1、需求函数:11212122(,,)(1)(,,)mX p p m p mX p p m p αα=-=112212(,,)1(,,)2(1)X p p m X p p m p m p mαα==-c0 12 16 8 RX 20 x 12、间接效用函数:112121(,,)()()V p p m m p p αααα--=,若12α=,则11212121(,,)()()2mV p p m m p p p p αααα--==七、比较静态分析1122111122212121222211212122(,,)(,,)(,,)(,,)(1)(,,)(,,)(1)x p p m m p p x p p m p x p p m p x p p m mp p x p p m m p x p p m m p αααα∂=-∂∂=∂∂=∂∂-=-∂∂=∂∂-=∂X 2BX 1消费者模型X2BCD0X1x1商品的价格变化效应第三章、斯卢茨基方程一、成本最小化模型121122,12Min ..(,).h h Ph P h S T U h h u +≥二、希克斯需求函数与支出函数1122121211122212(,,)(,,)(,,)(,,)(,,).h p p u h p p u e p p u p h p p u p h p p u =+ 三、一个求解思路(希克斯分解与斯卢茨基分解)1、斯卢茨基分解:以 0x 为标准来区分收入效应;2、希克斯分解:以 0u 为标准来区分收入效应。
Demand1.Demand.2.Supply.3.Market Equilibrium.4.Shocking the Equilibrium.5.Effects of Government Interventions.6.When to Use the Supply-and-DemandModel.• The following factors determine the demand for a good:w♦ Price of the goodw♦ Tastesw♦ Informationw♦ Prices of other goods• Complements and substitutesw♦ Incomew♦ Government rules and regulationsw♦ Other factors• Quantity demanded - the amount of a good that consumers are willing to buy at a given price, holding constant the other factors that influence purchases.• Demand curve - the quantity demanded at each possible price, holding constantthe other factors that influence purchasesg k r e p $ , pEffect of a 60¢ increase in the price of beef 3.30• The processed pork demand function is:Q = D(p, p b, p c, Y)w♦ where Q is the quantity of pork demanded w♦ p is the price of pork (dollars per kg)w♦ p b is the price of beef (dollars per kg)w♦ p c is the price of chicken (dollars per kg)w♦ Y is the income of consumers (thousanddollars)• Estimated demand function for pork:Q = 171−20p + 20p b + 3p c + 2Y• Using the values p b = 4, p c = 3.33 and Y =12.5, we haveQ = 286−20pw which is the linear demand function for pork.• How much would the price have to fall for consumers to be willing to buy 1 millionmore kg of pork per year?1. Express the price that consumers arewilling to pay as a function of quantity.Q = 286−20p20p = 286 - Qp = 14.30 − 0.05QSolved Problem 2.12. Use the inverse demand curve to determinehow much the price must change forconsumers to buy 1 million more kg of pork per year.Δp = p2− p1= (14.30 − 0.05Q2) − (14.30 − 0.05Q1) = –0.05(Q2− Q1)= –0.05ΔQ.w The change in quantity is ΔQ = Q2− Q1 = (Q1 +1)−Q1 = 1, so the change in price is Δp = –0.05.• The total demand shows the total quantity demanded at each price• The total quantity demanded at a given price is the sum of the quantity each consumer demands at that price• Q = Q1 + Q2 = D1(p) + D2(p)Application Aggregating the Demandfor Broadband Service• The following factors determine the supply for a good:w♦ Price of the goodw♦ Costsw♦ Government rules and regulations• Quantity supplied - the amount of a good that firms want to sell at a given price, holding constant other factors that influence firms’ supply decisions, such as costs and government actions• Supply curve - the quantity supplied at each possible price, holding constant the other factors that influence firms’ supplydecisionsp , $ p e r k gS SThe Supply Function• The processed pork supply function is:Q = S(p, p h)w♦ where Q is the quantity of pork suppliedw♦ p is the price of pork (dollars per kg)w♦ ph is the price of a hog (dollars per kg)From the Supply Function to the SupplyCurve• Estimated demand function for pork:Q = 178 + 40p−60p h• Using the values p h = $1.50 per kgQ = 88 + 40p.• What happens to the quantity supplied if the price of processed pork increases by Δp =p2−p1?• The total supply curve shows the total quantity produced by all suppliers at each price• Horizontal sum of each producer’s supply curvew Sum of all quantities supplied at a given priceFigure 2.5 Total Supply: The Sum ofDomestic and Foreign Supply• How does a quota set by the United States on foreign steel imports of Q affect the total American supply curve for steel given the domestic supply, S d in panel a of the graph, and foreign supply, S f inpanel b?Solved Problem 2.2• Equilibrium - a situation in which no one wants to change his or her behaviorw♦ equilibrium price is the price at whichconsumers can buy as much as they wantand sellers can sell as much as they wantw♦ equilibrium quantity is the quantity boughtand sold at the equilibrium price• Excess demand the amount by which the quantity demanded exceeds the quantity supplied at a specified price.• Excess supply the amount by which the quantity supplied is greater than thequantity demanded at a specified priceBelow the equilibrium price….the quantity supplied….• Demand: Q d= 286 − 20p• Supply: Q s = 88 + 40p• Equilibrium:Q d = Q s286 − 20p = 88 + 40p60p = 198P = $3.30Q = 286 – 20(3.3) = 220• The demand function for a good isQ = a−bp, and the supply function isQ = c + ep, where a, b, c, and e are positive constants. Solve for the equilibrium price and quantity in termsof these four constants.The equilibrium changes only if a shock occurs that shifts the demand curve or the supply curve. These curves shift if one of the variables we were holding constantchanges.• Mathematically, how does the equilibrium price of pork vary as the price of hogs changes if the variables that affect demand are held constant at their typicalvalues?Solved Problem 2.31. Solve for the equilibrium price of pork in termsof the price of hogs.Q d = 286−20pQ s = 178 + 40p −60p h286−20p = 178 + 40p −60p h -60p = 108 – 60p h -p = 1.8 – p h2. Show how the equilibrium price of pork varieswith the price of hogs.w Since Δp = Δp h, a ny increase in the price of hogs causes an equal increase in the price of processed pork.• Government action can causew♦ a shift in the supply curve, the demand curve, or bothw♦ the quantity demanded to be different fromquantity supplied• Policies that shift supply curvesw♦ Licensing laws, quotas• Policies that cause demand to differ from supplyw♦ Price ceilings, price floors• Solved Problem 2.4e 1Supply shifts to the left….which creates excessdemand.• Suppose that there is a single labor market in which everyone is paid the same wage. If a binding minimum wage, w, is imposed, what happens to the equilibrium in this market?• Answer:w♦ Show the initial equilibrium before the minimum wage is imposed.w♦ Draw a horizontal line at the minimum wage, andshow how the market equilibrium changes.Figure 2.10 Minimum Wage• The quantity that firms want to sell and the quantity that consumers want to buy at a given price need not equal the actual quantity that is bought and sold.w Example: price ceiling.• Everyone is a price taker.• Firms sell identical products.• Everyone has full information about the price and quality of goods.• Costs of trading are low.Figure 2A.1 Regression。