华中科技大学流体力学课件Fm8解析
- 格式:ppt
- 大小:7.72 MB
- 文档页数:8
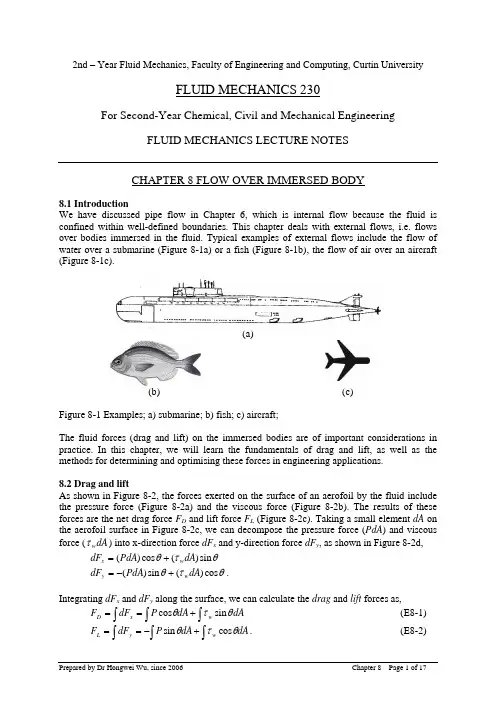
2nd – Year Fluid Mechanics, Faculty of Engineering and Computing, Curtin University FLUID MECHANICS 230For Second-Year Chemical, Civil and Mechanical EngineeringFLUID MECHANICS LECTURE NOTESCHAPTER 8 FLOW OVER IMMERSED BODY8.1 IntroductionWe have discussed pipe flow in Chapter 6, which is internal flow because the fluid is confined within well-defined boundaries. This chapter deals with external flows, i.e. flows over bodies immersed in the fluid. Typical examples of external flows include the flow of water over a submarine (Figure 8-1a) or a fish (Figure 8-1b), the flow of air over an aircraft (Figure 8-1c).(a)(b) (c)Figure 8-1 Examples; a) submarine; b) fish; c) aircraft;The fluid forces (drag and lift) on the immersed bodies are of important considerations in practice. In this chapter, we will learn the fundamentals of drag and lift, as well as the methods for determining and optimising these forces in engineering applications.8.2 Drag and liftAs shown in Figure 8-2, the forces exerted on the surface of an aerofoil by the fluid include the pressure force (Figure 8-2a) and the viscous force (Figure 8-2b). The results of these forces are the net drag force F D and lift force F L (Figure 8-2c). Taking a small element dA on the aerofoil surface in Figure 8-2c, we can decompose the pressure force (PdA ) and viscous force (dA w τ) into x-direction force dF x and y-direction force dF y , as shown in Figure 8-2d,θτθsin )(cos )(dA PdA dF w x += θτθcos )(sin )(dA PdA dF w y +−=.Integrating dF x and dF y along the surface, we can calculate the drag and lift forces as, dA dA P dF F w x D ∫∫∫+==θτθsin cos (E8-1) ∫∫∫+−==dA dA P dF F w y L θτθcos sin . (E8-2)Equations E8-1 and E8-2 reveals that 1) both shear stress and pressure contribute to the drag and lift. In the case of drag, the former is called friction drag ; the later is called pressure drag ;2) to calculate drag and lift, sufficient knowledge are required on three aspects: the body shape as it determines the distribution of θ; the distribution of pressure P and the distribution of shear stress w τ along the surface.Practically, it is very difficult to obtain the distribution of pressure and shear stress. Therefore, E8-1 and E8-2 are generally not very useful. To make it easy for engineers, dimensionless coefficients are often used instead. These dimensionless numbers are called drag coefficient C D and lift coefficient C L , defined as A V F C D D 22ρ= (E8-3) A V F C L L 22ρ= (E8-4) where A is projected (or frontal) area, i.e. the project area of the body in the flow direction.Figure 8-2 Forces on an aerofoil [1]: a) pressure force; b) viscous force; c). resultant drag andlift; d) pressure and viscous forces on a small surface area dA in (c), plotted in an x-y coordination system.8.3 The boundary layer8.3.1 Hydraulician and hydrodynamicistFor a fundamental understanding on the cause of drag and lift, we must have a good understanding on the boundary layer concept. Let’s start with some historical background on two groups of fluid mechanicians who developed two different approaches in dealing with problems of fluid mechanics by late 19th century.One is the group of hydraulicians, focused on experiments and attempted to generalise useful design equations from experimental data. This group developed the filed of experimental hydraulics, delivering empirical solutions with little theoretical content. The other is the group of hydrodynamicists, who focused on differential equations describing flows and tried to apply them to practical problems. In order to solve these differential equations, the fluid was assumed to have zero viscosity and constant density. This group developed the filed of theoretical hydrodynamics, seeking pure theoretical solutions based on ideal-fluid flows.The ideal-fluid solutions of hydrodynamicists agreed well with the observations of flows did not involve solid surface, e.g. tides, however did not agree with observed behaviours in the problems that concerned the hydraulicians, e.g, flow over immersed bodies. The following are two typical examples.(1) Flow over a thin plateFigure 8-3 illustrates the differences between the ideal solutions by the hydrodynamicists and the experimental observations by the hydraulicians for flow over a thin plate. For an ideal-fluid flow (Figure 8-3a), the fluid is inviscid, there is no friction between the fluid and the surface of the thin plate. Therefore, the fluid will maintain its free stream velocity when it flows over the thin plate. However, for a real-fluid flow, the interaction between the viscous fluid with the surface leads to a velocity gradient near the surface of the plate although the fluid far away from the plate still maintains its free stream velocity.(2) Flow over a circular cylinderFigure 8-5 shows the patterns of ideal and real flow over a circular cylinder. In absence of viscous effects, the wall shear stress is zero therefore the streamlines are symmetrical (see Figure 8-6a). The fluid coasts from the front (point A), pasts the top (point C) and then reaches to the rear (point F) of the cylinder.However, the experimental observations by the hydraulicians are very different from the above analysis by the hydrodynamicists, as shown in Figure 8-4b. A real-fluid flow cannot coast along the cylinder surface down to point F. Instead, flow separation occurs from the surface at a point between point C and F, leading to the formation of turbulent wake in the downstream (see Figure 8-4b). The friction between the viscous fluid and the cylinder surface leads to inevitable energy loss so that the flow does not have sufficient kinetic energy to travel along the surface down to the rear of the cylinder.From the above examples, it seems that the hydrodynamicists calculated what can NOT be observed while the hydraulicians observed what can NOT be calculated [2]. By early 20th century, the hydraulicians and hydrodynamicists had completely gone to live in their own worlds. The hydraulicians continued to solve their problems by trial and error based on experiments while the hydrodynamicists kept publishing academic papers based on mathematics with little bearing on engineering problems.(a) Ideal flow over a thin plate(b) Real flow over a thin plateFigure 8-3 Ideal (a) and real (b) flow over a thin plate(a) Ideal flow a cylinder (b) Real turbulent flow over a cylinderFigure 8-4 Ideal (a) and real (b) flow over a cylinder8.3.2 The boundary layer conceptThe revolutionary thinking was finally due in 1904. The two fields of theoretical hydrodynamics and experimental hydraulics were united by a German professor, Ludwig Prandtl (1857-1953). Prandtl proposed the concept of the boundary layer , which has brought the hydrodynamics and hydraulics together and laid the foundation of modern fluid mechanics.F A CTurbulentwakeThe key concept of the boundary layer is to conceptually divide the flow into two regions: •The boundary layer, the region close to solid surfaces, the effects of viscosity are too large to be ignored. Within the boundary layer, ideal-fluid flow is unsatisfactory and a set of boundary layer equations should be used.•Free stream region, the region outside the boundary layer, the effects of viscosity is small and can be neglected. In this region, Ideal-fluid flow is satisfactory.At the edge of boundary layer, the pressures and velocities of the two regions should be matched. Prandtl arbitrarily suggested the boundary layer be considered that region in which the x component of the velocity, v, is less than 0.99 times of the free-stream velocity, V, as shown in Figure 8-5.Figure 8-5 Thickness of the boundary layerThe introduction of the boundary layer concept is revolutionary in seamlessly uniting the fields of theoretical hydrodynamics and experimental hydraulics. The boundary layer concept is commonly accepted as the foundation of modern fluid mechanics, because it has •clarified numerous unexplained phenomena;•provided a much better intellectual basis for discussing complicated flows;•become a standard idea in minds of fluid mechanicians;•brought analogous ideas in heat and mass transfer, generally with useful results. However, it should be noted that•the division of the flow filed by the boundary layer concept does NOT correspond any physically obvious boundary;•the edge of boundary layer does NOT correspond to any sudden change in the flow but rather corresponds to an arbitrary definition;•even with this simplification the calculation is still difficult, and in general only approximate mathematical solutions are possible.Let’s use the boundary layer concept to explain the patterns of flow over a thin plate and flow over a circular cylinder at various Reynolds’ numbers.(1). Flow over a thin plate (Figure 8-6) [1]At a very low Reynolds number, e.g. Re = 0.1 (Figure 8-6a), the viscous force is more important than the inertial force. The viscous effects are therefore strong and the plate affects the flow considerably in a wide range (see the grey area) in all directions. Consequently, there is an extensively wide range around the plate in which the streamlines deflected considerably. The boundary layer is very thick. Outside the boundary layer is the free stream region where viscous effects are no long important so that the ideal-flow solutions is applicable.At a moderate Reynolds number, e.g. Re = 10 (Figure 8-6b), the region in which the viscous effects are important becomes much smaller. The boundary layer is much thinner. The streamlines over the plate only deflected somewhat.At a large Reynolds number, e.g. Re = 107 (Figure 8-6c), the flow is dominated by inertial force. The viscous effects are negligible anywhere except in a thin boundary layer close to the surface of the plate and the wake region. As the boundary layer is very thin, the flow streamlines are largely unaffected except slightly deflected near and within the boundary layer.Figure 8-6 Patterns of flow over a thin plate [1] at (a) a low Reynolds number; (b) a moderate Reynolds number and (c) a large Reynolds numberFigure 8-7 Patterns of flows over a circular cylinder [1] at (a) a low Reynolds number; (b) a moderate Reynolds number and (c) a large Reynolds number2). Flow over a circular cylinder (Figure 8-7) [1]At a low Reynolds number, e.g. Re = 0.1 (Figure 8-7a), flow past a cylinder is dominated by the viscous force. The viscous effects influence a large portion of the flow field, stretching to several diameters in any direction of the cylinder. However, the flow can still coast along the surface of the cylinder slowly. Such flow is sometime called creeping flow, which has streamlines essentially symmetric about the centre of the cylinder.At a moderate Reynolds number, e.g. Re = 50 (Figure 8-7b), the inertial force becomes more important. The region ahead of the cylinder in which the viscous effects are important becomes much smaller. The viscous effects are convected downstream and the flow loses its symmetry. The flow inertia dominates so that it does not coast along the surface down to the rear of the body, resulting in the formation of flow separation bubbles behind the cylinder.At a large Reynolds number, e.g. Re = 105 (Figure 8-6c), the flow is dominated by the inertialforce. The region affected by the viscous forces is forced further downstream, leading to theformation of a very thin boundary layer on the front portion of the cylinder. The boundary lay can be laminar or turbulent, depending on Reynolds number. Due to the strong inertia force, the boundary layer separation occurs from the cylinder, leading to the formation of a turbulent wake region extending far downstream. In the free stream region outside the boundary layer and the wake region, the velocity gradient is zero and the fluid flows as if it were inviscid.8.4 Drag force and streamlined bodies8.4.1 Drag forceIn 1710, Isaac Newton (cited in [2]) dropped hollow spheres from the inside of the dome of St Paul’s Cathedral in London and measured their rate of fall. He calculated that the drag force F D on a sphere and concluded that the following equation holds 242222V D V A F D ρπρ== where A is called projected (or frontal) area – the projected area seen by a person lookingtoward the object from a direction parallel to the upstream (see Figure 8-8).Figure 8-8 Drag force on a free-fall sphereIn other words, Isaac Newton thought that 122=V A F D ρ. However, subsequent experimental investigations by many other researchers found that the above formula must be modified by a coefficient C D in the right-hand side, i.e. D D C V A F =22ρ This is essentially same as the definition of drag coefficient C D in E8-3. Normally, drag coefficient C D is not 1. We can calculate the drag force of the flow on an immersed body as (E8-5)Therefore, when calculate drag force using E8-5, we have accumulated the effects of all rest factors into a single coefficient, C D , i.e. drag coefficient. One can see that the drag coefficient C D in E8-5 plays a similar role of the friction factor f in E6-22. The key difference between E8-5 and E6-22 is that in the case of pipe flow, the geometry of pipes (with different length and diameter) varies while all spheres have the same shape.8.4.2 Drag coefficient chartAccording to E8-1 and the discussion in Section 8-2, the drag coefficient of an object will be a function of Reynolds number, the shape and the surface properties of the object. We haverties)face_prope ,shape,sur Φ(C D Re = (E8-6)Practically, finding the exact function of E8-6 is extremely difficult, if not impossible. Therefore, for engineering applications, what we need is a drag coefficient chart, similar to Moody chart used for determining friction factor in pipe flows. Figure 8-9 shows the dragcoefficient as a function of Reynolds number for a smooth sphere and a smooth cylinder.Figure 8-9 Drag coefficient of a smooth sphere and a smooth circular cylinder [1].EX8-1: An exampleWe caught two breams in two consecutive casts. If we pulled the strings at the same speed, explain why we felt it was much harder to pull the big bream?Solutions:Figure 8-10The projected area of the big bream, A bf , is a much bigger than that of the small bream A sf . As both fishes are bream, we can reasonable assume that the two fishes have similar shape and surface characteristics. As both fishes were caught in consecutive casts in the same water area and we pulled the string at the same speed V , the water flows over the two fishes have same Reynolds numbers. Therefore, the drag coefficients can be taken as same. According to E8-5, the water would have induced much higher drag force on the big bream when we pulled the string.8.4.3 Pressure dragEquation E8-1 in Section 8.2 clearly shows that the drag consists of two components, friction drag and pressure drag. For flow over an immersed circular cylinder, as shown in Figure 8-7c, the fluid friction within the boundary layer certainly leads to the friction drag. In this section, let’s have a detailed analysis on the cause of pressure drag.Let’s start with inviscid flows, as shown in Figure 8-11. In absence of viscosity, the flow will coast along the cylinder surface and the streamlines are symmetrical. Based on theoretical hydrodynamics (further details can be found in Chapter 6 of Reference [1]), the distribution of pressure and velocity along the surface of the cylinder are )sin 41(21220θρ−+=V P P (E8-7) θsin 2V V fs = (E8-8) which are plotted in Figures 8-11b and 8-11c.Figure 8-11c indicates that for an ideal fluid (0=μ and ρ is constant), the fluid velocity along the surface varies from 0=fs V at the very front and rear (stagnation point A and F) of the cylinder to the maximum of V V fs 2= at the bop (point C) and bottom of the cylinder.Figure 8-11 Ideal flow over a circular cylinder [1] (a) streamlines for the ideal flow; (b) pressure distribution of the ideal flow; (c) fluid velocity distribution on the cylinder surfaceFigure 8-12 Real flow over a circular cylinder [1] (a) boundary layer separation; (b)distribution of pressure coefficient.Similarly, as shown in Figure 8-11b, the pressure distribution is also symmetrical about thevertical midplane of the cylinder, varying from a minimum of 2023V P ρ−at the top orbottom of the cylinder to a maximum of 2021V P ρ+. The decrease in pressure in thedirection of flow along the front half of the cylinder is termed as favourable pressure gradientwhile the increase in pressure in the direction of flow along the rear half of the cylinder istermed adverse pressure gradient . In absence of viscous effects, the fluid travelling from thefront to the back of the cylinder coasts down the “pressure hill” (see Figure 8-5b) from°=0θat point A to °=90θat point C and then back up to the hill to °=180θ(from point C topoint F ). Therefore, there is only energy exchange between kinetic energy and pressureenergy without any energy loss.However, the experimental observations are very different from the above theoreticalanalysis, as shown in Figure 8-12. At a large Reynolds number, the flow forms the boundarylayer on the surface of the cylinder and cannot coast along the cylinder surface down to therear stagnation point F. The boundary layer separation occurs at point D on the rear surface, (a)(b)leading to the formation of turbulent wakes in the downstream (see Figure 8-12a). The separation of the boundary layer can be explained by the pressure distribution in Figure 12b. Due to the friction between the viscous fluid and the cylinder surface, energy loss is inevitable so that after pass through point C, the fluid does not have enough kinetic energy to climb the pressure hill up to point F which sits on the top of pressure hill therefore the boundary layer separates at point D in Figure 12a.Figure 8-12b also indicates that the location of separation therefore the width of the turbulent wake and the pressure distribution on the surface depend on the nature of the boundary layer. Compared with a laminar boundary layer, a turbulent boundary layer has more kinetic energy and momentum so that it can flow further around the cylinder, resulting in a narrower wake, less drag, corresponding to a decrease in drag coefficient from point D to E in Figure 8-10. Because of the boundary layer separation, the average pressure on the front half of the cylinder is significantly greater than that on the rear half. This leads to the development of a large pressure drag. Under turbulent conditions, the friction drag is insignificant compared with the pressure drag, as discussed blow.Figure 8-13 Two objects of significant different size that have the same drag force [1]: (a) a circular cylinder - a blunt body, C D = 1.2; (b) a streamlined strut C D = 0.12.Table 8-1 Drag coefficients of various bodies8.4.4 Streamlined bodiesIt is clear now that the drag force developed on an object immersed in turbulent fluid isdominantly pressure drag as a result of boundary layer separation. Therefore, we can optimisethe body shape of the object to minimise the boundary layer separation hence reduce pressuredrag. This requires us to design streamlined bodies .Figure 8-13 shows the significance of body streamlining. The streamlined strut has a sizemuch bigger than the circular cylinder. However, the two bodies have the same drag forces.The boundary layer separation on the streamlined strut has been postponed to the tail of thebody so that pressure drag is minimised compared with that on a circular cylinder, which is ablunt body. It is interesting to revisit the shapes of submarine, fish and aerofoil in Figures 8-1and 8-2, we would appreciate that these bodies are actually all streamlined.8.4.5 Drag coefficient for various objectsThe drag coefficient information for a wide range of objects is available in the literature [1,2].Some of this information is listed in Table 8-1.8.4.6 Drag coefficient at low Reynolds number (Re < 1)At Re < 1, the flow over an immersed body is called creeping flow , dominated by viscouseffects. The drag coefficient gives the 1/Re dependence. Table 8-2 shows the drag coefficientsfor various bodies at Re < 1.Table 8-2 Drag coefficient of various bodies at Re < 1, from Reference [1]8.6 Terminal velocityIf an object in a body of fluid is free to move subject only to gravity, or perhaps centrifugalforces in certain circumstances, then it accelerates to a particular velocity at which the tractiondeveloped and the other forces on the body balance. This velocity is called terminal velocity .Generally, the acceleration is very rapid so that the whole process can be treated as the objecttravelling at the terminal velocity.Figure 8-14a illustrates the concept of terminal velocity of a sphere settling in a fluid. Figure8-14b shows the force analysis of the sphere. When the sphere travels at the terminal velocityV t , the force is balanced. V V V V Re4.20Re6.13Re0.24Re2.22Therefore, as shown in Figure 8-14b, the gravity force F W , drag force F D and buoyancy forceF B are in balance,B D W F F F += (E8-9)We know thatobject object W gV F ρ= (E8-10)object fluid B gV F ρ= (E8-11) projected t fluid D D A V C F 22ρ= (E8-12) where6)2(3433D D V object ππ== (E8-13)42D A projected π=. (E8-14)Assuming Re < 1, for a sphere (see Table 8-2), the drag coefficient is DV C t fluid fluid D ρμ24Re 24==. (E8-15)Substituting E8-15 into E8-12, we have t fluid t fluid t fluid fluid projected t fluid D D DV D V D V A V C F πμπρρμρ342242222===. (E8-16)This is the famous Stock’s law, which is only valid when Re < 1.(a) Concept of terminal velocity (b) Force analysisFigure 8-14 Terminal velocity of a sphereSubstituting E8-11, E8-13 and E8-16 into E8-9, we have fluidfluid object t gD V μρρ18)(2−= (E8-17)Equation E8-17 is not generally given for calculations so that if not available we are requiredto go through the force analysis for its derivation.Once we have calculated the terminal velocity, one final critical step is to double check Re toensure that 0.1Re <=fluid t fluid D V μρ (E8-18)so that our assumption leading to E8-16 is indeed valid.Solutions:We can use a free-body diagram of a mineral particle, as shown in Figure 8-14b. The mineralparticle moves downward with a constant velocity V t (relative to the moving air flow)that isgoverned by a balance between weight of particle, F W , the buoyancy force of the surroundingair, F B , and the drag of air on the particle, F D . Please Note: it is acceptable that thebuoyancy force of the surrounding air, F B , is neglected.(a) We haveB D W F F F += (E8-19)63p p p p W D g gV F πρρ== (E8-20) 63p air p air B D g gV F πρρ== (E8-21)Assuming Re <1, we have the drag coefficient of an mineral particle pt air air D D V C ρμ24Re 24== (E8-22) Therefore the drag force p t air pt air air p t air D p t air D D V D V D V C D V F πμρμπρπρ3244214212222=== (E8-23) Substitute E8-20, E8-21 and E8-23 into E8-19, we have p air p air p p UD D g D g πμπρπρ36633+= Therefore, the terminal velocity of a mineral particle relative to the flowing air is air p air p t gD V μρρ18)(2−= or airp p t gD V μρ182= if buoyancy is neglected,Therefore, we haves m m Ns m s m m kg m kg gD V air p air p t /029.0)/1079.1(18)1020(/8.9)/29.1/2400(18)(25262332=×××××−=−=−−μρρCheck Reynolds number 0.10418.0/1079.11020/029.0/29.1Re 2563<<=××××==−−m Ns m s m m kg D V air p t air μρ Therefore, the assumption to use E8-22 is valid.(b) We can calculate the air travelling velocity in the vertical tube s m m s L m L D Q A Q V tube air /017.0)05.0(14.3)60min 110001min 0.2(44232=××××===π Therefore, the residence time of a mineral particle in the vertical tube is 3.16/)017.0029.0(75.0=+=+=sm m V V L t air t sReferences[1]. Munson BR, Young DF and Okiishi TH, Fundamentals of Fluid Mechanics, 4th Edition,John Wiley & Sons, Brisbane, 2002.[2]. Noel de Nevers, Fluid Mechanics for Chemical Engineers, 3rd Edition, McGraw-Hill’sChemical Engineering Series, Sydney 2005.。


工程流体力学讲稿华中科技大学土木工程与力学学院力学系陈应华E-mail第一章绪论§流体与流体力学1.流体的定义:定义:凡不能象固体一样保持其一定形状,并容易流动的物质称为流体。
流体包括液体和气体。
液体的特点:①.液体有一定的容积。
②.在容器中的液体可形成一定的自由表面。
③.液体不容易压缩。
④.没有一定的形状,容易流动。
气体的特点:①.气体没有一定的容积。
②.在容器中的气体不存在自由表面。
③.气体极易压缩。
④.没有一定的形状,容易流动。
液体与气体的共同特点:没有一定的形状,容易流动。
容易流动:流体在任何微小的剪力或拉力的作用下,它们都会发生连续变形(即流动)。
2.流体力学的发展简史:古典流体力学+ 实验水力学→(现代)流体力学(现代)流体力学:理论流体力学工程流体力学(水力学)空气动力学计算流体力学环境流体力学多相流流体力学等等3.流体力学的研究方法:流体力学是研究流体平衡和机械运动的力学规律及其工程应用的一门力学学科。
流体力学的研究方法主要有:理论分析、实验研究和数值计算等。
§连续介质模型流体质点:微观上充分大,宏观上充分小的流体分子团。
比如1cm3的标态水(1atm,20˚C水温)中约含有×1022个水分子。
10-12cm3的标态水中约含有×1010个水分子。
连续介质模型:认为流体是由无任何空隙的流体质点所组成的连续体。
流体的密度、温度等物理量连续分布。
连续介质模型是欧拉在1753年提出的假说。
有了这个模型,我们就可以采用连续函数这一强有力的数学工具来分析流体的流动规律。
连续介质模型的适用范围:常温常压下的气体和液体。
§ 流体的密度及粘性一.流体的密度:1.密度的定义:流体具有维持它原有运动状态的特性,这种特性称为惯性。
表征惯性的物理量是质量。
质量愈大,则惯性愈大。
流体的密度(ρ): VM ρV V ∆∆=∆→∆'lim ΔV ′可理解为:微观上足够大,宏观上足够小的流体体积。