使用model builder创建工具
- 格式:doc
- 大小:408.50 KB
- 文档页数:14

java中用builder模式实现实体类的创建在Java中,Builder模式是一种创建对象的设计模式,它通过将对象的构造和属性设置分离,以简化对象的创建过程。
该模式适用于需要创建具有多个可选属性的复杂对象。
在实体类中使用Builder模式可以提供更好的可读性和可维护性,同时也能保持类的不可变性。
以下是在Java中使用Builder模式创建实体类的步骤:1. 创建一个实体类,该类应该具有一些必需的属性和一些可选的属性。
所有属性都应该被声明为私有的,并且没有公共的setter方法。
```javapublic class Entityprivate final String requiredProperty;private final int optionalProperty1;private final String optionalProperty2;private Entity(Builder builder)this.requiredProperty = builder.requiredProperty;this.optionalProperty1 = builder.optionalProperty1;this.optionalProperty2 = builder.optionalProperty2;}// Getter方法//...```2. 在实体类中创建一个静态内部类Builder,该类具有与实体类相同的属性,并且具有一个公共的构造函数。
```javapublic class Entity//...public static class Builderprivate final String requiredProperty;private int optionalProperty1;private String optionalProperty2;public Builder(String requiredProperty)this.requiredProperty = requiredProperty;}// Setter方法//...public Entity builreturn new Entity(this);}```3. 在Builder类中为可选属性添加setter方法,并且每个setter方法都应该返回Builder对象本身,以便可以进行链式调用。
模型构建器教程教程:使用模型构建器创建工具此教程将引导您逐步完成模型工具的创建过程。
在此教程中,通过将模型变量显示为模型参数,从而使在模型构建器中执行工具的教程中构建的模型成为有用的工具。
有关创建模型工具的综合概述,请参阅使用模型构建器创建工具快速浏览。
假定您在开始此教程前已安装了 ArcGIS Desktop(ArcView、ArcEditor 或ArcInfo)。
此教程所需的数据包含在 ArcGIS Desktop CD 中,且默认安装在C:\\arcgis\\ArcTutor 目录下。
教程情景是虚构的,原始数据已针对教程进行了调整。
为了避免损坏原始数据,请将 ModelBuilder 文件夹从 C:\\arcgis\\ArcTutor 目录下复制到计算机的 C 盘。
如果将数据复制到其他驱动器或位置,请确保在执行以下所有步骤时均使用相应的驱动器。
步骤:1. 打开地图文档。
2. 创建模型。
3. 显示工具参数。
4. 创建模型参数。
5. 对模型元素重命名。
6. 设置模型参数顺序。
7. 设置模型参数类型。
8. 对模型参数设置过滤器。
9. 为输出数据设置符号系统。
10. 管理中间数据。
11. 更改模型的常规属性。
12. 记录模型。
1 - 打开地图文档在 Windows 资源管理器中浏览到 C:\\ModelBuilder 文件夹,然后双击 Extract Vegetation.mxd。
此操作将启动 ArcMap 并打开该地图文档;另外,也可以执行下列操作步骤:1. 单击开始 > 所有程序 > ArcGIS > ArcMap 10 启动 ArcMap。
2. 在 ArcMap - 启动对话框中,单击现有地图 > 浏览更多。
将出现打开 ArcMap 文档对话框。
3. 浏览到 C:\\ModelBuilder 文件夹,选中 Extract Vegetation.mxd,然后单击打开。

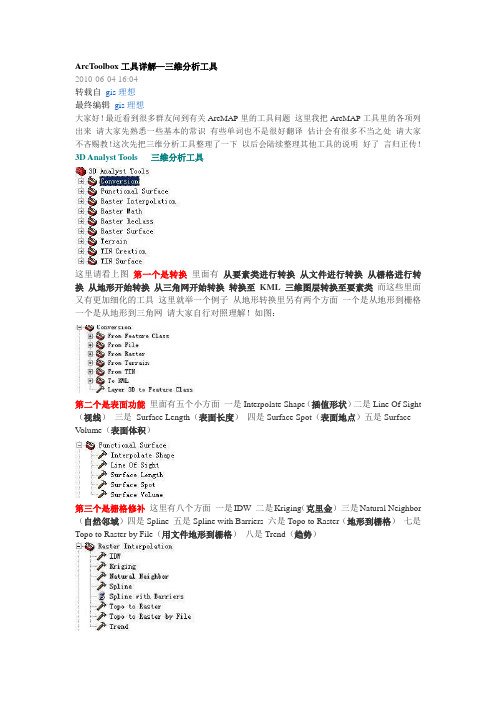
ArcToolbox工具详解—三维分析工具2010-06-04 16:04转载自gis理想最终编辑gis理想大家好!最近看到很多群友问到有关ArcMAP里的工具问题这里我把ArcMAP工具里的各项列出来请大家先熟悉一些基本的常识有些单词也不是很好翻译估计会有很多不当之处请大家不吝赐教!这次先把三维分析工具整理了一下以后会陆续整理其他工具的说明好了言归正传!3D Analyst Tools 三维分析工具这里请看上图第一个是转换里面有从要素类进行转换从文件进行转换从栅格进行转换从地形开始转换从三角网开始转换转换至KML三维图层转换至要素类而这些里面又有更加细化的工具这里就举一个例子从地形转换里另有两个方面一个是从地形到栅格一个是从地形到三角网请大家自行对照理解!如图:第二个是表面功能里面有五个小方面一是Interpolate Shape(插值形状)二是Line Of Sight (视线)三是Surface Length(表面长度)四是Surface Spot(表面地点)五是SurfaceV olume(表面体积)第三个是栅格修补这里有八个方面一是IDW 二是Kriging(克里金)三是Natural Neighbor (自然邻域)四是Spline 五是Spline with Barriers 六是Topo to Raster(地形到栅格)七是Topo to Raster by File(用文件地形到栅格)八是Trend(趋势)第四个是栅格计算这个很好理解一是除二是浮点三是取整四是减五是加六是乘第五是栅格重分类一是查找二是用ASCII文件重分类三是用表重分类四是重分类五是切片第六是栅格表面一是坡向二是等高线三是等高线列表四是带路障的等高线五是曲率六是填挖七是山影八是观察点九是坡度十是视域第七是地形一是增加要素类到地形二是增加地形点三是增加地形金字塔四是建立地形五是改变地形参考比例六是创建地形七是从地形中移去要素类八是移去地形点九是移去地形金字塔第八是TIN的创建一是创建TIN二是划定TIN数据区域三是编辑TIN第九是TIN的表面一是消除节点二是从中挑出三是多边形插值成多个面四是TIN坡向五是TIN轮廓六是TIN差异七是TIN表面体积八是TIN坡度第三章 Model Builder第一节 Model基础前面讲了很多的地里处理的概念,涉及好几个地里处理运行方式。


FormBuilder是一个Angular的库,用于简化在Angular应用中构建表单的过程。
使用FormBuilder可以更加轻松地创建和管理表单控件,并且提供了一些便利的方法来处理表单数据。
下面是FormBuilder的基本用法:1. 导入FormBuilder和FormGroup:```typescriptimport { FormBuilder, FormGroup } from '@angular/forms';```2. 在组件中注入FormBuilder:```typescriptconstructor(private formBuilder: FormBuilder) { }```3. 使用FormBuilder创建表单:```typescript// 在组件初始化时使用FormBuilder创建一个FormGroupmyForm: FormGroup = this.formBuilder.group({// 在这里定义表单控件username: '',password: ''});```4. 在模板中使用FormGroup和FormControl:```html<form [formGroup]="myForm" (ngSubmit)="onSubmit()"> <label>Username:<input type="text" formControlName="username"></label><label>Password:<input type="password" formControlName="password"> </label><button type="submit">Submit</button></form>```5. 处理表单数据:```typescriptonSubmit() {// 处理表单提交逻辑const formData = this.myForm.value;// 使用formData进行后续操作}```通过以上步骤,你可以使用FormBuilder来创建Angular表单,并在组件中轻松地进行表单控件的管理和表单数据的处理。
基于Arcgis Model Builder构建图斑净面积计算模型地类图斑的净面积是土地利用规划数据处理的基础,也是规划文本和说明中引用数据的基础和重要来源。
尽管净面积计算的公式简单,但在实际的计算过程中各种计算的方法和使用的工具存在差异。
本文针对土地利用总体规划中地类图斑面积的计算方法,结合土地年度变更调查数据,通过ARCGIS10中建模的新功能,构建图斑地类面积计算模型,并以广东省某县为例,进行面积计算和核查。
标签:ArcGIS10 建模地类图斑净面积0引言土地利用年度变更调查是全国定时开展的专项调查,是覆盖全国最新土地利用现状信息和土地权属的调查成果。
目前土地变更调查已广泛用地土地利用现状数据的统计、违法用地普查、土地利用动态监测、耕地保护和用地报建记录等相关工作,随着全国地理信息系统的应用,土地年度变更调查已成为国土资源管理土地利用的数据基础。
图斑净面积也称为图斑地类面积(数据库面积统称),数据库中对应的字段为DLMJ,地类面积主要涉及到基本农田保护、规划数据库中期末地类图斑面积统计、变更数据图斑等土地利用规划数据的面积统计,是土地管理部门、规划编制单位进行土地利用数据统计、分析面积的重要依据。
根据学者王昀昀《一种计算图斑净面积的新方法》[1]和学者刘洪江《基于ArcGIS实现地类图斑净面积的计算》[2]的研究,两者从不同的角度和理论设计了计算图斑净面积的方法,为后续的研究提供了很好的借鉴,由于计算的目标和方法不一致,以及新的计算辅助工具的产生,使得计算图斑净面积愈便捷和易于掌握。
为此本文基于广东省土地利用年度变更调查数据,通过ArcGIS10.0的中新增的建模功能(Model Builder),构建图斑地类面积计算模型,并通过实验数据,对计算结果进行对比分析。
1研究背景1.1 Arcgis10 Model BuilderModel Builder(模型构建器)[3]是一个用来创建、编辑和管理空间分析模型的应用程序,是一种可视化的编辑环境,通过对现有工具的组合完成新的模型或软件制作工具,Arcgis10 Model Builder的出现,为过去需要通过繁琐的操作计算图斑净面积提供了条件,通过Model Builder整合一系列的工具计算图斑净面积能有效提高工作效率和计算的精度。
arcgis批量归一化处理在使用ArcGIS进行大量数据处理时,归一化处理是必不可少的一个步骤。
归一化可以将数据从不同的范围映射到同一范围内,避免不同数据之间的量纲差异带来的误差,同时也可以提高模型的准确性和稳定性。
在ArcGIS中,进行批量归一化处理可以通过ModelBuilder或Python脚本实现。
其中,ModelBuilder是一种可视化的建模工具,可以通过简单的拖拽和连接操作构建模型,实现批量处理。
而Python 脚本则是一种编程语言,可以通过编写脚本自动化处理过程。
具体的批量归一化处理流程如下:1. 打开ArcGIS软件,创建一个新的ModelBuilder模型或编写Python脚本。
2. 确定需要进行归一化处理的数据集,例如一组地图数据的高程值。
3. 在ModelBuilder中,选择“Tools”面板中的“Data Management Tools”->“Fields”->“Normalize Field(s)”工具,将其拖入模型编辑区域中。
4. 在工具的参数设置中,选择需要进行归一化处理的数据集和字段,设置输出的归一化字段名称和范围值等参数。
5. 在模型编辑区域中,连接输入数据和归一化处理工具,设置输出数据的路径和名称。
6. 运行模型,即可批量进行归一化处理。
在Python脚本中,实现批量归一化处理的代码如下:import arcpy# 设置工作空间和数据集路径arcpy.env.workspace = 'C:/data'dataset = 'elevation.shp'# 获取数据集中的所有字段名fields = arcpy.ListFields(dataset)# 定义归一化范围max_value = 1000min_value = 0# 遍历所有字段,进行归一化处理for field in fields:if field.type in ['Double', 'Integer']:# 计算归一化系数factor = (max_value - min_value) / (field.maximum - field.minimum)# 更新字段值with arcpy.da.UpdateCursor(dataset, ) as cursor:for row in cursor:row[0] = (row[0] - field.minimum) * factor + min_value cursor.updateRow(row)print('Normalization has been completed.')通过以上代码,可以实现对指定数据集中所有数值型字段的批量归一化处理。
ModelBuilder - Executing Tools TutorialTable of ContentsTutorial: Executing tools in ModelBuilder . . . . . . . . . . . . . . . . . . . . . . . . . 3Tutorial: Executing tools in ModelBuilderThis tutorial takes you step-by-step through creating a model and executing tools in ModelBuilder. You start by adding a tool to ModelBuilder and supplying values for the tool's parameters. This constructs a process. A model is built by connecting processes.This tutorial builds a very simple model that identifies the vegetation typesnear proposed roads. In the model, the roads are first buffered using valuesfrom a distance field in the roads attribute table. The output from the Buffer tool is used to clip the vegetation data to create a dataset of vegetation types within the buffer polygons.The tutorial is composed of six broad steps:Steps:1.Copy tutorial data2.Open the map document3.Create a new model4.Add tools and data to the model5.Fill in the tool parameters6.Run the model7.Save the model1—Copying tutorial dataIt is assumed that you have installed ArcGIS Desktop (ArcView, ArcEditor, or ArcInfo) before you begin this tutorial. The data required for this tutorial (included on the ArcGIS Desktop CD) by default is installed in C:\arcgis\ArcTutor . The tutorial scenario is fictitious, and the original data has been adapted for the tutorial.Steps:1.To avoid corrupting the original data, copy the ModelBuilder folder fromC:\arcgis\ArcTutor to the C drive on your computer. If you are copying the data to anotherdrive or location, make sure to use that location for all the steps below.2—Opening the map documentBrowse to the C:\ModelBuilder folder in Windows Explorer and double click the Extract Vegetation.mxd.This will start ArcMap and open the map document, orSteps:1.Start ArcMap by clicking Start >All Programs >ArcGIS >ArcMap 10.2.On the ArcMap - Getting Started dialog box, click Existing Maps >Browse for more.The Open ArcMap Document dialog box appears.Complexity:BeginnerData Requirement:ArcGIS Tutorial Data Setup Goal:Learn how to execute tools inModelBuilder.3.Browse to C:\ModelBuilder folder, select Extract Vegetation.mxd, and click Open.This opens the Extract Vegetation.mxd.3—Creating a new modelSteps:1.Click the ModelBuilder button on the ArcMap Standard toolbar.This opens the ModelBuilder window for editing.You can also create a new model by right-clicking an existing toolbox and choosing New>Model. This creates a model in the toolbox with a default name and opens the model forediting.4—Adding tools and data to a modelNow that the model is open for editing, you will add two tools using the Search window: Steps:1.In ArcMap, click Geoprocessing>Search For Tools.This opens a Search window that you can dock anywhere in ArcMap.2.On the Search window, type Buffer, then click the Search button.The Buffer tool is listed along with other search items.3.Drag the search item Buffer (Analysis)(which represents the Buffer tool found in the Analysistoolbox) onto the ModelBuilder canvas in the white space.This adds the tool and the output data variable to the model. The output variable is connected to the tool by a connector. Both the tool and output data are empty (without color) as none of the tool parameters have been supplied.4.Search for and add the Clip tool in the Analysis toolbox in a similar manner. If the two toolsoverlap, click the Auto Layout button on the ModelBuilder toolbar to arrange the tools.There are two other methods to add tools in a model that are not used in this tutorial, but have been listed to introduce you to them:•In the Catalog window, navigate to Toolboxes>System Toolboxes>Analysis Tools >Proximity. You can select Buffer and drag the tool onto the ModelBuilder canvas inthe white space.•On the ModelBuilder Standard toolbar you can click the Add Data or Tool button, and navigate to Toolboxes>System Toolboxes>Analysis Tools>Proximity.Select the Buffer tool and click Add.5—Filling in tool parametersNow that the tools are added to the model, you will fill in the tool parameters.Steps:1.In ModelBuilder, double-click the Buffer tool to open its tool dialog box.2.For the Input Features parameter, click the browse button and navigate to the inputgeodatabase (C:\ModelBuilder\ToolData\Input.gdb).3.Choose the PlanA_Roads feature class and click Add.4.Once you fill in the input features, the Output Feature Class parameter is automaticallygenerated and filled in for you. Replace this autogenerated output name by clicking theBrowse button for the Output Feature Class parameter. Navigate to the output geodatabasein the ModelBuilder folder(C:\ModelBuilder\Scratch\Output.gdb), type BufferedFCfor the output name, then click Save.5.For the Distance parameter, choose the Field option and choose the Distance field from thedrop-down list.6.Click OK. (You don't need to fill in any other parameters.)The input data is added as a variable to the model (the blue oval in the above illustration) andis automatically connected to the Buffer. The input variable (the blue oval), the tool (the yellowrectangle), and the output variable (the green oval) change colors to indicate that all parametervalues have been supplied and the tool is ready to run. Note that clicking OK on the tool dialogbox does not execute the tool in ModelBuilder.When data or tools are added to a model, they are referred to as model elements. There arethree basic types of elements: variables (such as datasets), tools, and connectors.7.Now double-click Clip to open its tool dialog box.8.For the Input Features parameter, click the Browse button and navigate to the inputgeodatabase (C:\ModelBuilder\ToolData\Input.gdb).9.Choose the vegtype feature class and click Add.10.For the Clip Feature parameter, click the arrow and choose BufferedFC from the drop downlist. The blue recycle symbol means that BufferedFC is a variable in the model. Thisvariable was created in the model when you added the Buffer tool.11.Click the browse button for the Output Feature Class parameter, navigate to the outputgeodatabase(C:\ModelBuilder\Scratch\Output.gdb), type ClippedFC for thedataset name, then click Save.12.Click OK on the Clip tool dialog box.The output variable of the Buffer tool is automatically connected (using a connector) as aninput to Clip, as illustrated below.6—Running the modelAfter all the parameters of the tools have been filled in, the model is ready to run.Steps:1.Before you run the model, select the ClippedFC variable, right-click, then click the Add ToDisplay option. Setting this option ensures that when the model is run from ModelBuilder, theoutput ClippedFC will be added to the display in ArcMap for quick viewing of the results.2.From the ModelBuilder menu, click Model>Run Entire Model.The model runs and the output is added to the display. After the model has finished running,both the tools (the yellow rectangles) and output variables (the green ovals) show a dropshadow around them indicating that these tools have been run.Running the model on different roadsTo run the model on different roads (such as PlanB or PlanC feature classes), you have two choices:1.Double-click Buffer and navigate to another feature class, or2.Drag the data from the Catalog window onto the ModelBuilder canvas to create a new datavariable, then connect this variable to Buffer. Follow the steps below to see how this works.Steps:1.On the ArcMap menu, select Geoprocessing>Geoprocessing Options.a.Ensure that the check box next to When connecting elements, display validparameters when more than one is available is checked.b.Click OK.2.Navigate to the input geodatabase in the Catalog window.3.Choose the PlanB_Roads feature class and drag it onto the ModelBuilder canvas.4.Click the Connect button, then do the following:a.Click the PlanB_Roads variable element.b.Click the Buffer tool element. A shortcut menu appears containing the choices ofavailable parameters for the tool.c.Choose the Input Features parameter from the list.This connects the PlanB_Roads variable to Buffer and automatically disconnects thePlanA_Roads variable that was previously connected to the tool. The model elements losetheir drop shadow, signifying that the model has not been run with the new variable youadded.5.Double-click Buffer and choose the correct distance field from the PlanB_Roads featureclass.6.Run the model with Model>Run Entire Model.The model runs and the output is added to the display. After the model has finished running,both the tools and output variables show a drop shadow around them indicating that thesetools have been run. The existing output ClippedFC layer (from the previous run withPlanA_Roads) in the ArcMap table of contents is updated with the results fromPlanB_Roads.7—Saving a modelSaving is the last step for this tutorial. You will use the saved model in the Creating tools with ModelBuilder tutorial.Steps:1.Click the Save tool on the ModelBuilder toolbar and navigate to C:\ModelBuilder.2. A model can only be saved in a toolbox. Click the New Toolbox icon on the navigationwindow.A toolbox with a default name is added in the workspace.3.Change the name to MyTools.tbx.4.Select MyTools.tbx and click Save to save the model with the default name (Model). Additional analysisIf you want to do some analysis with the model, you can add the Summary Statistics tool to get a summary table of affected area by vegetation type within the buffer polygons around the proposed roads.Steps:e PlanA_Roads as input in the Buffer tool for this analysis.2.Find the Summary Statistics tool in the Search window.3.Drag the tool into the model.4.Double-click the Summary Statistics element to open the tool dialog box.5.For the Input Table parameter, click the arrow and choose ClippedFC with a blue recycle iconnext to it from the drop down list. This recycle icon means it is a variable in the model.6.For the Output Table parameter, browse to the output geodatabase(C:\ModelBuilder\Scratch\Output.gdb), type AffectedVegetation for the name,then click Save.7.For the Statistic Field(s)parameter, choose Shape_Area from the list.8.Click the cell next to Shape_Area under Statistic Type and choose SUM from the drop downlist.9.For the Case field parameter, choose VEG_TYPE from the list.The completed Summary Statistics dialog box is illustrated below.10.Click OK.11.Confirm that the Add to Display option is checked for ClippedFC by right clicking it.12.Right click and check the Add to Display option for the AffectedVegetation variable. This willadd the ouput to the display after the model runs.13.Run the model.The output ClippedFC and the AffectedVagetation table is added to display in the ArcMap table of contents.14.Open the table by right-clicking and clicking Open.The table shows a summary of area by vegetation type within the buffer polygons that will beaffected by the proposed roads for plan A.。
arcgis modelbuilder 例子-回复ArcGIS ModelBuilder 是一个强大的地理信息系统(GIS) 分析工具,通过自动化空间分析流程的创建,使得用户能够快速且高效地进行地理数据处理。
在本文中,我们将深入探讨ArcGIS ModelBuilder 的应用,并提供一系列步骤来帮助您了解如何使用它来构建自己的分析模型。
第一步:理解ArcGIS ModelBuilder 的基本概念与界面ArcGIS ModelBuilder 是ArcGIS 软件的一部分,它通过可视化方式构建和组织地理处理工具与数据流程。
使用ModelBuilder,您可以将多个地理处理工具连接起来,形成一个连续的处理流程。
在开始之前,让我们先了解一下ModelBuilder 的基本概念。
ModelBuilder 的界面主要分为三个部分:模型编辑窗口、工具箱和模型元素窗口。
模型编辑窗口提供了一个可视化的环境,用于创建和编辑处理模型。
工具箱包含了各种可用的地理处理工具,您可以从中选择并将其添加到模型编辑窗口中。
而模型元素窗口则显示了所有已添加到模型中的工具和数据元素。
第二步:构建一个简单的分析模型让我们以一个简单的分析任务为例,来演示如何使用ArcGIS ModelBuilder 创建一个分析模型。
我们将尝试创建一个模型,用于计算一片土地上的绿地覆盖率。
下面是模型的基本步骤:1. 打开ArcGIS 软件,点击"工具箱" 来打开工具箱窗口。
2. 在工具箱窗口中,找到"遥感工具" 并双击打开,然后选择"栅格计算器" 工具并将其拖放到模型编辑窗口中。
3. 在"栅格计算器" 工具的输入栏中,选择要进行绿地覆盖率计算的栅格图层。
4. 接下来,从工具箱中拖放"流域" 工具到模型编辑窗口中。
这个工具将用于确定各个流域内的土地类型。
使用模型构建器创建工具Resource Center复杂性:入门级数据要求:ArcGIS 教程数据安装程序目标: 了解如何创建模型工具。
此教程将引导您逐步完成模型工具的创建过程。
在此教程中,通过将模型变量显示为模型参数,从而使在模型构建器中执行工具的教程中构建的模型成为有用的工具。
有关创建模型工具的综合概述,请参阅使用模型构建器创建工具快速浏览。
假定您在开始此教程前已安装了ArcGIS Desktop(ArcView、ArcEditor 或ArcInfo)。
此教程所需的数据包含在ArcGIS Desktop CD 中,且默认安装在C:\arcgis\ArcTutor目录下。
教程情景是虚构的,原始数据已针对教程进行了调整。
为了避免损坏原始数据,请将ModelBuilder 文件夹从C:\arcgis\ArcTutor目录下复制到计算机的 C 盘。
如果将数据复制到其他驱动器或位置,请确保在执行以下所有步骤时均使用相应的驱动器。
步骤:1.打开地图文档。
2.创建模型。
3.显示工具参数。
4.创建模型参数。
5.对模型元素重命名。
6.设置模型参数顺序。
7.设置模型参数类型。
8.对模型参数设置过滤器。
9.为输出数据设置符号系统。
10.管理中间数据。
11.更改模型的常规属性。
12.记录模型。
1 - 打开地图文档在Windows 资源管理器中浏览到C:\ModelBuilder文件夹,然后双击ExtractVegetation.mxd。
此操作将启动ArcMap 并打开该地图文档;另外,也可以执行下列操作步骤:1.单击开始>所有程序> ArcGIS > ArcMap 10启动ArcMap。
2.在ArcMap - 启动对话框中,单击现有地图>浏览更多。
将出现打开ArcMap 文档对话框。
3.浏览到C:\ModelBuilder文件夹,选中Extract Vegetation.mxd,然后单击打开。
这样便可打开Extract Vegetation.mxd。
2 - 创建初始模型如果之前保存了该模型,则右键单击模型将其打开,然后选择编辑。
如果此模型是在“在模型构建器中执行工具的教程”中运行后才保存的,则模型要素周围可能会有下移阴影。
要移除下移阴影,可在“模型构建器”工具条上单击验证整个模型按钮来验证整个模型。
双击目录窗口中的示例模型。
将打开工具对话框,但不显示任何参数,如下图所示。
如果单击确定以运行此工具,则会运行该模型。
即使为输出变量选中了添加至显示,模型的输出(ClippedFC) 也不会添加到ArcMap 的内容列表中。
原因是通过模型的工具对话框运行模型时,将会忽略添加至显示设置。
要将输出添加至显示,必须将输出变量变为模型参数。
创建模型参数的另一个原因是,您希望以不同输入来运行该模型,而无需每次都打开“模型构建器”,如下图所示。
创建模型参数后,可通过模型的工具对话框执行模型,从而为Input Roads、Buffer Distance、Input Vegetation、Output Clipped Feature Class和XY Tolerance参数提供不同的值。
无需在每次运行模型时都打开“模型构建器”,也可以改用工具对话框。
通过模型的工具对话框来运行模型还有一个额外的优势,那就是会在结果窗口中创建结果,而在“模型构建器”内运行模型并不会在结果窗口中创建结果。
其余步骤会将模型变量显示为参数,以使其在模型工具对话框中如上所示。
3 - 显示工具参数要定义“缓冲距离”和“XY 容差”参数,需要为它们创建模型变量。
将工具添加到模型后,会自动为输入和输出数据集创建模型变量,但不会为任何其他工具参数创建模型变量。
主要是为了美观,如果自动为每个工具参数都创建变量,则模型图很快就会变得难以辨认。
例如,将缓冲区工具添加到模型后,会自动为输出要素类参数创建变量。
右键单击Buffer 并填充输入要素参数后,便会为输入要素创建模型变量。
所有其他参数(如距离、侧类型和末端类型)并不会作为变量自动添加到模型中。
以下步骤将为距离[值或字段]和XY 容差创建模型变量。
步骤:1.在目录窗口中,右键单击模型,然后单击编辑。
将在“模型构建器”中打开模型。
2.右键单击Buffer。
3.单击获取变量>从参数>距离[值或字段]。
此操作会将“距离”参数作为变量添加到模型中。
4.右键单击Clip。
5.单击获取变量>从参数> XY 容差。
4 - 创建模型参数您已为“距离”和“XY容差”创建了变量,接下来便可创建模型参数。
步骤:1.右键单击Distance [value or field],然后选中模型参数选项,如下图所示。
2.变量旁边将显示字母P,表示此变量为模型参数。
此模型参数随后也将在模型工具对话框上显示。
3.为以下变量创建模型参数(不为BufferedFC创建模型参数):∙PlanA_Roads∙vegetype∙XY 容差∙ClippedFC5 - 对模型元素重命名“模型构建器”为变量指定默认名称。
这些变量名用作模型工具对话框上的参数名称。
对变量重命名是一种很好的做法,尤其是在变量为模型参数时。
步骤:1.右键单击PlanA_Roads,然后单击重命名。
2.输入Input Roads,然后单击确定。
变量名称将更改为Input Roads。
3.按以下方法对其余变量进行重命名:∙将Distance [value or field]重命名为Buffer Distance。
∙将vegetype重命名为Input Vegetation。
∙将ClippedFC重命名为Output Clipped Feature Class。
4.保存模型。
无需退出“模型构建器”。
5.在目录窗口中双击模型可打开模型工具对话框。
可能需要移动或最小化“模型构建器”窗口才能访问目录窗口。
模型工具对话框应与下图类似。
您对话框上的参数顺序可能会有所不同,但这不是问题,因为接下来您将更改此顺序。
6.可通过单击确定来执行工具,但建议您在执行工具前先选择其他输出要素类。
该工具执行后,输出要素类将被添加到ArcMap 的内容列表中。
与在“模型构建器”内运行模型不同,通过模型对话框运行模型并不会改变模型图。
6 - 设置模型参数顺序如上图所示,参数的顺序并不理想。
标准做法是按以下顺序排列参数:∙必需的输入数据集∙影响工具执行的其他必需参数∙必需的输出数据集∙可选参数步骤:1.在“模型构建器”中,单击模型>模型属性。
2.单击参数选项卡。
3.选择Input Roads参数,然后使用右侧的上箭头和下箭头按钮将其移动到顶部。
4.如下所示更改其他参数的位置:7 - 设置模型参数类型按正确顺序设置模型参数后,需要更改参数类型。
如果参数是模型中某个工具的必需参数,将无法通过以下设置将类型更改为可选。
步骤:1.在“模型构建器”中,单击模型>模型属性。
2.单击参数选项卡。
3.单击XY Tolerance的类型类别下方的单元格。
将出现一个包含两个选项的列表。
在此示例中,保留XY Tolerance为可选参数,而将其余参数设置为必需参数,如下图所示。
8 - 对模型参数设置过滤器可通过对参数应用过滤器来限制任何参数的输入类型。
此示例中的模型要求Input Roads参数为线要素。
在以下步骤中,将通过应用过滤器来修改该参数,以使其仅接受线要素。
步骤:1.单击模型>模型属性。
2.单击参数选项卡。
3.选择Input Roads,然后单击过滤器类别下方的单元格。
4.选择要素类过滤器。
将打开要素类对话框。
5.取消选中除“折线(Polyline)”外的所有类型,然后单击确定。
6.在模型属性对话框上,单击确定应用过滤器。
9 - 为输出数据设置符号系统可将模型的输出设置为包含特定的符号系统,以用来显示输出。
对于此示例,符号系统基于缓冲区内的植被类型。
要为输出数据设置符号系统,第一步是创建图层文件,第二步是在输出数据属性中定义图层文件。
此教程中已创建了图层符号系统文件。
步骤:1.在“模型构建器”窗口中,右键单击Output Clipped Feature Class,然后单击属性。
2.单击图层符号系统选项卡。
3.浏览查找ToolData 文件夹(C:\ModelBuilder\ToolData) 中所复制的图层文件。
4.选择OutputSymbology.lyr,然后单击添加。
5.单击确定。
10 - 管理中间数据运行模型时,模型中执行的每个过程都会创建输出数据。
创建的某些数据在模型运行后毫无用处,因为创建这些数据只是为了与创建新输出的另一个过程相连。
此类数据称为中间数据。
除最终输出之外的所有输出或者已变为模型参数的输出都将自动成为模型的中间数据。
此示例中,Buffer工具的输出仅在作为Clip工具的输入时才有用,而在这之后不再使用,因此“中间”选项为选中状态。
可通过取消选中“中间”选项来保存中间数据。
11 - 更改模型的常规属性可对模型的名称、标注和描述进行设置。
步骤:1.在“模型构建器”界面上,单击模型>模型属性。
2.输入ExtractVegetationforProposedRoads作为模型名称。
模型名称中不允许包含空格。
3.在标注文本框中,输入Extract Vegetation for Proposed Roads。
模型标注中允许包含空格。
此标注用于在目录窗口中显示模型名称。
4.在描述文本框中,输入所需文本。
选中存储相对路径名(不是绝对路径名)选项,以便共享模型工具或将模型数据和模型移动到其他位置。
此教程中未使用此选项,但此处将其作为一种很好的做法进行介绍,便于您在以后共享模型和模型工具时使用。
了解有关相对路径选项的详细信息5.单击确定。
6.保存完成的模型,并退出“模型构建器”。
在目录窗口中双击模型可打开模型工具对话框。
由于模型是与预定义的值一起保存的,因此对话框中的所有参数都已填入。
可通过在此处输入新值来更改任何参数的值。
单击确定运行模型。
默认情况下,模型的最终输出(Output Clipped Feature Class) 会添加到显示中,而模型消息将在结果窗口中显示。
要查看结果,可在地图文档的内容列表中取消选中Vegetation Type 图层。
12 - 记录模型最好在分享模型前先对其进行记录。
要进行记录:步骤:1.右键单击目录窗口中的模型,然后单击项目描述。
将打开项目描述窗口,其中显示了描述页面。
2.在项目描述窗口中,单击编辑按钮。
将打开文档编辑器以供您输入项目描述。
3.为模型中的每一项输入相应的描述,然后单击保存按钮。
其他分析如果需要使用该模型执行某些分析,可以添加“汇总统计数据”工具以便获得一个在拟建道路周围缓冲区面中受到植被类型影响的区域的汇总表。