外文文献及翻译_Ultrasonic distance meter
- 格式:doc
- 大小:69.50 KB
- 文档页数:15
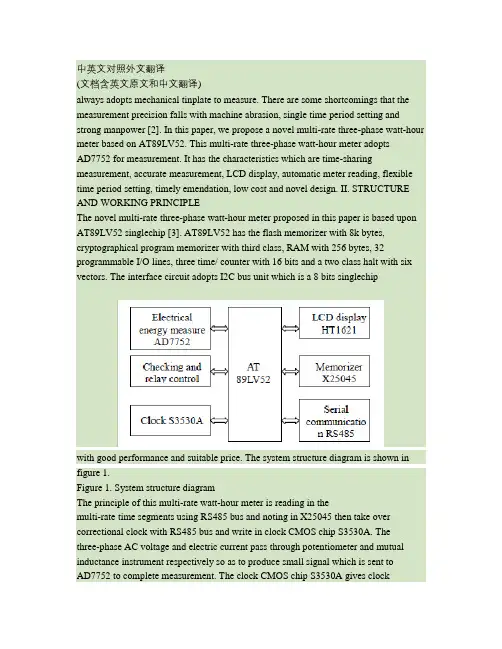
中英文对照外文翻译(文档含英文原文和中文翻译)always adopts mechanical tinplate to measure. There are some shortcomings that the measurement precision falls with machine abrasion, single time period setting and strong manpower [2]. In this paper, we propose a novel multi-rate three-phase watt-hour meter based on AT89LV52. This multi-rate three-phase watt-hour meter adoptsAD7752 for measurement. It has the characteristics which are time-sharing measurement, accurate measurement, LCD display, automatic meter reading, flexible time period setting, timely emendation, low cost and novel design. II. STRUCTURE AND WORKING PRINCIPLEThe novel multi-rate three-phase watt-hour meter proposed in this paper is based upon AT89LV52 singlechip [3]. AT89LV52 has the flash memorizer with 8k bytes, cryptographical program memorizer with third class, RAM with 256 bytes, 32 programmable I/O lines, three time/ counter with 16 bits and a two class halt with six vectors. The interface circuit adopts I2C bus unit which is a 8 bits singlechipwith good performance and suitable price. The system structure diagram is shown in figure 1.Figure 1. System structure diagramThe principle of this multi-rate watt-hour meter is reading in themulti-rate time segments using RS485 bus and noting in X25045 then take over correctional clock with RS485 bus and write in clock CMOS chip S3530A. Thethree-phase AC voltage and electric current pass through potentiometer and mutual inductance instrument respectively so as to produce small signal which is sent toAD7752 to complete measurement. The clock CMOS chip S3530A gives clockinformation per second in the course of automatic move and analyze this clock belongs to which period of time according to advance periods of time set in X25045 then save the electrical energy in RAM memorizeraccording to corresponding period of time. We write it to corresponding address ofX25045 when the electrical energy achieves one degree in order to make the multi-rate measurement come true. This watt-hour meter hasfunctions of clear LCD display, missing phase detection, burthen control, halt electricity check and storage, automatic meter reading and so on.III. THE DESIGH OF HARDWARE CIRCUITA. Electrical energy measurementThe three-phase electrical energy measurement is realized by the low consume CMOS chip AD7752 of ADI company. The inside of AD7752 adopts digital circuit besides ADC, filter and multiplication circuit which can eliminate noises effectively. The sampling course of voltage and electric current in three-phase AC power supply loop is shown in figure 2 in which IA stands for voltage sampling of A phase. The sampling circuits of B phase and C phase are similar to A phase. The power after integral is transformed to electrical pulse for output. The pulse of fan-out CF enters into interregnum INT0 of AT89LV52 through photoelectricity insulation 4N25. CPU measures the electrical energy [4]. We adjust the pulse number of CF by combining the state of S1 and S2. The connection of electrical energy and pulse is W = M C . In which, W is the electrical energy with the unit of kilowatt-hour, M is the total pulse number,C is the pulse number of ammeter. We choose C equals to 3000 that is to say every kilowatt-hour is 3000pulses.Figure 2. Circuit schematic diagramof watt-hour meterB. LCD displayThe LCD display [6] adopts HT1621 CMOS chip of HOLTEK Company toachieve twelve bits digital display. HT1621 is the LCD drivers with 128 segments (32×4) inner memorizer. The interior of HT1621 consists ofcontrol and time circuits, RAM, LCD drive and watch timer. It hasthe merits of small volume and low cost so that it is suit to watt-hour meter. We use serial interface which only has four lines between HT1621 and AT89LV52. The detailed connection is shown in figure 3. P20, P21, P22 and P23 of AT89LV52 connect to CS, RD, WR and DATA respectively with the use to refurbish the display of RAM. HT1621 drive CMOS chip has 48 nodes in which COM0, COM1, COM2, COM3 connect to the communal end and drive output of LCD and SG0, SG1, SG2, SG3 connect to drive output of every segment respectively. In addition, an adjustable resistance of 20kΩ is put between VDD and VLCD to adjust the display contrast of LCD. Experiment shows that the contrast is better with VDD=5V and VLCD=4V. C. Serial memorizerSerial memorizer adopts low power consumption chip X25045 of XICORcompany .It has three functions which are watchdog timer WTD, voltage supervision and serial memorizer E2PROM with 512 bytes. WTD can be set 200ms, 600ms and 1400ms time intervals. The software program is read into X25045. During the normal running of program, WTD receives the trigger signal in time intervals in order to ensure the normal running of program. X25045 will output a high potential through RESET line if WTD does not receive trigger signal in time intervals. The trigger watt-hour meter reset in order to prevent program flying away. As the serial memorizer chip, 512 bytes of X25045 are used to storage the watt-hour meter code, multi-rate periods of time, the apex electricity, smooth electricity, vale electricity and total electricity of last month and this month. Storage can be divided into two same areas. One is used as data storage. The other is used for backup. The number of storagecan be revised 100,000 times. Data can be stored for 100 years. It is connected withAT89LV52 by SPI agreement bus. The connection is shown in figure 3.D. Clock circuitThe clock circuit is completed by S3530A chip. It is a low powerconsumption clock chip that supports I2C Bus. It sets the clock and calendar according to the data received by CUP communicating with RS485. At the same time, it continues to walk time by its own oscillation. The crystaloscillator of 32.768 kHz is put between Xin and Xout of S3530A which is connected with CPU through latching. SDA foot and SCL foot connect to P1.6 and P1.7 ofAT89LV52 respectively. There are two interrupt alarming foots can be set as second output or minute output synchronizing pulse which supply interrupt signal toAT89LV52 with one second period. Single-chip system will readout the current time through I2C communication interface according to this signal and calculate the period of time that this moment belongs to so as to realize the electrical energy measurement in different periods of time [5]. This clock circuit has spare lithium battery. The powersupply VCC supply power in normal wiring and electrified for lithium battery of 3.6V. When there is power off, the system will automatically convert lithium battery to clock circuit for power supply. The clock will still running accurately even the power is off.Figure 3. Partial circuit figure of watt-hour meterE. RS485 CommunicationMAX485 chip can implement RS485 communication control ofmulti-rate watt-hour meter. MAX485 chip has RS485 communication protocol. It can take 128 hypogenous computers. Its transmission distance is greater than 1km and its transfer rate is up to 250kb per second. The watt-hour meter connects with the unit controller through the RS485 bus. Each unit has a cell controller can manage 128 multi-rate watt-hour meter. The cell controller connects to power management computer.Each watt-hour meter has one and only meter number with eight bits of hex. The electrician should write the user’s information and meter number and then import to the power management computer for initial installation so ad to complete the connection of user and management computer. Management computer sends setting of period of time and clock information with the manner of broadcast communication without address information. PC uploads information by the way of calling address. F. Lack Phase detection and relay controlIt can achieve relay control [7] with P27 of AT89LV52. P27 cancontrol relays using 4N25 photoelectricity isolator so as to complete powersupply and power control. Lack Phase detection gets the signal from fan-out of the relay and connects to 1 foot of photoelectricity isolator after passing a 75K resistance, the diode half-wave rectifier and capacitive filtering respectively. We detect the 4 foot of isolator to determine whether there is the lack of phase. If there is lack of phase, we detect again after 2 seconds overtime. We break off the power immediately if there is lack of power after the twice confirmation. In power protection circuit, it uses the INT1 interrupt foot of AT89LV52 to detect signal.When there is a sudden power off, INT1 jumps into a low voltage and the INT1 interrupt enters to the power protection program relying on the energy storage capacitor to save data. In the system, pulse output of AD7752, relay control port and the inputs of lack phase detection all use photoelectric isolator 4N25. It sends electrical signal by light coupling which can enhance the ability of anti-jamming. IV. THE DESIGN OF SOFTWAREA.The distribution of resourceThe software program includes main program, X25045 read and write program, RS485 serial communication program, interrupt serve program, timer handling program,HT1621 display control program, electrical energy measurement in different period of time and power down protection program, and system self-checking andanti-interference handling program. Interrupt resource distribution of system is: INT0 interrupt is used as AD7752 pulse measurement, INT1 as synchronization detecting, timer T0 as 100 ms timing, T1 as 1ms timing, and T2 as baud rate generator for serial communication program. RS485 asynchronous communication is set to receive interrupt and check information for sending.B. Module desighThe flow chart of main program is shown in figure 4. The watt-hourmeter should be able to initialize at each power up time. The initializing program includes setting working mode of timers, serial stomata and interrupts for AT89LV52,writing control word into X25045, S3530A and HT1621. This system sets three periods of time. The singlechip reads clock value from S3530A per second then analyze this clock belongs to which period of time according to advance periods of time set inX25045 then save the electrical energy in RAM memorizer according to corresponding period of time. We write it to corresponding address of X25045 when the electrical energy achieves one degree. The LCD display with 16 bits shows period of time and electrical energy information in turn. Figure 4. Flow chart of main program V. TESTING RESULTError measurement and running test have been made in Zibo Billion Electron Co., Ltd. The epigenous computer completes the setting of time management. There arethree-rate period of time. The first period of time is vale electricity from 00 point 00 minute to 06 point 30 minutes. The second period of time is apex electricity from 06 point 30 minutes to 22 point 30 minutes. The third period of time is smooth electricity from 22 point 30 minutes to 24 point 00 minute. The setting of rate period of time is sent to computer management system by electric power company according to national policy and saved in X25045. The apex electricity, smooth electricity, vale electricity and total electricity per month read saved in electrical energy meter and sent to epigenous computer through cell controller. The communication baud rate is 9600 bits per second. The checkout platform of 0.1 grade standard electronic power meter is used as standard meter and the multi-rate watt-hour meter is the tested meter. Billion Electron Company has carried out testing according to different load running. The measured data is shown in table 1 with the burthen of 30kW.TABLE I. COMPARE OF NORMAL METER AND TESTING METERThe testing result indicates that the error of this multi-ratewatt-hour meter is less than 1%, belongs to 1.0 grade. The return reading of electrical energy is precision and the emendation of time is timely and right. By testing, the method of decreasing errors for electricity metering can be obtained. Firstly, adjust the sampling resistance of AD7752 to accurate value. Secondly, the value of this resistance is needed less varying with temperature. Thirdly, during electricity metering progress, when mantissa portion of electricity is less than0.01, the remaining pulse should be accessed together, thus cumulative error caused by lack of 0.01degree energy loss could be avoided.VI. CONCLUSION AND EXPECTATIONThe multi-rate watt-hour meter achieves electrical energycomputation in different time according to different time setting. It adopts RS485 for serial communication and realizes automatic meter reading and real-time emendation. The results of production in Billion Electron Company showthat the multi-rate three-phase watt-hour meter proposed in this paper has the characteristics of novel design technique, accurate measurement, and flexible time period setting. Various technical indexes achieve the technique standard for national intelligent card watt-hour meter. Therefore, it has wide application. REFERENCES [1] Bu Zhengl iang, Yin Xianggen, Tu Guangyu. “Development of HV Watt-hour meter.” Automation of Electric Power Systems, 2006, 30(19): 89-93.[2] Kosukegawa M., Sakumoto Y. “Traceability system of electric energy standard and tendency in static watthour meter developmen t in Japan.” Sixth International Conference on Metering Apparatus and Tariffs for Electricity Supply, 1990,4: 259-263.[3] Xuehai Li. Applied tutorial of singlechip. Electronic industry publishing company, 2003.[4] Al-Khateeb Tarik, Blundel Martin. “An el ectronic meter for measuring the saving in electrical power.” The Ninth Arab International Conference on Solar Energy (AICSE-9), Kingdom of Bahrain, 2007,4 (209):328-333.[5] Liu Ying, Liu Qingyu. “Development of a self-calibration precision electricalmea suring meter.” Proceedings of the 1998 Conference Precision Electromagnetic Measurements, 1998,7:276.。
附录A 英文原文ULTASONIC RANGING IN AIRG. E. Rudashevski and A. A. GorbatovOne of the most important problems in instrumentation technology is the remote,contactless measurement of distances in the order of 0.2 to 10 m in air.Such a problem occurs,for instance,when measuring the relativethre edimensional position of separate machine members or structural units.Interesting possibilities for its solution are opened up by utilizing ultrasonic vibrations as an information carrier.The physical properties of air,in which the measurements are made,permit vibrations to be employed at frequencies up to 500 kHz for distances up to 0.5 m between a member and the transducer,or up to 60 kHz when ranging on obstacles located at distances up to 10 m.The problem of measuring distances in air is somewhat different from other problems in the a -pplication of ultrasound.Although the possibility of using acoustic ranging for this purpose has been known for a long time,and at first glance appears very simple,nevertheless at the present time there are only a small number of developments using this method that are suitable for practical purposes.The main difficulty here is in providing a reliable acoustic three-dimensional contact with the test object during severe changes in the air's characteristic.Practically all acoustic arrangements presently known for checking distances use a method of measuring the propagation time for certain information samples from the radiator to the reflecting member and back.The unmodulated acoustic(ultrasonic)vibrations radiated by a transducer are not in themselves a source of information.In order to transmit some informational communication that can then be selected at the receiving end after reflection from the test member,the radiated vibrations must be modulated.In this case the ultrasonic vibrations are the carrier of the information which lies in the modulation signal,i.e.,they are the means for establishing the spatial contact between the measuring instrument and the object being measured.This conclusion,however,does not mean that the analysis and selection of parameters for the carrier vibrations is of minor importance.On the contrary,the frequency of the carrier vibrations is linked in a very close manner with the coding method for the informational communication,with the passband of the receiving and radiating elements in the apparatus,with the spatial characteristics of the ultrasonic communication channel,and with the measuring accuracy.Let us dwell on the questions of general importance for ultrasonic ranging in air,namely:on the choice ofa carrier frequency and the amount of acoustic power received.An analysis shows that with conical directivity diagrams for the radiator and receiver,and assuming thatthe distance between radiator and receiver is substantially smaller than the distance to the obstacle,theamount of acoustic power arriving at the receiving area Pr for the case of reflection from an ideal planesurface located at right angles to the acoustic axis of the transducer comes towhere Prad is the amount of acoustic power radiated,B is the absorption coefficient for a plane wave inthe medium,L is the distance between the electroacoustic transducer and the test me -mber,d is the diameterof the radiator(receiver),assuming they are equal,and c~is the angle of the directivity diagram for theelectroacoustic transducer in the radiator.Both in Eq.(1)and below,the absorption coefficient is dependent on the amplitude and not on theintensity as in some works[1],and therefore we think it necessary to stress this difference.In the various problems of sound ranging on the test members of machines and structures,therelationship between the signal attenuations due to the absorption of a planewave and due to thegeometrical properties of the sound beam are,as a rule,quite different.It must be pointed out that the choiceof the geometrical parameters for the beam in specific practical cases is dictated by the shape of thereflecting surface and its spatial distortion relative to some average position.Let us consider in more detail the relationship betweenthe geometric and the power parameters ofacoustic beams for the most common cases of ranging on plane and cylindrical structural members.It is well known that the directional characteristic W of a circular piston vibrating in an infinite baffle is afunction of the ratio of the piston's diameter to the wavelength d/λ as found from the following expression:(2)where Jl is a Bessel function of the first order and α is the angle between a normal to the piston and aline projected from the center of the piston to the point of observation(radiation).From Eq.(2)it is readily found that a t w o-t o-o n e reduction in the sensitivity of a radiator with respectto sound pressure will occur at the angle(3)For angles α≤20.Eq.(3)can be simplified to(4) where c is the velocity of sound in the medimaa and f is the frequency of the radiated vibrations.It follows from Eq.(4)that when radiating into air where c=330 m/s e c,the necessary diameter of the radiator for a spedfied angle of the directivity diagram at the 0.5 level of pressure taken with respect to the fdc 76.05.0≈αaxis can befound to be(5)where disincm,f is in kHz,and α is in degrees of angle.Curves are shown in Fig.1 plotted from Eq.(5)for six angles of a radiator's directivity diagram.The directivity diagrm needed for a radiator is dictated by the maximum distance to be measured and bythe spatial disposition of the test member relative to the other structural members.In order to avoid theincidence of signals reflected from adjacent members onto the acoustic receiver,it is necessary to provide asmall angle of divergence for the sound beam and,as far as possible,a small-diameter radiator.These tworequirements are mutually inconsistent since for a given radiation frequency a reduction of the beam'sdivergence angle requires an increased radiator diameter.In fact,the diameter of the"sonicated"spot is controlled by two variables,namely:the diameter of theradiator and the divergence angle of the sound beam.In the general case the minimum diameter ofthe"sonicated"spot Dmin on a plane surface normally disposed to the radiator's axis is given by(6)where L is the least distance to the test surface. The specified value of Dmin corresponds to a radiator with a diameter(7)As seen from Eqs.(,6)and(7),the minimum diameter of the"sonieated"spot at the maximum requireddistancecannot be less than two radiator diameters.Naturally,with shorter distances to the obstacle the sizeof the"sonicated" surface is less.Let us consider the case of sound ranging on a cylindrically shaped object of radius R.The problem is to measure the distance from the electroacoustic transducer to the side surface of the cylinderwith its various possible displacements along the X and Y axes.The necessary angleαof the radiator'sdirectivity diagram is given in this case by the expression(8) whereα is the value of the angle for the directivity diagram,Ymax is the maximum displacement of the cylinder's center from the acoustic axis,and Lmin is the minimum distance from the center of theelectroacoustic transducer to the reflecting surface measured along the straight line connecting the center ofthe m e m b e r with the center of the transducer.It is clear that when measuring distance,the"running"time of the information signal is controlled by thefd α1400≈fcL d 5.1=fcLD 6min =min maxarcsinL R y +≥αlength of the path in a direction normal to the cylinder's surface,or in other words,the measure distance isalways the shortest one.This statement is correct for all cases of specular reflection of the vibrations from thetest surface.The simultaneous solution of Eqs.(2)and(8)when W=0.5 leads to the following expression:(9) In the particular case where the sound ranging takes place in air having c=330 m/sec,and on theasstunption that L min <<R,the necessary d i a m e t e r of a unidirectional piston radiator d can be found fromthe fomula (10) where d is in cm and f is in kHz. Curves are shown in Fig.2 for determining the necessary diameter of the radiator as a function of theratio of the cylinder's radius to the maximum displacement from the axis for four radiation frequencies.Alsoshown in this figure is the directivity diagram angle as a function of R and Y rnax for four ratios of m i n i m u mdistance to radius.The ultrasonic absorption in air is the second factor in determining the resolution of ultrasonic rangingdevices and their range of action.The results of physical investigations concerning the measurement ofultrasonic vibrations air are given in[1-3].Up until now there has been no unambiguous explanation of thediscrepancy between the theoretical and expe -rimental absorption results for ultrasonic vibrations inair.Thus,for frequencies in the order of 50 to 60 kHz at a temperature of+25oC and a relative humidity of37%the energy absorption coefficient for a plane wave is about 2.5dB/m while the theoretical value is 0.3 dB/m.The absorption coefficient B as a function of frequency for a temperature of+25o Cand a humidity of37%according to the data in[2]can be described by Table 1.The absorption coefficient depends on the relative humidity.Thus,for frequencies in the order of 10 to20kHz the highest value of the absorption coefficient occurs at 20%humidity[3],and at 40%humidity theabsorption is reduced by about two to one.For frequencies in the order of 60 kHz the maximum absorptionoccurs at 30.7o humidity,dropping when it is increased to 98% or lowered to 10%by a factor of approximatelyfour to one.The air temperature also has an appreciable effect on the ultrasonic absorption[1].When thetemperature of the medium is increased from+10 to+30,the absorption for frequencies between 30 and 50kHz increases by about three to one.Taking all the factors noted above into account we arrive at the following approximate values for theabsorption coefficient:at a frequency of 60 kHz /3min =0.15 m -1 and~max=0.5-1;at a frequency of 200 ()maxmin 76.0y L R d +=λmax25fy R d ≈kHz/~min=0.6 m -1 and B max =2 m -1.(11)The values for the minimum~min and rnaxil-num~max"transmittance"coefficients were obtained in thea bsence of aerosols and rain.Their difference is the result of the possible variations in temperature over therange from -3 0 to+50~and in relative hmnidity over the range from 10 to 98%.The overall value ofthe"transmittance"is obtained by multiplying the values of g and 0 for given values of L,f,and d.L I T E R A T U R E C I T E DMoscow(1957).Moscow(1960).附录B 中文翻译在空气中超声测距G. E. Rudashevski and A. A. Gorbatov在仪器技术中远程是最重要的一个问题。
=======大学本科生毕业设计外文文献及中文翻译文献题目: ULTRASONIC RANGING SYSTEM 文献出处: United States Patent译文题目:超声波测距系统学生:指导教师:专业班级:自动化11-4学号: 110601140416电气信息工程学院2014年5月1日超声波测距系统摘要超声波测距系统,是指选择性地激励一个变压器,使之产生换能器驱动信号。
超声换能器发射的超声波脉冲用于响应驱动信号然后接收到一个在超声波信号发出之后的回波信号。
分路开关接在变压器的绕组上,当超声波信号的传输在允许的近距离范围内达到一个稳定的等级,分路开关选择性的闭合来阻止蜂鸣器报警。
第1章发明背景像在宝丽来相机中应用的可用范围测试系统,它们都是准确而且可靠的,但都不适用于近距离测距,举个例子,2到3英寸的距离内就不适用,所以他们在9英寸甚至更远的距离测距是可靠的。
它们可以应用在很多的应用程序中,但不适用于可移动机器人领域内。
机器人通常必须通过门口只有两三英寸的间隙,如果当可移动机器人被操作于避障模式下通过狭小空间,可能机器人的规避路径过于狭窄,此外,规避动作应该使偏指定的路径距离最小化。
近距离测距不用于超声波系统的一个原因是,近距离输出脉冲输出太长以至于它重叠在回波脉冲上,即使输出脉冲缩短,输出脉冲仍然重叠回波脉冲,因为声音紧跟着输出脉冲。
备中产生的回波信号脉冲的范围为100毫伏,但设置传感器响应所必需的电路回声脉冲是大约150伏到300伏之间。
因此即使是最小的声波也会盖过回声信号。
事实上,dual-diode钳位电路用于将150伏降低到二极管的击穿电压,即0.7伏特。
但是这700毫伏足以盖过100毫伏的回波信号。
目前系统需要50毫秒将300伏特的峰值发射电压降到0.7伏特,且额外需要500到600毫秒的时间将它稳定在1毫伏范围。
第2章发明总结本发明可以提供一种改进的超声波测距系统。
本发明也可以提供一个改进的多通道超声波测距系统。
超声波测距摘要:本演示处理了测量距离的超声波传感器在当前环境中的准确性。
作为一个测量传感器的选择SFR08型配备了允许寻址的I ²C 通信接口。
这一事实使得创建传感器阵列变得简单。
控制和可视化系统是基于PC PC。
NI USB 8451是作为通信卡使用的。
验证测量的目标是确定实际的传感器精度,特别是当测量较长的距离。
当评估传感器的精度时,不包括在所测量的数据的温度补偿。
关键词:超声波传感器,I ²C 通信接口,虚拟仪器1 1 简介简介超声波传感器通常用于自动化的任务来测量距离,位置变化,电平测量,如存在检测器或在特殊应用中,例如,当测量透明材料的纯度。
它们是基于测量超声波的传播时间的原则。
这一原则确保可靠的检测是独立的颜色渲染的对象或其表面的设计和类型。
它可以可靠地检测甚至液体,散装材料,透明物体,玻璃等材料。
他们使用的另一个参数是他们在侵略性的环境中使用,不是非常敏感的污垢和测量距离的可能性。
超声波传感器在许多机械设计中被制造。
对于实验室用途,用于发射器和接收器单独或在一个单一的简单的住房,对于工业用途,往往建造坚固的金属外壳。
有些类型允许您使用电位计或数字来调整灵敏度。
此外,输出可以在统一的版本中或直接以数字形式的模拟信号直接中。
就传感器来说,可以通过通信接口连接到PC ,它是可以设置所有传感器的工作范围和测量距离的详细参数。
2 2 超声测量超声测量超声对环境中的声音具有相似的传播特性。
这是机械振动的粒子环境。
超声波可以在气体、液体和固体中传播。
对于超声波通常被认为是一个频率高于20千赫的声音。
千赫的声音。
根据超声波的用途可以分为两类: 主动超声:当应用表现出物理或化学效应。
生成的输出达到更高的值。
超声波用于清洁,焊接,钻孔等。
被动超声;输出是在低得多(通常是小)值产生的对比度。
他的主要应用领域是测量距离,检测材料的缺陷和材料的厚度,测量液体和气体的流量,以及医疗保健的诊断。
Ultrasonic distance and velocity measurement using a pair of LPM signals for cross-correlation method:Improvement of Doppler-shift compensation and examination of Doppler velocity estimation超声波距离和速度利用互相关方法对LPM信号测量:多普勒频移补偿和多普勒速度估计检测的改进数据来源Elsevier Journal Elsevier期刊刊物名Ultrasonics, 2012, Vol.52 (7), pp.873-879 超声波,2012,卷(7),pp.873-879 作者Shinnosuke Hirata, Minoru Kuribayashi Kurosawashinnosuke平田,稔栗林黑泽明单位机械工程与智能系统1,信息工程学院,电子通信,1-5-1 chofugaoka e4-329,,,布,东京182-8585大学,日本信息处理系,跨学科研究生科学与工程学院,东京工业大学,4259首席人事官g2-32,长津田,绿区,横滨,神奈川226-8502,日本AbstractReal-time distance measurement of a moving object with high accuracy and high resolution using an ultrasonic wave is difficult due to the influence of the Doppler effect or the limit of the calculation cost of signal processing. An over-sampling signal processing method using a pair of LPM signals has been proposed for ultrasonic distance and velocity measurement of moving objects with high accuracy and high resolution. The proposed method consists of cross correlation by single-bit signal processing, high-resolution Doppler velocity estimation with wide measurement range and low-calculation-cost Doppler-shift compensation. The over-sampling cross-correlation function is obtained from cross correlation by single-bit signal processing with low calculation cost. The Doppler velocity and distance of the object are determined from the peak interval and peak form in the cross-correlation function by the proposed method of Doppler velocity estimation and Doppler-shift compensation. In this paper, the proposed method of Doppler-shift compensation is improved. Accuracy of the determined distance was improved from approximately within ±140 μm in the previous method to approximately within ±10μm in computer simulations. Then, the proposed method of Doppler velocity estimation is evaluated. In computer simulations, accuracy of the determined Doppler velocity and摘要实时测量移动物体的高精度和高分辨率超声波存在的多普勒效应或信号处理的计算成本的限制的影响。
毕业设计(论文)英文翻译姓名学号0811122121所在学院理学院专业班级2008级光信1班指导教师日期2012年4月20日英文原文1.5 Experimental Setup Due to the many concepts and variations involved in performing the experimentsin this project and also because of their introductory nature Project 1 will very likelybe the most time consuming project in this kit. This project may require as much as 9hours to complete. We recommend that you perform the experiments in two or morelaboratory sessions. For example power and astigmatic distance characteristics maybe examined in the first session and the last two experiments frequency andamplitude characteristics may be performed in the second session. A Note of Caution All of the above comments refer to single-mode operation of the laser which is avery fragile device with respect to reflections and operating point. One must ensurethat before performing measurements the laser is indeed operating single-mode.This can be realized if a single broad fringe pattern is obtained or equivalently a goodsinusoidal output is obtained from the Michelson interferometer as the path imbalanceis scanned. If this is not the case the laser is probably operating multimode and itscurrent should be adjusted. If single-mode operation cannot be achieved by adjustingthe current then reflections may be driving the laser multimode in which case thesetup should be adjusted to minimize reflections. If still not operating single-modethe laser diode may have been damaged and may need to be replaced. Warning The lasers provided in this project kit emit invisible radiation that can damagethe human eye. It is essential that you avoid direct eye exposure to the laser beam.We recommend the use of protective eyewear designed for use at the laser wavelengthof 780 nm. Read the Safety sections in the Laser Diode Driver Operating Manual and in thelaser diode section of Component Handling and Assembly Appendix A beforeproceeding.1.5.1 Semiconductor Diode Laser Power Characteristics1. Assemble the laser mount assembly LMA-I and connect the laser to its powersupply. We will first collimate the light beam. Connect the laser beam to a videomonitor and image the laser beam on a white sheet of paper held about two to tencentimeters from the laser assembly. Slowly increase the drive current to the laser andobserve the spot on the white card. The threshold drive current rating of the laser issupplied with each laser. Increase the current to about 10-20 mA over the thresholdvalue. With the infrared imager or infrared sensor card observe the spot on the card andadjust the collimator lens position in the laser assembly LMA-I to obtain a bright spoton the card. Move the card to about 30 to 60 centimeters from the lens and adjust thelens position relative to the laser to obtain a spot where size does not vary stronglywith the position of the white card. When the spot size remains roughly constant asthe card is moved closer or further from the laser the output can be consideredcollimated. Alternatively the laser beam may be collimated by focusing it at adistance as far away as possible. Protect fellow co-workers from accidental exposureto the laser beam.2. Place an 818-SL detector on a post mount assembly M818 and adjust its positionso that its active area is in the center of the beam. There should be adequate opticalpower falling on the detector to get a strong signal. Connect the photodetector to thepower meter 815. Reduce the background lighting room lights so that the signalbeing detected is only from the laser. Reduce the drive current to a few milliamperesbelow threshold and again check to see that room light is not the dominantsignal atthe detector by blocking the laser light.3. Increase the current and record the output of the detector as a function of laser drivecurrent. You should obtain a curve similar to Figure 1.2. If desired the diodetemperature may also be varied to observe the effects of temperature on thresholdcurrent. When examining laser diode temperature characteristics the laser diodedriver should be operated in the constant current mode as a safeguard againstexcessive currents that damage the diode laser. Note that as the diode temperature isreduced the threshold decreases. Start all measurements with the diode current off toprevent damage to the laser by preventing drive currents too high above threshold.To prevent destruction of the laser do not exceed the stated maximum drive current ofthe laser.1.5.2 Astigmatic Distance Characteristics The laser diode astigmatic distance is determined as follows. A lens is used tofocus the laser beam at a convenient distance. A razor blade is then incrementallymoved across the beam to obtain data for total optical power passing the razor edge vs.the razor blade position. A plot of this data produces an integrated power profile of thelaser beam Figure 1.9a which through differentiation exposes the actual powerprofile Figure 1.9b which in turn permits determination of the beam diameter W.A beam diameter profile is obtained by measuring the beam diameter while varyingthe laser position. Figure 1.9c illustrates the two beam diameter profiles of interest:one for razor edge travel in the direction perpendicular to the laser diode junctionplane and the other for travel in the direction parallel to the junction plane. Theastigmatic distance for a laser diode is the displacement between the minima of thesetwo profiles. This method is known as the knife edge technique.1. Assemble the components shown in Figure 1.8 with the collimator lens LC in therotational stage assembly RSA-I placed roughly 1 centimeter away from the laser.The beam should travel along the optic axis of the lens. This is the same lens used incollimating the laser in the previous setup. The approximate placement of all thecomponents are shown in the figure. Make sure that the plane of the diode junctionxz plane in Figure 1.1 is parallel with the table surface.2. Due to the asymmetric divergence of the light the cross-section of the beamleaving the laser and further past the spherical lens is elliptical. The beam thus hastwo distinct focal points one in the plane parallel and the other in the planeperpendicular to the laser diode junction. There is a point between the two focalpoints where the beam cross-section is circular. With the infrared imager and a whitecard roughly determine the position where the beam cross-section is circular. Figure 1.9 – Procedure for finding astigmatic distance.3. Adjust the laser diode to lens distance such that the razor blades are located in thexy plane where the beam cross-section is circular.4. Move the laser diode away from the lens until minimum beam waist is reached atthe plane of razor blades. Now move the laser diode about 200 m further away fromthe lens.5. Move razor blade 1 in the x direction across the beam through the beam spreadθxand record the x position and detected intensity at each increment ≤100 mincrements. The expected output is shown in Figure 1.9. The derivative of this curveyields the intensity profile of the beam in the x direction from which the beamdiameter is determined.6. Repeat with razor blade 2 for θy in the y direction.7. Move the laser closer to the lens in increments ≤50 m through a total of at leastthan 500m. Repeat Steps 5 and 6 at each z increment recording the z position.8. Using the collected data determine the beam intensity profiles in the x and ydirections as a function of the lens position z. This is done by differentiating each dataset with respect to position. Then calculate the beam diameter and plot as a functionof z. The difference in z for the minimum in θx and θy isthe astigmatic distance of thelaser diode. Use of computer software especially in differentiating the data is highlyrecommended. If the laser junction is not parallel to the table surface then for eachmeasurement above you will obtain an admixture of the two beam divergences andthe measurement will become imprecise. If the laser is oriented at 45° to the surfaceof the table the astigmatic distance will be zero. Different laser structures will have different angular beam divergences and thusdifferent astigmatic distances. If you have access to several different laser types gainguided index guided it may be instructive to characterize their astigmatic distances.1.5.3 Frequency Characteristics of Diode Lasers In order to study frequency characteristics of a diode laser we will employ aMichelson interferometer to convert frequency variations into intensity variations. Anexperimental setup for examining frequency and also amplitude characteristics of alaser source is illustrated in Figure 1.10.1. In this experiment it is very possible that light may be coupled back into the laserthereby destabilizing it. An optical isolator therefore will be required to minimizefeedback into the laser. A simple isolator will be constructed using a polarizing beamsplitter cube and a quarterwave plate. We orient the quarterwave plate such that thelinearly polarized light from the polarizer is incident at 45° to the principal axes of thequarterwave plate so that light emerging from the quarterwave plate is circularlypolarized. Reflections change left-circular polarized light into right-circular or viceversa so that reflected light returning through the quarterwave plate will be linearlypolarized and 90° rotated with respect to the polarizer transmission axis. The polarizerthen greatly attenuates the return beam. In assembling the isolator make sure that the laser junction xz plane in Figure1.1 is parallel to the surface of the table the notch on the laser diode case pointsupward and the beam is collimated by the lens. The laser beam should be parallel tothe surface of the optical table. Set the polarizer and quarterwave λ/4 plate in place.Place a mirror after the λ/4 plate and rotate the λ/4 pl ate so that maximum rejectedsignal is obtained from the rejection port of the polarizing beam splitter cube asshown in Figure 1.11. When this signal is maximized the feedback to the laser shouldbe at a minimum.2. Construct the Michelson interferometer as shown in Figure 1.12. Place the beamsteering assembly BSA-II on the optical table and use the reflected beam from themirror to adjust the quarterwave plate orientation. Set the cube mount CM on theoptical breadboard place a double sided piece of adhesive tape on the mount and putthe nonpolarizing beam splitter cube 05BC16NP.6 on the adhesive tape. Next placethe other beam steering assembly BSA-I and the detector mountM818BB inlocation and adjust the mirrors so that the beams reflected from the two mirrorsoverlap at the detector. When long path length measurements are made the interferometer signal willdecrease or disappear if the laser coherence length is less than the two wayinterferometer path imbalance. If this is the case shorten the interferometer until thesignal reappears. If this does not work then check the laser for single-mode operationby looking for the fringe pattern on a card or by scanning the piezoelectric transducerblock PZBin BSA-II and monitoring the detector output which should be sinusoidalwith PZB scan distance. If the laser does not appear to be operatingsingle-moderealign the isolator and/or change the laser operating point by varying the bias current.Additionally to ensure single-mode operation the laser should be DC biased abovethreshold before applying AC modulation. Overdriving the laser can also force it intomultimode operation.3. The Michelson interferometer has the property that depending on the position of themirrors light may strongly couple back toward the laserinput port. In order to furtherreduce the feed-back slightly tilt the mirrors as illustrated in Figure 1.13. If stillunable to obtain single-mode operation replace the laser diode.4. Place a white card in front of the detector and observe the fringe pattern with theinfrared imager. Slightly adjust the mirrors to obtain the best fringe pattern. Try toobtain one broad fringe.5. Position the detector at the center of the fringe pattern so that it intercepts no morethan a portion of the centered peak.6. By applying a voltage to the piezoelectric transducer block attached to the mirrorpart PZB in one arm of the interferometer i.e. BSA-II maximize the outputintensity. The output should be stable over a time period of a minute or so. If it is notverify that all components are rigidly mounted. If they are then room air currents maybe destabilizing the setup. In this case place a box cardboard will do over the setupto prevent air currents from disturbing the interferometer setup.7. Place the interferometer in quadrature point of maximum sensitivity betweenmaximum and minimum outputs of the interferometer by varying the voltage on thePZB.8. The output signal of the interferometer due to frequency shifting of the laser isgiven by I∝φ 2π/c L ν where L is the difference in path length b etween thetwo arms of the interferometer and ν is the frequency sweep of the laser that isinduced by applying a current modulation. Remember that in a Michelsoninterferometer L is twice the physical difference in length between the arms sincelight traverses this length difference in both directions. L values of 3-20 cmrepresent convenient length differences with the larger L yielding higher outputsignals. Before we apply a current modulation to the laser note that the interferometeroutput signal I should be made larger than the detector or laser noise levels byproper choice of L and current modulation amplitude di. Also recall from Section1.3that when the diode current is modulated so is the laser intensity as well as itsfrequency. We can measure the laser intensity modulation by blocking one arm of theinterferometer. This eliminates interference and enables measurement of the intensitymodulation depth. We then subtract this value from the total interferometer output todetermine the true dI/di due to frequency modulation. Apply a low frequency smallcurrent modulation to the laser diode. Note that when the proper range is beingobserved 1 dv 10 5 mA 1 v diand 1 dI 0.2mA 1 I difor the amplitude change only.RecallingdI d(Δφ)2π Δv c dI ∝ΔL 10 5 mA 1 di di cΔi 2πΔLv diordI ΔL 2Kπ mA 1di λ10 -5where K is a detector response constant determined by varying L.9. With the interferometer and detection system properly adjusted vary the drivefrequency of the laser and obtain the frequency response of the laser Figure 1.4 or1.10a.You will need to record two sets of data: i the modulation depth of theinterferometer output as a function of frequency and ii the laser intensitymodulation depth. The difference of the two sets of collected data will provide anestimate of the actual dI/di due to frequency modulation. Also note that if the currentmodulation is sufficiently small and the path mismatch sufficiently large the laserintensity modulation may be negligible. You may need to actively keep theinterferometer in quadrature by adjusting the PZB voltage. Make any necessary function generator amplitude adjustments to keep thecurrent modulation depth of the laser constant as you vary the frequency. This isbecause the function generator/driver combination may not have a flat frequencyresponse. The effect of this is that the current modulation depth di is not constant andvaries with frequency. So to avoid unnecessary calculations monitor the current.。
毕业设计(论文)外文参考资料及译文译文题目:Ultrasonic distance meter超声波测距仪学生姓名:张宪旺学号: 1004104013 专业:自动化所在学院:机电工程学院指导教师:赵国树职称:讲师2014年01月08日超声测距系统设计原文出处:传感器文摘布拉福德:1993年第13页摘要:超声测距技术在工业现场、车辆导航、水声工程等领域都具有广泛的应用价值,目前已应用于物位测量、机器人自动导航以及空气中与水下的目标探测、识别、定位等场合。
因此,深入研究超声的测距理论和方法具有重要的实践意义。
为了进一步提高测距的精确度,满足工程人员对测量精度、测距量程和测距仪使用的要求,本文研制了一套基于单片机的便携式超声测距系统。
关键词:超声波,测距仪,单片机1、前言随着科技的发展,人们生活水平的提高,城市发展建设加快,城市给排水系统也有较大发展,其状况不断改善。
但是,由于历史原因合成时间住的许多不可预见因素,城市给排水系统,特别是排水系统往往落后于城市建设。
因此,经常出现开挖已经建设好的建筑设施来改造排水系统的现象。
城市污水给人们带来了困扰,因此箱涵的排污疏通对大城市给排水系统污水处理,人们生活舒适显得非常重要。
而设计研制箱涵排水疏通移动机器人的自动控制系统,保证机器人在箱涵中自由排污疏通,是箱涵排污疏通机器人的设计研制的核心部分。
控制系统核心部分就是超声波测距仪的研制。
因此,设计好的超声波测距仪就显得非常重要了。
2、超声波测距原理2.1压电式超声波发生器原理压电式超声波发生器实际上是利用压电晶体的谐振来工作的。
超声波发生器内部结构,它有两个压电晶片和一个共振板。
当它的两极外加脉冲信号,其频率等于压电晶片的固有振荡频率时,压电晶片将会发生共振,并带动共振板振动,便产生超声波。
反之,如果两电极间未外加电压,当共振板接收到超声波时,将压迫压电晶片作振动,将机械能转换为电信号,这时它就成为超声波接收器了。
Piezoelectric sensor determination of arterial pulse wave velocityArterial pulse wave velocity (APWV) is a measure of the elasticity (or stiffness) of peripheral arterial blood vessels. The pulse referred to here will be the pressure pulse as opposed to the flow pulse measured by ultrasound Doppler.The pressure pulse velocity varies over the range from about 12 m s?1 to15 m s?1 in stiff peripheral arteries, whereas in normal arteriesit has a velocity in the range of 7 to 9 m s?1.The aim of this project was the development of a fast and easy to use system for the determination of peripheral arterial pulse wave velocity. The principle of the PWV measurement is based on simultaneous measurement of two pulse waves at two different positions, such as the radial artery at the wrist and the brachial artery just above the elbow. By determining the pulse transit time between these points and the distance measured between the two locations, pulse wave velocity may then be calculated. The pressure pulse detection is done by using two piezoelectric sensors which generate a measurable voltage at the output contacts if they are mechanically deformed. The deformation produced voltage is first amplified and filtered and then digitalized with a data acquisition card. The analysis of the data obtained from the sensors includes a filtering process, the calculation of the PWV with three different methods— foot-to-foot, cross-correlation and peak-to-peak—and the determination of the arterial pulse rate.Extensive measurements with human test subjects were carried out to optimize the techniques of data acquisition and analysis. For example, it was found that the best procedure was to hold the sensors in place using elastic straps alone. The data analysis was upgraded with an additional software module, which deletes, in effect, outriders or invalid measurements. With the optimized system, a series involving eight test subjects ranging in age from 22 to 32 years was completed (all normotensive). The arterial pulse wave velocities determined covered a range from 6 m s?1to 12 m s?1, with an average standard deviation of less than 2.5 m s?1for individual results. These areslightly higher,but close to published APWV data. The results showedthat reproducible results can be obtained with the existing PWV acquirement and analysis system.The measurement of arterial pulse wave velocity (APWV) is one of the methods used to measure physiological changes in peripheral vascular disease. Others include pressure pulse contour, arterial elasticity, pulsatile flow, complex vascular impedance and cardiac work.There have been many investigations over the past 30 years or so to relate changes in age and progress of arterial disease, to vessel pathology and distensibility based on the propagation characteristics of the arterial pulse (Malindzak and Meredith 1970, McCormack 1981, Persson et al 2001, Ramsey 1995, Wilkinson 1998). They have only been partially successful from a clinical point of view, mainly due to the difficulty in controlling the effects of patient parameters (autonomic system, patient movement, etc).Early on, the methods of determining APWV involved direct invasive measurement of the pulse pressure at two points along anarterial segment and measuring the time taken for the pulse to travelthe length of the segment. Such investigations had to be limited to animals usually dogs.The sensor technique used in this work involves the piezoelectric effect in polyvinyllidene fluoride (PVDF), which produces an output voltage in response to mechanical pressure on the material.Three methods of APWV determination are used: foot-to-foot APWV; peak-to-peak APWV and cross-correlation APWV. The FFAPWV and CCAPWV methods are less sensitive to pressure wave reflections at bifurcations, etc in the arterial tree, than the PPAPWV method. Mean values and standard deviations were computed for all three methods and compared.‘Foot-to-foot’ APWV (FFAPWV). This is based on the velocity of the ‘foot’, or leading edge, of the pressure pulse wave. The ar rival times of the foot of the pulse wave at two positions along the artery are recorded. If Δt is the difference in arrival times and Δs the distance between the two recording positions (proximal and distal), the FFAPWV is simplyFFAPWV = Δs/Δt.‘Peak-to-peak’ APWV (PPAPWV). This is completely analogous to the FFAPWV except that the points of observation are the two (proximal and distal) peaks of the pulse wave andPPAPWV = Δs/Δt.Apparent pulse wave velocity (AAPWV). The pressure wave may be represented as aFourier series,P(t) = P0 +Pn sin(nωt + θn)Where P0 is the mean fluid pressure, n is the harmonic number, Pnis the amplitude of the nth harmonic and θn is the phase angle of the nth harmonic.The spatial rate of change of the phase for one harmonic based on two simultaneous pressure measurements separated by a distance _s along an artery, is related to the apparent arterial pulse wave velocity (AAPWV) by the following equation,AAPWVn = (Δs)n(f )(360o)/(θx1? θx2)Where AAPWV n is the apparent pulse wave velocity for the nth harmonic, f is the heart rate,θx1 is the phase angle for the proximal harmonic n and θx2 is the phase angle for the distal harmonic n.Cross-correlation PWV. If the arterial pulse at the proximal measurement position is represented by the pressure time series P(x1, t) and that at the distal position by P(x2, t) andthe cross-correlation coefficient is Φx1,x2(τ ), then Φwill have a maximum value at some time lag.The correlation function can be expressed asΦx1,x2(τ ) = (1/T )P(x1, t)P(x2, t) dt.The value of τ at which maximum correlation occurs represents the transit time (_t) of the pressure wave from position x1 to position x2 along the arterial segment. From the separation distance and transit time data the correlation arterial pulse wave velocity isCCAPWV = (x2 ? x1)/ Δt.In this work normal, young test subjects were used, and it has the primary objectives of optimizing the measurement procedures and establishing the statistical spread and mean values of the observed PWVs for a specific peripheral arterial segment. Based on this, it is planned to use the system in clinical trials involving patients with peripheral arterial disease (due to diabetes, hypertension, etc), pre-, during and post treatment (pharmaceutical or surgical).Analogue and digital circuitryAnalogue charge amplifier. Piezoelectric materials convert mechanical stress or strain into proportionate electrical energy, by producing a charge when subjected to mechanical stress. The charge is converted to a voltage by an operational amplifier connected as a current integrator, called a charge amplifier. The signal output of the amplifier is approximately ?30 mV. It is augmented by signal amplification.Analogue signal amplification . This is done by use of an inverting amplifier. Because a dc signal appears at the output of the chargeamplifier, dc offset removal is essential and is implemented in the inverting summingThe next phase of the analogue circuitry is a low pass filter to remove the 50 Hz noise interference.Digital controlled data acquisition and analysis. A dataacquisition board (DAQ) is required when the transducer signals need interfacing with a PC. The board contains 12 bit plus sign and a successive approximation and self-calibrating analogue-to-digital (ADC) converter. The ADC incurs a systematic error known as the quantization error. It is due to limited resolution and with the analogue input limit set at ?5 to +5 V, the quantization error of the A/D converter used here was calculated to be 0.122 mV.The data acquisition and analysis was done using Lab View—a powerful instrumentation and analysis programming language for PCs.Digital data acquisition program. The data acquisition circuit performs all the necessary operations for the data acquisition with Lab View. The functions of the circuit initialize the data acquisition and read the data from the acquisition card. These data are stored for later use in the data analysis part of the program.Lab View programs are called virtual instruments (VIs) because of their appearance and operations are analogous to measuring instruments.A VI that is called within another VI is called a sub-VI and is analogous to a subroutine in text-based languages.The data acquisition, analysis and presentation are comprised of three main procedures:(1) Data acquisition card to interface the hardware to the PC.(2) Data acquisition program to acquire and store data in a spreadsheet file.(3) Data analysis to carry out digital signal processing, calculate PWV and present results.PWV Calculation1. PWV calculation using peak detection. To calculate PWV using peaks, the location of the peaks must first be determined, so that the transit time of the wave between the peaks can be determined. It was found that the best method of peak detection is the derivative of the curve method. If the first derivative of a curve is zero, then an extreme value can exist—eithera peak or a turning point. It is necessary to take the second derivative at this point—if this is also zero, then an extreme value exists. The second VI used to determine the PWV is PWVcalc, using the time separation between the located peaks.2. PWV with pressure wave foot detection. The VI named PWV Foot determines the leading edge (foot) of the pressure wave at the upstream and downstream locations. The VI named PWVcalc is again used to compute the PWV from the time separation between the two leading edges (‘foot-to-foot’ APWV or FFAPWV).3. PWV with cross-correlation. The PWV determination with cross-correlation is done with the VI named CalcPWV. The VI is in two parts: a part for the initialization function and a part for the calculation of the CCAPWV.In all cases PWV values are assembled in an array and the mean value, standard deviation and variance are calculated.Sensor positioningSensor placement is critical to obtaining consistent measurements.A screw mechanism was first used to apply the sensors to the skin. But readings were very variable and so this technique was replaced by that in which the sensors are fixed to the skin by elastic strips. This led to better results.。
The Design of Ultrasonic Distance Measurement System Basedon S3C2410Hongjiang He Jianyi LiuCollege of Information and Electrical Engineering, Hebei University ofEngineering, Handan, Hebei Provice,China, 056038E-mail:liujianyi2002@AbstractThe system introduces the composition of the ultrasonic distance measuring system based on S3C2410 and gives the operation principle and procedure design method. The module of temperature compensation circuit has been added to hardware circuit to improve the precision. S3C2410 drive transducer sent a 40kHz square wave signal, opening the external interrupt and triggerring timer interrupt, The external interrupt receive echo signal immediately triggerring the timer to obtain ranging value. The ranging value is real-time displayed through the LCD.The structure of ultrasonic measuring module driver program is analyzed in embedded Linux system. The system can be used for the distance measurement parameters needed for a variety of application occasions.1. IntroductionWith the development of modern industry, the ultrasonic detection technology has won increasingly widely application. The ultrasonic Distance Measurement is a non-contact detection which is using a directional can be fired, point of the good features, combined with electronic technology such as micro-electronics technology to achieve. It can not be affected by factors such as light, electromagnetic waves and dust. The information processing is simple,low cost and fast. It’s widely used by robotic and automatic applications, the obstacle avoidance, vehicle positioning and the navigation, liquid level measurement and so on.2. Ultrasonic Distance Measurement System Principle2.1. Principle of piezoelectric ultrasonic sensorsThe development of ultrasonic device using of the physical characteristics and the various effects of the ultrasound in the field of ultrasound is called the ultrasonic transducer, the detector or sensor. The ultrasonic transducer can be divided into piezoelectric and electromagnetic type and so on by its operation principle. The piezoelectric is the most commonly used.Actually, Piezoelectric ultrasonic generator is using piezoelectric crystal resonator to work. There are two internal ultrasonic piezoelectric generator chips and are sonance board, when it polarized plus pulse signal and the frequency is equivalent of the inherent oscillation frequency of the piezoelectric film, piezoelectric films will be in resonance, and resonance driven plate vibration, creates ultrasonic. Conversely,if the two do not applied voltage between electrodes,when the board received ultrasonic resonance, the chip will be oppressed for piezoelectric vibration, mechanical energy is transformed into electrical signals, and then it becomes ultrasonic receiver.2.2. Ultrasonic Distance Measurement PrincipleUltrasonic Distance Measurement Principle of the system uses transit time method, that isS=1/2vtAmong them, S is the distance between the obstacles and the sensor, t is the time difference, v isthe acoustic propagation velocity. The relationship between v and temperature is as follows:T is the absolute temperature.V0 =331.4m/s. In normal circumstances ultrasonic is similar to the speed of sound velocity, under the influence of the indoor temperature is of about 340 m/s.3. System Design3.1. System ComponentsThe core of the plan is based on Samsung's S3C2410. By software programming, the plan achieves the chip timely control of peripheral circuits, and provides all the necessary signals to peripheral circuits,including frequency oscillation signal, signal and data processing translation Code display signals and so on and greatly simplifies the design of the peripheral circuit difficult, but it is even more important that the design significantly saves design cost, and because of the software programming technology, it has the good performance transplantation and can be more functional design into account in the design of circuit.The efficiency of the dissemination of the frequency of about 40kHz ultrasound is the best. The ultrasound was launched into 40 kHz modulation about with a certain interval pulse modulation signals. The Ranging System structure is shown in Figure 1, the system consists of measuring system, the control and display components.Fig. 1 component diagram of the system3.2. Ultrasonic Transmitter CircuitUltrasonic transmitter circuit schematic shows in Fig 2. The output drive circuitof the transducer is powered directly by 9V battery, and providing 18V voltage to driver the ultrasonic transducer. The birdge circuit which is formed by six reversers produced the18V voltage, One side provides driver phase shift signal, the other side is drived by reverse signal.Setting the output voltage amplitude double, and the18V is sent to transducer in the form of push-pull. Two reverse parallel to each side can provide sufficient current to drive transducer. Because the working voltage of CD4049 is 9V, the S3C2410 output voltage is 3.3V. The logic level does not match between S3C2410 and output drive circuit. The triode Q1 solves this problem.Fig 2. ultrasonic transmitter circuit3.3. Ultrasonic Receiver CircuitThe IC CX20106A is a dedicated chip for the receiving of infrared detector, which is widely used in the TV infra-red remote control receiver, taking into account its 38kHz of the carrier frequency, which is relatively close ultrasonic frequency. We can use it to produce ultrasonic detection receiver circuit, as shoun.It was proved that the CX20106A receive ultrasonicwith high sensitivity and a strong anti-jamming capability. The sensitivity and anti-jamming capability of receiver circuit can be changed by appropriate changing the size of capacitor C4. The ultrasonic receiver circuit schematic is shown in Fig 3.Fig 3. ultrasonic receiver circuit.3.4. Temperature ModuleThe design of the temperature module is using sensor DS18B20 as detection devices which isproduced by DALLAS semiconductor company in America. Temperature rangeis -55~125. Themaximum resolution is 0.0625. and The measured temperature can be directly read out. DS18B20 can connect with ARM by three-wire system, which decreases the external hardware circuit, with the characteristics of low-cost and ease to using.4. Ultrasonic Distance Measurement Module Driver DesignDevice driver is the interface between the operating system kernel and the hardware. Because of the protection of the operating system, applications for all hardware system must be visited by drivers. For application procedures, the hardware is not transparent;it must be driven by the corresponding procedure defined in the driver communication interface (write,read, ioctl, etc.) to achieve the operation of the hardware. Ultrasonic sensor equipment is the read-only characters in Linux system, it is only a response to the application of ultrasonic drive transmission control parameters, and the driven procedures have completed specific distance measurement, and the application procedures in the state users read ultrasonic equipment,receiving obstacles information from different orientations.Fig 4. The role of Linux Driver4.1. Device Driver InterfaceThe access equipment of Linux system is like a file,the characters device uses struck file operationstructure to define various operational equipment set of equipment. The structure of the various functions were similar response to the same name or the name of the system call, it is a function of operating peripheral interface, also called the device driver interface.Procedures for the preparation of character device driver are designed to achieve the various functions of struct file_operation. Of course, the driver is not to achieve all of these functions may be based on the real equipment need to achieve the necessary function.Ultrasonic sensor device driver file_operation was defined as follows:struct file operations s3c2410_sonar_fops={Owner: THIS_MODULE,Open: s3c2410_sonar_open,Read: s3c2410_sonar_read,Write: s3c2410_sonar_write,Release: s3c2410_sonar_release,Ioctl: s3c2410_sonar_ioctl,};From the function interface, we can achieve opening, reading, writing, releasing and controlling ofthe ultrasonic sensor device.4.2. Initialization and Uninstall ModuleThe Module initialization function int s3c2410_sonar_init(void) is the essential processing functions in the process of developing module,it is used for the initialization of device, interrupt initialization and handling, equipment registration and so on. In this function, through the register_chrdev(0,DEVICE_NAME, & s3c2410_sonar_fops), we realize characters device applications and use the core dynamic way to the distribution device. When the device is opened, Ultrasonic sensor device was initialization, achieving the bundled interrupt handling,interrupt application and interrupt initialization, avoid each initialization equipment related to a interrupt ofoperations.Static void s3c2410_sonar_exit(void) function is one of the essential functions in the development of the driver module, it is used to for unload at the interrupt stopped, the release of resources, and so on. At the same time the characters device was unregistered,Device unregistered from unregister_chrdev (Major,DEVICE_NAME) statement completion.4.3. Interrupt HandlingModules used the idea combined the timer ofARM9 and external interrupt, and used a timer readable numerical functions. The interrupt handling procedures used timer_isr(), eint_isr() function to achieve distance measured process. The initialization,configuration parameters and interrupt bind of timer and external interrupt relevant register are completed in interface function s3c2410_sonar_open().The cycle of the timer is 60ms, which is sufficient to received trigger external interrupt echo occurred.External interrupt completed the store of the numerical time. Through the detection which is higher or low interval of the s3c2410 specific I/O port to store thetime corresponding to the storage area. Timer interrupt completes the distance calculation; judges whether it exceeds the precise scope of distance measurement, and starts the next operation. By initiating the next time sensor of numerical values to calculate the distance, which is corresponding to the storage area,the time records and ranging array are composed of storage area.4.4. Device open, release and control FunctionThese functions fill the s3c2410_sonar_fops structure and realize the operation of ultrasonic sensor device. s3c2410_sonar_open() function is used to open the device, the Acer MOD_INC_USE_COUNT increases the driver modules reference count,request_irq() function is application for the installation of the timer and eint interrupt service procedures.Followed by complete storage area array, control port,timer and external interrupt register parameters initialization, Calling init_isr() to achieve the interrupt parameter setting and interrupt enabled. The function s3c2410_sonar_release()completes interrupt release, MOD_DEC_USE_COUNT Acer reduce driver modules reference count. s3c2410_sonar_ioctl() is major used to control ultrasonic device timer interrupt and the value of distance. Linux application ioctl() function uses sonar() function accepting the value of distance, specific using copy_to_user() or put_user()kernel functions to achieve data transfer.The working principle of the ultrasonic sensor device in embedded Linux systems: opening equipment in the application procedures. Being made real-time response according to the actual situation,through the ioctl() control accessing to the corresponding position value of distance, andachieving a core state and users state data transfer.5. ConcludeThe software and hardware design of Ultrasonic Distance Measurement System was achieved in theS3C2410 + Linux platform. The ultrasonic sensor devices of device driver structure and the development process was detailed analysis in embedded Linux. The driver module is designed. This Ultrasonic Distance Measurement System is an ideal non-contact proximity measurement method, which can be widely used in the shape measurement, control and vehicle location and orientation aspects of industrial robots.6. References1. Johathan Corbet, Alessandro Rubini, Greg Kroab-Hatman.Linux Device Drivers[M]. Beijing: China electric PowerPress. 2005. 46-74.2. Cai Yanping, Cheng Shu, etc. Ultrasonic DistanceMeasuring System Based on Embeded SPT-K Controller.Measurement and control Technique. 2005,vol. 24, NO,3.3. Li Ping. Error analyses and anti-interference measurementof the ultrasonic liquit level measuting instrument.Technology & Economy in Areas of Communications. 2006.4. Zhou Kai, Zhao Wangda, Zhao Di. A High PrescisionUltrasonic Telemeter System. Test Technology. 2007.5. Figneroa JF, Lam ancusa JS. A method for accuratedetection of time of arrival : analysis and design of anultrasonic ranging system. J. Acoust. Soc. Am[J], 1992.47。
原文:Ultrasonic distance meterDocument Type and Number:United States Patent 5442592Abstract:An ultrasonic distance meter cancels out the effects of temperature and humidity variations by including a measuring unit and areference unit. In each of the units, a repetitive series of pulses is generated, each having a repetition rate directly related to therespective distance between an electroacoustic transmitter and an electroacoustic receiver. The pulse trains are provided to respective counters, and the ratio of the counter outputs is utilized to determinethe distance being measured.Publication Date:08/15/1995Primary Examiner:Lobo, Ian J.BACKGROUND OF THE INVENTIONThis invention relates to apparatus for the measurement of distanceand, more particularly, to such apparatus which transmits ultrasonicwaves between two points.Precision machine tools must be calibrated. In the past, this has been accomplished utilizing mechanical devices such as calipers,micrometers, and the like. However, the use of such devices does notreadily lend itself to automation techniques. It is known that thedistance between two points can be determined by measuring the propagation time of a wave travelling between those two points. Onesuch type of wave is an ultrasonic, or acoustic, wave. When anultrasonic wave travels between two points, the distance between thetwo points can be measured by multiplying the transit time of the waveby the wave velocity in the medium separating the two points. It istherefore an object of the present invention to provide apparatusutilizing ultrasonic waves to accurately measure the distance betweentwo points.When the medium between the two points whose spacing is being measured is air, the sound velocity is dependent upon the temperature andhumidity of the air. It is therefore a further object of the,presentinvention to provide apparatus of the type described which isindependent of temperature and humidity variations.SUMMARY OF THE INVENTIONThe foregoing and additional objects are attained in accordance withthe principles of this invention by providing distance measuringapparatus which includes a reference unit and a measuring unit. The reference and measuring units are the same and each includes an electroacoustic transmitter and an electroacoustic receiver. Thespacing between the transmitter and the receiver of the reference unitis a fixed reference distance, whereas the spacing between thetransmitter and receiver of the measuring unit is the distance to be measured. In each of the units, the transmitter and receiver are coupled by a feedback loop which causes the transmitter to generate an acoustic pulse which is received by the receiver and converted into an electrical pulse which is then fed back to the transmitter, so that a repetitive series of pulses results. The repetition rate of the pulsesis inversely related to the distance between the transmitter and the receiver. In each of the units, the pulses are provided to a counter. Since the reference distance is known, the ratio of the counter outputs is utilized to determine the desired distance to be measured. Since both counts are identically influenced by temperature and humidity variations, by taking the ratio of the counts, the resultant measurement becomes insensitive to such variations.BRIEF DESCRIPTION OF THE DRAWINGSThe foregoing will be more readily apparent upon reading the following description in conjunction with the drawing in which the single FIGURE schematically depicts apparatus constructed in accordance with the principles of this invention.DETAILED DESCRIPTIONReferring now to the drawing, there is shown a measuring unit 10 and a reference unit 12, both coupled to a utilization means 14. The measuring unit 10 includes an electroacoustic transmitter 16 and an electroacoustic receiver 18. The transmitter 16 includes piezoelectric material 20 sandwiched between a pair of electrodes 22 and 24. Likewise, the receiver 18 includes piezoelectric material 26 sandwiched between a pair of electrodes 28 and 30. As is known, by applying an electric field across the electrodes 22 and 24, stress is induced inthe piezoelectric material 20. If the field varies, such as by the application of an electrical pulse, an acoustic wave 32 is generated.As is further known, when an acoustic wave impinges upon the receiver 18, this induces stress in the piezoelectric material 26 which causesan electrical signal to be generated across the electrodes 28 and 30. Although piezoelectric transducers have been illustrated, other electroacoustic devices may be utilized, such as, for example, electrostatic, electret or electromagnetic types.As shown, the electrodes 28 and 30 of the receiver 18 are coupled to the input of an amplifier 34, whose output is coupled to the input of a detector 36. The detector 36 is arranged to provide a signal to the pulse former 38 when the output from the amplifier 34 exceeds a predetermined level. The pulse former 38 then generates a trigger pulse which is provided to the pulse generator 40. In order to enhance the sensitivity of the system, the transducers 16 and 18 are resonantly excited. There is accordingly provided a continuous wave oscillator 42 which provides a continuous oscillating signal at a fixed frequency,preferably the resonant frequency of the transducers 16 and 18. This oscillating signal is provided to the modulator 44. To effectivelyexcite the transmitter 16, it is preferable to provide several cyclesof the resonant frequency signal, rather than a single pulse or single cycle. Accordingly, the pulse generator 40 is arranged, in response to the application thereto of a trigger pulse, to provide a control pulseto the modulator 44 having a time duration equal the time duration of a predetermined number of cycles of the oscillating signal from the oscillator 42. This control pulse causes the modulator 44 to pass a "burst" of cycles to excite the transmitter 16.When electric power is applied to the described circuitry, there is sufficient noise at the input to the amplifier 34 that its outputtriggers the pulse generator 40 to cause a burst of oscillating cyclesto be provided across the electrodes 22 and 24 of the transmitter 16. The transmitter 16 accordingly generates an acoustic wave 32 which impinges upon the receiver 18. The receiver 18 then generates an electrical pulse which is applied to the input of the amplifier 34,which again causes triggering of the pulse generator 40. This cycle repeats itself so that a repetitive series of trigger pulses results atthe output of the pulse former 38. This pulse train is applied to the counter 46, as well as to the pulse generator 40.The transmitter 16 and the receiver 18 are spaced apart by the distance "D" which it is desired to measure. The propagation time "t" for an acoustic wave 32 travelling between the transmitter 16 and the receiver 18 is given by: t=D/V swhere V s is the velocity of sound in the air between the transmitter16 and the receiver 18. The counter 46 measures the repetition rate of the trigger pulses, which is equal to 1/t. Therefore, the repetitionrate is equal to V s /D. The velocity of sound in air is a function ofthe temperature and humidity of the air, as follows: ##EQU1## where T is the temperature, p is the partial pressure of the water vapor, H isthe barometric pressure, Γ w and Γ a are the ratio of constantpressure specific heat to constant volume specific heat for water vapor and dry air, respectively. Thus, although the repetition rate of the trigger pulses is measured very accurately by the counter 46, the sound velocity is influenced by temperature and humidity so that the measured distance D cannot be determined accurately.In accordance with the principles of this invention, a reference unit12 is provided. The reference unit 12 is of the same construction asthe measuring unit 10 and therefore includes an electroacoustic transmitter 50 which includes piezoelectric material 52 sandwiched between a pair of electrodes 54 and 56, and an electroacoustic receiver 58 which includes piezoelectric material 60 sandwiched between a pair of electrodes 62 and 64. Again, transducers other than thepiezoelectric type can be utilized. The transmitter 50 and the receiver58 are spaced apart a known and fixed reference distance "D R ". The electrodes 62 and 64 are coupled to the input of the amplifier 66,whose output is coupled to the input of the detector 68. The output ofthe detector 68 is coupled to the pulse former 70 which generatestrigger pulses. The trigger pulses are applied to the pulse generator72 which controls the modulator 74 to pass bursts from the continuous wave oscillator 76 to the transmitter 50. The trigger pulses from thepulse former 70 are also applied to the counter 78.Preferably, all of the transducers 16, 18, 50 and 58 have the same resonant frequency. Therefore, the oscillators 42 and 76 both operateat that frequency and the pulse generators 40 and 72 provide equal width output pulses.In usage, the measuring unit 10 and the reference unit 12 are in close proximity so that the sound velocity in both of the units is the same. Although the repetition rates of the pulses in the measuring unit 10and the reference unit 12 are each temperature and humidity dependent, it can be shown that the distance D to be measured is related to the reference distance D R as follows: i D=D R (1/t R )/(1/t)where t R is the propagation time over the distance D R in thereference unit 12. This relationship is independent of both temperature and humidity.Thus, the outputs of the counters 46 and 78 are provided as inputs tothe microprocessor 90 in the utilization means 14. The microprocessor90 is appropriately programmed to provide an output which is proportional to the ratio of the outputs of the counters 46 and 78,which in turn are proportional to the repetition rates of therespective trigger pulse trains of the measuring unit 10 and the reference unit 12. As described, this ratio is independent oftemperature and humidity and, since the reference distance D R is known, provides an accurate representation of the distance D. The utilization means 14 further includes a display 92 which is coupled toand controlled by the microprocessor 90 so that an operator can readily determine the distance D.Experiments have shown that when the distance between the transmitting and receiving transducers is too small, reflections of the acousticwave at the transducer surfaces has a not insignificant effect which degrades the measurement accuracy. Accordingly, it is preferred that each transducer pair be separated by at least a certain minimum distance, preferably about four inches.译文:超声波测距仪文件类型和数目:美国专利5442592摘要:提出了一种超声波测距仪来抵消温度和湿度的变化,包括测量单元和参考标准。
International Journal of Computer science & Information Technology (IJCSIT), Vol 1, No 2, November 2009EFFECT OF VARIATION OF SEPARATION BETWEEN THE ULTRASONIC TRANSMITTER AND RECEIVER ON THE ACCURACY OF DISTANCE MEASUREMENTAjay Kumar Shrivastava1, Ashish Verma2 and S. P. Singh31Department of Computer Application, Krishna Institute of Engineering and Technology, Ghaziabad (U.P.), Indiaajay@2Department of Physics and Electronics, Dr H S Gour University, Sagar (M.P.), Indiavermaashish31@3Department of Electronics and Communication, Noida Institute of Engineering and Technology, Ghaziabad (U.P.), Indiasahdeopsingh@ABSTRACTAccuracy of distance measurement of an object from an observation point such as a stationary or moving vehicle, equipment or person is most important in large number of present day applications. Ultrasonic sensors are most commonly used due to its simplicity and low cost. The accuracy of the measured distance is dependent on the separation between the ultrasonic transmitter and receiver. This dependency has been studied and reported in this paper. The result shows that the accuracy of distance measured is dependent on the separation between the transmitter and the receiver.KEYWORDSAccuracy of distance measurement, Ultrasonic sensor, distance measurement, microcontroller, sewer pipeline inspection, sewer pipeline maintenance, robotics.1. INTRODUCTIONDistance measurement of an object in front or by the side of a moving or stationary entity is required in a large number of devices and gadgets. These devices may be small or large and also quite simple or complicated. Distance measurement systems for such applications are available. These use various kinds of sensors and systems. Low cost and accuracy as well as speed are important in most of the applications. Hence ultrasonic sensors are most commonly used. To maintain the accuracy of measured distance the separation between transmitter and receiver is very important. In this paper, we describe the results of a study on the variation of error of measurement of distance of an object by varying the separation between the transmitter and receiver of the ultrasonic sensors by using microcontroller P89C51RD2. Ultrasound sensors are very versatile in distance measurement. They are also providing the cheapest solutions. Ultrasound waves are suitable both for air and underwater use [1].19International Journal of Computer science & Information Technology (IJCSIT), Vol 1, No 2, November 2009Ultrasonic sensors are also quite fast for most of the common applications. In simpler system a low cost version of 8- bit microcontroller can be used to implement the system to lower the cost. We are applying this system for sewer inspection system. Sewer blockages have become quite common. The blockages have become more frequent due to the dumping of polythene bags, hair and solid materials into the sewer system [2], [3]. There has been no work done in this direction. This is a new study which is useful to find out the optimal separation between ultrasonic transmitter and receiver to measure small distances.2. PRINCIPLEUltrasonic transducer uses the physical characteristics and various other effects of ultrasound of a specific frequency. It may transmit or receive the ultrasonic signal of a particular strength. These are available in piezoelectric or electromagnetic versions. The piezoelectric type is generally preferred due to its lower cost and simplicity to use [5]. The transmitter and receiver are available either as single unit or as separate units. The Ultrasonic wave propagation velocity in the air is approximately 340 m/s, the same as sonic velocity. To be precise, the ultrasound velocity is governed by the medium, and the velocity in the air is calculated using the formula given below (1). V= 340+0.6(t-15) m/s t:temperature, °C (1)In this study, we assumed the temperature to be 20°C, so the velocity of ultrasound in the air is 343 m/s. Because the travel distance is very short, the travel time is little affected by temperature. It takes approximately 29.15µsec for the ultrasound to propagate through 1cm, so it is possible to have 1cm resolution in the system [6].3. EXPERIMENTAL SETUPThe system consists of a transmitter and a receiver module controlled by a microcontroller P89C51RD2. We have used a microcontroller development kit for testing of the system. We are using 40Khz ultrasound sensors for our experiments. The Simplified block diagram of the system is shown in Fig.1. In Fig. 1, the interrupt1 signal initiates the system. When the interrupt1 signal is generated, MCU starts the timer1 to measure time and simultaneously generates the controlled 40Khz pulses having a train of specific number of pulses. These pulses are applied to the amplifier circuit and after amplification the ultrasound transmitter transmits the pulse train in the direction of the object. These ultrasonic pulses are reflected from the object and travels back in different directions. These reflected waves arrive at receiver. After amplification and processing it generates signal interrupt. This is applied as interrupt2 to the MCU. Interrupt2 stops the timer1, and MCU calculates the time elapsed between the generation of the wave and reception of the wave. This time is proportional to the distance travelled by the waves. Using the formula, MCU calculates the distance of the obstacle and display it or transfer it to the part of the total system where it is used for further control. Using this elapsed time, we calculate the distance of the object from the ultrasonic sensors.20International Journal of Computer science & Information Technology (IJCSIT), Vol 1, No 2, November 2009INT1 MCU Ultrasound Transmitter CircuitTINT2 Receiver Amplifier Display RFig 1: Block Diagram of the System4. EXPERIMENTAL RESULTSThe waveforms of the transmitted and received waveforms of the ultrasonic signal is stored in Digital Storage Oscilloscope. We have taken the readings for various separation between tranmitter and reciever. We have measured the distance in the interval of 5cm. For every measured distance three reading have been taken. The table shows the average of the three readings. The maesured distance is calculated on the basis of travelled time. The formula to calculate the distance is given below: Dist. (cm) = (Travelled Time*10-6 * 34300) / 2 (2)The ultrasonic waves travelled from the transmitter to the object and from the object back to the receiver hence the whole distance is divided by two. Values of %Error have also been calculated and shown. The error result shows that there is some error in recording the start and finish times in the system. When the distance increases the error is distributed in a larger distance and hence the %error decreases. We have taken the measurements for various separations of transmitter and receiver renging from 2cm to 15cm. The Table 1 shows the results when separation between tranmitter and reciever is 2cm. Table 1: Experimental Results (For 2cm Separation between Transmitter and Reciever) S.No . 1 2 3 4 5 6 7 8 9 10 Actual Distance(cm) 5 10 15 20 25 30 35 40 45 50 Travelled Time (µSec) 400 690 1050 1250 1650 1930 2180 2400 2700 3000 Measured Distance (cm) 6.86 11.83 18.01 21.44 28.30 33.10 37.39 41.16 46.31 51.45 % Error 37.20 18.34 20.05 7.19 13.19 10.33 6.82 2.90 2.90 2.90The result shows that the acuracy of measured distance is increses for longer distances. The %error becomes constant for measured distances above 40cm. The highest %error is occured in small distance of 5cm. It is also shown by Fig.2.21International Journal of Computer science & Information Technology (IJCSIT), Vol 1, No 2, November 2009Fig. 2: Graph of Actual Distance versus Measured Distance for 2cm Separation between Transmitter and Reciever. The Table 2 shows the result when separation between transmitter a reciever is 5cm. Table 2: Experimental Results for 5cm Separation between Transmitter and reciever) S.No. 1 2 3 4 5 6 7 8 9 10 Actual Distance(cm) 5 10 15 20 25 30 35 40 45 50 Travelled Time (µSec) 410 700 1000 1300 1600 1870 2220 2500 2780 3120 Measured Distance (cm) 7.03 12.01 17.15 22.30 27.44 32.07 38.07 42.88 47.68 53.51 % Error 40.63 20.05 14.33 11.48 9.76 6.90 8.78 7.19 5.95 7.02The resluts shows that the accuracy is incresed in camparison to the previous results. This is also shown by the Fig. 3.Fig. 3: Graph of Actual Distance versus Measured Distance when Separation between Transmitter and Reciever is 5 cm.22International Journal of Computer science & Information Technology (IJCSIT), Vol 1, No 2, November 2009The Table 3 shows the results when separation between transmitter and reciever is 10 cm. These results indicates that when we increase the separation between transmitter and receiver the %error increses for small measured distances. Table 3: Experimental Results for Separation of 10cm between Transmitter and reciever)S.No. 1 2 3 4 5 6 7 8 9 10Actual Distance(cm) 5 10 15 20 25 30 35 40 45 50Travelled Time (µSec) 620 750 1010 1310 1600 1870 2200 2400 2680 3000Measured Distance (cm) 10.63 12.86 17.32 22.47 27.44 32.07 37.73 41.16 45.96 51.45% Error 112.66 28.63 15.48 12.33 9.76 6.90 7.80 2.90 2.14 2.90Again the accuracy increases with the distance but the small distances are not so accurate. The error is high for small distances. It is also shown by the Fig. 4.Fig. 4: Graph of Actual Distance versus Measured Distance when Separation between Transmitter and Reciever is 10 cm. The Table 4 is showing the result of measured distance when 15cm separation between transmitter and reciever. These results shows that when we increase the separation between transmitter and receiver the %error increses. This increase is very high in small measured distances like 5cm in our experiment. The lowest %error observed for the measured distance of 45cm and again it is increasing for the measured distance of 50cm. The results shows that we have to stop the increament of seaparation between transmitter and receiver in our experiment.23International Journal of Computer science & Information Technology (IJCSIT), Vol 1, No 2, November 2009Table 4: Experimental Results for 15cm Separation between Transmitter and Reciever) S.No. 1 2 3 4 5 6 7 8 9 10 Actual Distance(cm) 5 10 15 20 25 30 35 40 45 50 Travelled Time (µSec) 1300 930 1180 1350 1620 1900 2200 2420 2700 3200 Measured Distance (cm) 22.30 15.95 20.24 23.15 27.78 32.59 37.73 41.50 46.31 54.88 % Error 345.90 59.50 34.91 15.76 11.13 8.62 7.80 3.76 2.90 9.76Again the error for the small distance say 5cm is very high. It is also showing that the graph between actual distance versus measured distance is not a straight line. This graph is shown in Fig. 5.Fig. 5: Graph of Actual Distance versus Measured Distance for 15cm Separation between Transmitter and Reciever. The graph between the measured distance the actual distance indicates that the measured distance is proportional to the actual distance.5. ANALYSIS OF THE RESULTSThe experimental results shows that the distance measured for different separations between transmitter and receiver are accurate for long distances e.g. more than 20cm. For small actual distances say 5cm, the small transmitter and receiver distances are better in comparison to the long distances between transmitter and receiver. If we place the transmitter and receiver at 15cm separation than the small distance like 5cm are not going to be measured correctly. Result shows the error of 345%. Hence we have to place the transmitter and receiver at proper distance like 5-10cm. For long distances the distance between transmitter and receiver has very low impact on the accuracy. We have compared the all measured distances for different separations between transmitter and receiver and the results are shown in the Table 5.24International Journal of Computer science & Information Technology (IJCSIT), Vol 1, No 2, November 2009Table 5: Comparison of Measured Distances for different Separations between Transmitter and Reciever Actual Dist. (cm) 5 10 15 20 25 30 35 40 45 50 Measured Distance (in cm) when Separation between Transmitter and Reciever is = 2cm 6.86 11.83 18.01 21.44 28.30 33.10 37.39 41.16 46.31 51.45 5cm 7.03 12.01 17.15 22.30 27.44 32.07 38.07 42.88 47.68 53.51 10cm 10.63 12.86 17.32 22.47 27.44 32.07 37.73 41.16 45.96 51.45 15cm 22.30 15.95 20.24 23.15 27.78 32.59 37.73 41.50 46.31 54.88S. No. 1 2 3 4 5 6 7 8 9 10As we can see in the table that small measured distance like 5cm is measured accurately when 2cm separation between transmitter and receiver. It has the lowest error. When we increase the distance to be measured, the accuracy of measured distance are high and it the highest for 10cm separation between transmitter and receiver. Hence for the range of 5cm to 50cm, as we taken in our experiments, the separation between transmitter and receiver are 2cm to 10cm. If we increase this than the error percentage also increases. The Fig.6 shows the graph between actual distance and the different measured distances for various separations between transmitter and receiver.Fig. 6: Graph for Comparison of Measured Distances for different Separations between Transmitter and Reciever This graph is also showing that the graph plotting of measured distance when separation between transmitter and receiver is 2cm, 5cm and 10cm is almost on the same points. The graph plotting when 15cm separation between transmitter and receiver, is not very encouraging for this range of 5cm to 50cm.25International Journal of Computer science & Information Technology (IJCSIT), Vol 1, No 2, November 20096. CONCLUSIONSWe have done the experiments on our ultrasonic measurement system for the various separations between transmitter and receiver and the result shows that the measured distance is satisfactory for our study. When the distance increases the error becomes constant and very less. A correction may be applied to calculate the correct distance. Interrupt1 initiates the system and interrupt2 stops the timer and on the basis of the travelled time distance calculated. In future, the whole system will be mounted on the one PCB. This study shows that for small distances the separation between transmitter and receiver should be 5cm to 10cm. Hence this study will help in fixing the separation between transmitter and receiver in the robotic vehicle for blockage detection so we are able to calculate the more accurate distance of the blockage in the sewage filled sewer lines. Hence we can prevent human labour to go in the sewage filled sewer lines to detect the blockage which are very dangerous to the human as they contain the poisonous gases.ACKNOWLEDGMENTThis work is supported by MP Council of Science and Technology (MPCST), Bhopal, Project Code No. R&D/PHYSICS.23/08-09-1.REFERENCES[1] J. David and N cheeke “Fundamentals of Ultrasonic Waves” CRC Press, Florida, USA, 2002, ISBN 0-8493-0130-0. [2] Singh SP, Verma Ashish, Shrivastava AK “Design and Development of Robotic Sewer Inspection Equipment Controlled by Embedded Systems” Proceedings of the First IEEE International Conference on Emerging Trends in Engineering and Technology, July 16-18, 2008, Nagpur, India pp. 1317-1320. [3] Shrivastava AK, Verma Ashish, Singh SP “Partial Automation of the Current Sewer Cleaning System”, Invertis Journal of Science and Technology, Vol.1, No.4, 2008, pp 261-265. [4] O. Duran, K.Althoefer, and L Seneviratene, “State of the Art in Sensor Technologies for Sewer Inspection”, IEEE Sensors Journal, April 2002, Vol. 2, N.2, pp 63. [5] Hongjiang He, Jianyi Liu, “The Design of Ultrasonic Distance Measurement System Based on S3C2410” Proceedings of the 2008 IEEE International Conference on Intelligent Computation Technology and Automation, 20-22 Oct, 2008, pp. 44-47. [6] Yongwon Jang, Seungchul Shin, Jeong Won Lee, and Seunghwan Kim, “A Preliminary Study for Portable Walking Distance Measurement System Using Ultrasoinc Sensors” Proceedings of the 29th Annual International Conference of the IEEE EMBS Cité Internationale Lyon, France, Aug 23-26, 2007, pp. 5290-5293.26International Journal of Computer science & Information Technology (IJCSIT), Vol 1, No 2, November 2009AuthorsAjay Kumar Shrivastava was born at Guna (M.P.), India on 7th August, 1977. He had done his graduation in Electronics from Dr. H.S.Gour University, Sagar (M.P.), India in 1998. After that he had completed his MCA from the same university in 2002. He has more than seven years of teaching experience. He had worked as Lecturer in Technocrats Institute of Technology, Bhopal (M.P.), India for three years. Presently he is working as Associate Professor in Krishna Institute of Engineering and Technology, Ghaziabad (U.P.), India from Aug. 2005. His research interests include Embedded Systems and Data Mining. Mr. Shrivastava is the life member of Computer Society of India (CSI). He is also life member of Association of Computer, Electronics and Electrical Engineers (ACEEE) and International Association of Computer Science and Information Technology (IACSIT) and International Association of Engineers (IAENG). He is also the member of Computer Science Teachers Association (CSTA). He is also reviewer of various ACEEE organized conferences. He has published a paper in National Journal and published/presented four papers in conferences.Dr. Ashish Verma was born on 23rd March 1963. He received the M.Sc. degree in Physics with specialization in Electronics and solidstate physics in1984 and Ph.D. degree in Physics in 1991 from Dr. Hari Singh Gour Central University, Sagar, (M.P.), India. He has having 24 years of teaching (UG/PG) and research experience and is currently working as a Senior Lecturer in the department of Physics and Electronics, Dr. Hari Singh Gour Central University, Sagar. He has guided about 150 students (UG/PG) for their projects in the field of Electronics and Physics. He guided 4 Ph.D. students (One as Co-Supervisor). Presently, he is guiding 8 Ph.D. students for their innovative research. He is supervising 3 Ph.D. students in Physics and Electronics of M.P. BHOJ (Open) University, Bhopal, (M.P.), India. He had published a book entitled “Microprocessor”, Vishwavidyalaya Prakashan, Sagar (M.P.), India and written two chapters in “Bhotiki”, Madhya Pradesh Hindi Granth Academy, Bhopal (M.P.), India. Dr. Verma published / presented about 50 research papers in the National /International Journals / Conferences of high repute. He is the Executive Council (Government Nominee) in Government Girls Autonomous College, Sagar, (M.P.). He had worked in various committees of the university. Prof. S.P.Singh was born at village Manirampur in Nalanda district, Bihar, India on 10th June 1939. He did his schooling and intermediate studies at Patna. He completed his B.Sc.(Engg.) degree in Electrical Engineering from National Institute of Technology, Jamshedpur, India in the year 1964. He did M.Tech. in Electrical Engineering (Electronic Devices and Circuits) from Indian Institute of Technology, Kanpur, India in 1975. He obtained his Ph.D. degree from Ranchi University, Ranchi, India in the year 1993. His topic was microprocessor based speed control of induction motors.27International Journal of Computer science & Information Technology (IJCSIT), Vol 1, No 2, November 2009He joined N.I.T., Jamshedpur, India as Lecturer in Electrical Engineering in 1964 continued there as lecturer, AP and Professor till 1999. He started teaching electronic subjects and shifted to electronics engineering. After retirement from NIT in 1999, he continued to work as professor in institutes around Delhi. Currently, he is working as professor in Electronics & Communication Engineering at Noida Institute of Engineering and Technology, Greater Noida, U.P., India. Prof. Singh was a member of IEEE from 1974 to 1991. At present Dr. Singh is a fellow of I.E.T.E., India.28。
数字示波器外文翻译文献(文档含中英文对照即英文原文和中文翻译)原文:Design and FPGA implementation of a wireless hyperchaotic communication system for secure real-time image transmission AbstractIn this paper, we propose and demonstrate experimentally a new wireless digital encryption hyperchaotic communication system based on radio frequency (RF) communication protocols for secure real-time data or image transmission. A reconfigurable hardware architecture is developed to ensure the interconnection between two field programmable gate array developmentplatforms through XBee RF modules. To ensure the synchronization and encryption of data between the transmitter and the receiver, a feedback masking hyperchaotic synchronization technique based on a dynamic feedback modulation has been implemented to digitally synchronize the encrypter hyperchaotic systems. The obtained experimental results show the relevance of the idea of combining XBee (Zigbee or Wireless Fidelity) protocol, known for its high noise immunity, to secure hyperchaotic communications. In fact, we have recovered the information data or image correctly after real-time encrypted data or image transmission tests at a maximum distance (indoor range) of more than 30 m and with maximum digital modulation rate of 625,000 baud allowing a wireless encrypted video transmission rate of 25 images per second with a spatial resolution of 128 ×128 pixels. The obtained performance of the communication system is suitable for secure data or image transmissions in wireless sensor networks.IntroductionOver the past decades, the confidentiality of multimedia communications such as audio, images, and video has become increasingly important since communications of digital products over the network (wired/wireless) occur more frequently. Therefore, the need for secure data and transmission is increasing dramatically and defined by the required levels of security depending on the purpose of communication. To meet these requirements, a wide variety of cryptographic algorithms have been proposed. In this context, the main challenge of stream cipher cryptography relates to the generation of long unpredictable key sequences. More precisely, the sequence has to be random, its period must be large, and the various patterns of a given length must be uniformly distributed over the sequence. Traditional ciphers like DES, 3DES, IDEA, RSA, or AES are less efficient for real-time secure multimedia data encryption systems and exhibit some drawbacks and weakness in the high streamdata encryption. Indeed, the increase and availability of a high-power computation machine allow a force brute attack against these ciphers. Moreover, for some applications which require a high-levelcomputation and where a large computational time and high computing power are needed (for example, encryption of large digital images), these cryptosystems suffer from low-level efficiency. Consequently, these encryption schemes are not suitable for many high-speed applications due to their slow speed in real-time processing and some other issues such as in the handling of various data formatting. Over the recent years, considerable researches have been taken to develop new chaotic or hyperchaotic systems and for their promising applications in real-time encryption and communication. In fact, it has been shown that chaotic systems are good candidates for designing cryptosystems with desired properties. The most prominent is sensitivity dependence on initial conditions and system parameters, and unpredictable trajectories.Furthermore, chaos-based and other dynamical systembased algorithms have many important properties such as the pseudorandom properties, ergodicity and nonperiodicity. These properties meet some requirements such as sensitivity to keys, diffusion, and mixing in the cryptographic context. Therefore, chaotic dynamics is expected to provide a fast and easy way for building superior performance cryptosystems, and the properties of chaotic maps such as sensitivity to initial conditions and random-like behavior have attracted the attention to develop data encryption algorithms suitable for secure multimedia communications. Until recently, chaotic communication has been a subject of major interest in the field of wireless communications. Many techniques based on chaos have been proposed such as additive chaos masking (ACM), where the analog message signal is added to the output of the chaos generator within the transmitter. In, chaos shift keying is used where the binary message signal selects the carrier signal from two or more different chaotic attractors. Authors use chaotic modulation where the message information modulates a parameter of the chaotic generator. Chaos control methods rely on the fact that small perturbations cause the symbolic dynamics of a chaotic system to track a prescribed symbol sequence. In, the receiver system is designed in an inverse manner to ensure the recovery of theencryption signal. An impulsive synchronization scheme is employed to synchronize chaotic transmitters and receivers. However, all of these techniques do not provide a real and practical solution to the challenging issue of chaotic communication which is based on extreme sensitivity of chaotic synchronization to both the additive channel noise and parameter mismatches. Precisely, since chaos is sensitive to small variations of its initial conditions and parameters, it is very difficult to synchronize two chaotic systems in a communication scheme. Some proposed synchronization techniques have improved the robustness to parameter mismatches as reported in, where impulsive chaotic synchronization and an open-loop-closed-loopbased coupling scheme are proposed, respectively. Other authors proposed to improve the robustness of chaotic synchronization to channel noise, where a coupled lattice instead of coupled single maps is used to decrease the master-slave synchronization error. In, symbolic dynamics-based noise reduction and coding are proposed. Some research into equalization algorithms for chaotic communication systems are also proposed. For other related results in the literature, see. However, none of them were tested through a real channel under real transmission conditions. Digital synchronization can overcome the failed attempts to realize experimentally a performed chaotic communication system. In particular, when techniques exhibit any difference between the master/transmitter and slave/receiver systems, it is due to additive information or noise channel (disturbed chaotic dynamics) which breaks the symmetry between the two systems, leading to an accurate non-recovery of the transmitted information signal at the receiver. In, an original solution to the hard problem of chaotic synchronization high sensibility to channel noise has been proposed. This solution, based on a controlled digital regenerated chaotic signal at the receiver, has been tested and validated experimentally in a real channel noise environment through a realized wireless digital chaotic communication system based on zonal intercommunication global-standard, where battery life was long, which was economical to deploy and which exhibited efficient use of resources, knownas the ZigBee protocol. However, this synchronization technique becomes sensible to high channel noise from a higher transmission rate of 115 kbps, limiting the use of the ZigBee and Wireless Fidelity (Wi-Fi) protocols which permit wireless transmissions up to 250 kbps and 65 Mbps, respectively.Consequently, no reliable commercial chaos-based communication system is used to date to the best of our knowledge. Therefore, there are still plentiful issues to be resolved before chaos-based systems can be put into practical use. To overcome these drawbacks, we propose in this paper a digital feedback hyperchaotic synchronization and suggest the use of advanced wireless communication technologies, characterized by high noise immunity, to exploit digital hyperchaotic modulation advantages for robust secure data transmissions. In this context, as results of the rapid growth of communication technologies, in terms of reliability and resistance to channel noise, an interesting communication protocol for wireless personal area networks (WPANs, i.e., ZigBee or ZigBee Pro Low-Rate-WPAN protocols) and wireless local area network (WLAN, i.e., Wi-Fi protocol WLAN) is developed. These protocols are identified by the IEEE 802.15.4 and IEEE 802.11 standards and known under the name ZigBee and Wi-Fi communication protocols, respectively. These protocols are designed to communicate data through hostile Radio Frequency (RF) environments and to provide an easy-to-use wireless data solution characterized by secure, low-power, and reliable wireless network architectures. These properties are very attractive for resolving the problems of chaotic communications especially the high noise immunity property. Hence, our idea is to associate chaotic communication with theWLAN or WPAN communication protocols. However, this association needs a numerical generation of the chaotic behavior since the XBee protocol is based on digital communications.In the hardware area, advanced modern digital signal processing devices, such as field programmable gate array (FPGA), have been widely used to generate numerically the chaotic dynamics or the encryption keys. The advantage of these techniques is that the parameter mismatch problem does not existcontrary to the analog techniques. In addition, they offer a large possible integration of chaotic systems in the most recent digital communication technologies such as the ZigBee communication protocol. In this paper, a wireless hyperchaotic communication system based on dynamic feedback modulation and RF XBee protocols is investigated and realized experimentally. The transmitter and the receiver are implemented separately on two Xilinx Virtex-II Pro circuits and connected with the XBee RF module based on the Wi-Fi or ZigBee protocols. To ensure and maintain this connection, we have developed a VHSIC (very high speed integrated circuit) hardware description language (VHDL)-based hardware architecture to adapt the implemented hyperchaotic generators, at the transmitter and receiver, to the XBee communication protocol. Note that the XBee modules interface to a host device through a logic-level asynchronous serial port. Through its serial port, the module can communicate with any logic and voltage-compatible Universal Asynchronous Receiver/Transmitter (UART). The used hyperchaotic generator is the well-known and the most investigated hyperchaotic Lorenz system. This hyperchaotic key generator is implemented on FPGA technology using an extension of the technique developed in for three-dimensional (3D) chaotic systems. This technique is optimal since it uses directly VHDL description of a numerical resolution method of continuous chaotic system models. A number of transmission tests are carried out for different distances between the transmitter and receiver. The real-time results obtained validate the proposed hardware architecture. Furthermore, it demonstrates the efficiency of the proposed solution consisting on the association of wireless protocols to hyperchaotic modulation in order to build a reliable digital encrypted data or image hyperchaotic communication system.Hyperchaotic synchronization and encryption techniqueContrary to a trigger-based slave/receiver chaotic synchronization by the transmitted chaotic masking signal, which limits the performance of the rate synchronization transmission, we propose a digital feedback hyperchaoticsynchronization (FHS). More precisely, we investigate a new scheme for the secured transmission of information based on master-slave synchronization of hyperchaotic systems, using unknown input observers. The proposed digital communication system is based on the FHS through a dynamic feedback modulation (DFM) technique between two Lorenz hyperchaotic generators. This technique is an extension and improvement of the one developed in for synchronizing two 3D continuous chaotic systems in the case of a wired connection.The proposed digital feedback communication scheme synchronizes the master/transmitter and the slave/receiver by the injection of the transmitted masking signal in the hyperchaotic dynamics of the slave/receiver. The basic idea of the FHS is to transmit a hyperchaotic drive signal S(t) after additive masking with a hyperchaotic signal x(t) of the master (transmitter) system (x , y , z ,w ). Hyperchaotic drive signal is then injected both in the three subsystems (y , z ,w ) and (r r r w z y ,,). The subscript r represents the slave or receiver system (r r r r w z y x ,,,). At the receiver, the slave system regenerates the chaotic signal )(t x r and a synchronization is obtained between two trajectories x(t) and )(t x r if()()0||lim =-∞→t X t X r t (1) This technique can be applied to chaotic modulation. In our case, it is used for generating hyperchaotic keys for stream cipher communications, where the synchronization between the encrypter and the decrypter is very important. Therefore, at the transmitter, the transmitted signal after the additive hyperchaos masking (digital modulation) isS(t) = x(t) + d(t). (2)where d(t) is the information signal and x(t) is the hyperchaotic carrier. At the receiver, after synchronization of the regenerated hyperchaotic signal )(t x rwith the received signal )(t S r and the demodulation operation, we can recover the information signal d(t) correctly as follows:)()()(t x t S t d r r -=. (3)Therefore, the slave/receiver will generate a hyperchaotic behavior identical to that of the master/transmitter allowing to recover correctly the information signal after the demodulation operation. The advantageof this technique is that the information signal d(t) doesnot perturb the hyperchaotic generator dynamics, contraryto the ACM-based techniques of and, because d(t) is injected at both the master/transmitter and slave/receiver after the additive hyperchaotic masking. Thus, for small values of information magnitude, the information will be recovered correctly. It should be noted that we have already confirmed this advantage by testing experimentally the HS-DFM technique performances for synchronizing hyperchaotic systems (four-dimensional (4D) continuous chaotic systems) in the case of wired connection between two Virtex-II Pro development platforms. After many experimental tests and from the obtained real-time results, we concluded that the HS-DFM is very suitable for wired digital chaotic communication systems. However, in the present work, one of the objectives is to test and study the performances of the HS-DFM technique in the presence of channel noise through real-time wireless communication tests. To performthe proposed approach, a digital implementation of the master and slave hyperchaotic systems is required. Therefore, we investigate the hardware implementation of the proposed FHS-DFM technique between two Lorenz hyperchaotic generators using FPGA. To achieve this objective, we propose the following details of the proposed architecture.译文:无线超混沌通信系统安全的实时图像传输的设计和FPGA实现摘要在本文中,我们提出并论证了一种基于无线电频率通信协议对数据或图像安全实时传输的新的无线数字超混沌加密通信系统。
附录CLiquidLevelMeasurementChemical industry with the progress of science and technology got rapid development, in order to make the equipment safe and reliable operation, and can be utmost to improve product quantity and quality, to effectively operate automatically and process adjustment, realize the scientific management for the enterprise to provide the necessary material and energy of accurate data, must be in production in the process of pressure, flow, level, temperature, chemical composition of various parameters such as timely, accurate measurement.Generally the process of containers, tanks, towers, tank of liquid surface position level, slot bucket, cans, and warehouse ChuFa solid block, the accumulation of particles, powder height and surface position is called a material level; Two not fluid boundary between the height and the liquid and solid separation height is called interface position, the position of assembly level, material level, liquid level interface.Material level measurement to correctly measure the container storage capacity or quality, know container level of high and low and adjust at any time, in the material level to maintain the required height.Material level measurement in chemical process, not only under normal temperature, atmospheric pressure and ordinary medium, material level, liquid level measurement of the interface, but also often meet high temperature, low temperature, high pressure, inflammable and explosive (negative temperature). Viscosity and foam, boiling dielectric material level measurement problems.In order to adapt to the characteristics of chemical objects, to meet the requirements of the chemical process material level measurement, there are many material level measurement and instrumentation.1. Ultrasonic liquid level meter and radar material level meter(1) ultrasonic liquid level meterMaterial level measurement process, the ultrasonic signal, issued by the ultrasonic probe, the liquid or solid material surface after launch back, by the same sensor receiving, ultrasonic measurement of the whole running time, so as to realize the measurement of material level,acoustic velocity transmission of the ultrasonic pulse, from transmitting to receiving to ultrasonic pulse need time interval and the transducer to the surface of the measured medium is proportional to the distance.Emit ultrasonic level meter pulse, not the echo of detection at the same time. Due to the launch of the ultrasonic pulse width has a certain time, and after launch the ultrasonic sensor and aftershocks, during cannot detect the echo, so from the start down the surface of the probe a short distance can't normal inspection, this distance is called blind spots. Was the highest level such as into the blind area, detect instrument will not be able to correctly, there will be error, if necessary, heightened level meter can be installed.Ultrasonic liquid level meter also has shortcomings, the ultrasonic transmission by gas interference, level surface bubbles, corrugated, etc, the ultrasonic transmission by gas interference, level surface bubbles, corrugated, etc., the ultrasonic reflection effect. Material is volatile, liquid gas entrapment, the container by vibration (e.g., motors) are installed on the container can't use ultrasonic liquid level meter.(2) radar material level meterRadar level gauge USES launch - reflection - receive work mode. Radar level meter antenna emit electromagnetic wave, the wave reflected by the measured object surface, again by the antenna, the electromagnetic wave from transmitting to receiving time is proportional to the distance to the liquid surface. In practice, there are two kinds of radar level gauge means the frequency modulation continuous wave and pulse wave. Liquid level meter adopts frequency modulation wave technology, power consumption is big, the four wire system, should be used in electronic circuit is complicated. And the radar pulse wave technology level gauge, low power consumption, easy to implement essential safety, high precision, wider application scope.Radar level gauge measuring the electromagnetic waves can pass through a vacuum, don't need a transmission medium, is not affected by air, steam, groove volatile fog effect, can be used for such as coarse benzene volatile medium level measurement.Radar level meter can be used for almost all of the liquid level measurement. Electromagnetic wave on the surface level when firing, signal attenuation, when the signal attenuation through the hours, can lead to radar level meter cannot detect enough electromagnetic wave signal, the conductive medium can be a very good reflection ofelectromagnetic wave, the dielectric constant is greater than 1.5 non conductive medium dielectric constant was 1.0 (air) will also be able to guarantee sufficient reflection wave, dielectric constant, the greater the reflection signal. In practice, almost all medium can reflect enough of reflection wave.(3) radar level gauge, ultrasonic liquid level meterUltrasound and radar is the main measuring principle is different, lead to their different application occasions, radar is given that the dielectric constant of the measured substance, which is given that the density of the material being measured, so the low dielectric constant material radar measurements will be effect to sell at a discount greatly, the solid matter in general, push harder, another wave of different means of transmission components, such as ultrasonic wave was launched by the vibration of the piezoelectric material, so it is can be used in higher pressure or negative pressure of the situation, usually only in the atmospheric pressure containers. The radar can be used in the process of high pressure tank. Radar emission Angle is bigger than ultrasound, small containers or elongated don't recommend using non-contact radar, generally recommend a director radar. Finally is the temperature on the accuracy, of course, must be higher than the ultrasonic, radar must use high resolution radar in the tank, without ultrasonic. As for the price, usually ultrasonic, lower than the radar in a wide range of course some ultrasonic price is also high. Such as the range of 6-70 meters, the preferred ultrasonic liquid level meter. Pay attention to the stirring groove, groove wall adhesion can produce interference of the reflected wave, level measurement, the installation is to choose the appropriate installation position, so as to avoid the interference of these factors.Level two categories, including liquid level and material level. Liquid level and liquid level indicator and two continuous level measurement. Liquid level indicator is the level of several fixed position measuring, used in liquid level of upper and lower limit alarm, etc. Continuous level measurement is to measure liquid level continuously, it is widely used in many fields such as petroleum, chemical industry, food processing, have very important significance. For more than 20 kinds of continuous level measurement method for comparative analysis. Glass tube, glass plate, double color water method.Manual gauging glass tube method: this method is using the principle of communicating vessels, level scale read directly from the instructions. Glass plate method: glass which can beinstalled through connectors can also be installed in the container wall openings, and series a few piece of glass to increase the range. Numerical scale read directly from the glass plate level.Double color gauge method: this method using the optical principle, make water shows green, and make the water vapor shows red, which indicate the water level.Artificial gauging method: the method is used for measuring oil tank liquid level. When measuring, the surveyor gauge Surveyor to volume of the oil dipstick into oil, and filed when feet lead contact with the tank bottom oil dipstick. According to the quantity of oil traces on the oil dipstick, read out the oil level height; End according to the quantity of oil dipstick test cream color change to determine the height of the water cushion layer, to determine high oil and high water above 4 methods are artificial measurement method, measurement is simple, the advantages of high reliability, intuitive, and low cost.Blowing method, differential method, HTG blowing method: because of the blow pipe approximation is equal to the fluid column pressure in the static pressure, thus P = rho gH type of rho - liquid density; H - level. So the liquid level is measured by the static pressure P can be H. Strong method suitable for measuring the corrosive gas blowing, have suspended material content in the liquid, and is mainly used in the measurement accuracy is not high.Differential pressure method: the open container or atmospheric vessels, valves and gas phase pressure pipeline saves. Based on the relationship between differential pressure and liquid level Δ P = P2 - P1 = rho gH type: Δ P - positive and negative pressure chamber pressure transmitter; P2 and P1 - led tube pressure; H - level. Differential pressure transmitter will pressure difference transformation for 4 ~ 20 mA dc signal. If the pressure in the measuring range lower limit of the corresponding output signal is greater than or less than 4 mA, are all need to adjust the migration zero migration technology such as spring, is equal to 4 mA. HTG method: this method is applied to differential pressure oil tank liquid level measurement.Buoy method: this method USES the middle maglev barrel with holes as liquid level sensor. Stainless steel casing from buoy hole through the middle, between fixed to the roof and bottom. Liquid level change driven maglev hollow tube (permanent magnet) hides inside can move up and down the casing, and attract the casing of magnet can move up and down the casing wall, secondary instrument | instrument according to the moving magnet volume to calculate the liquid level.Floating ball method: this method is using the lever principle of work. Floating ball with liquid level change and around the axis of rotation, the pointer on the drive shaft rotation, and at the other end of the lever balance weight balance, at the same time indicates the level value on the dial. Floating ball method have ball float within and outside the floating ball type two kinds. Floating ball method is mainly used for high temperature measurement, the viscosity of the liquid level, but the range is smaller.Servo method: this method USES volatile integral circuit, eliminate jitter, prolong life, improve the precision of level measurement. The modern servo liquid meter measuring accuracy is higher, has 40 m range less than the accuracy of 1 mm, and generally has the function of measuring density distribution and average density.Sinking method: the location of the sinking as the change of liquid level change, but the variation is not equal and level variation. Torque tube sinking method: the torque tube core shaft torsional Angle changes, secondary instrument according to the torsional Angle variation to calculate the liquid level above five kinds of methods are using the buoyancy principle to work.Such as R, R, l, is a fixed value, as long as the use of epsilon 1, epsilon 2, CH can calculate the liquid level H. Measurement of conductive liquid capacitance method principle, the formula is slightly. Capacitive liquid level meter price is low, easy to install and can be applied to occasions of high temperature and high pressure. Capacitive liquid level instrument measurements but repetitive accuracy is low, need regular maintenance and calibration again, working life is not very long.This method is especially suitable for the measurement of conductive liquid, sensitive device resistance characteristics, its resistance along with the change of liquid level change, so the resistance value is transmitted to the secondary circuit level. Electrical parameters of the liquid level sensor method to measure the liquid level changes.Magnetostrictive method, ultrasonic method, modulating optical method, microwave method Magnetostrictive method: the method is used for measuring oil tank liquid level has two float, respectively used to detect oil and gas and oil/water interface. Each float in possession of a set of permanent magnets, used to generate a fixed magnetic field. Measurement, level gauge head emit low "enquiry" pulse current, the magnetic field generated from the current conduction down the waveguide. When electric current magnetic field is met, and float a "return" impulse(also called "waveguide distortion" pulse). Ask pulse and the back pulse time lag between the corresponding to the height of the oil-water interface and the interface of oil and gas. Easy to install, magnetostrictive liquid level meter measuring accuracy is high, but the liquid density and temperature changes can lead to a measurement error, float along the outside of the waveguide tube move up and down, are easy to be jammed.Ultrasonic method: antenna (mostly aperture antenna, also has a planar antenna) radiation, after liquid surface reflection is the antenna, and then calculated by the secondary circuit, transmitting and receiving signals of liquid level difference. The liquid level meter adopts triangle wave form of frequency modulation, and through to the transmitting and receiving signal mixing after get the difference between the signal analysis, microwave transmission time, thus calculate the liquid level. Microwave speed by the transmission medium, the influence of temperature, pressure, liquid dielectric constant is small, but the liquid interface fluctuations, on the surface of the dielectric constant of bubbles, liquid medium has a great influence on the microwave reflection signal strength. When the pressure in excess of the prescribed value, the pressure will have a significant impact on level measurement accuracy. For liquid dielectric constant is less than the stipulated value, most of the radar level gauge need to adopt waveguide, but rust, bend waveguide and tilt will affect the accuracy of measurement. Sky high h, for example, to 20 m, guided wave tube and vertical direction Angle alpha just over 0.573 °, is caused by the liquid level Δ h will be more than 1 mm error, thus proved that the tilted Angle alpha (in degrees) is small, Δ h meet:Radar level gauge is particularly suited to high pollution and high viscosity of the product, such as asphalt, etc. Repeat accuracy of radar level gauge measuring is higher, need regular maintenance and calibration, measurement accuracy is higher, but the price is higher, difficult measurement of oil-water interface.Modulating optical method and microwave method is similar, only by phase or frequency modulation of optical signal instead of microwave signal. But light signals are greatly influenced by steam, oil, steam, and the liquid level fluctuation is very sensitive。
毕业设计论文外文文献翻译超声波测距中英文对照The Circuit Design of UltrasonicRanging System超声波测距系统的电路设计Ultrasonic Distance Meter超声波测距仪姓名:专业: 测控技术与仪器学号: 2007071071指导教师姓名,职称,:The Circuit Design of Ultrasonic Ranging SystemThis article described the three directions (before, left, right) ultrasonic ranging system is to understand the front of the robot, left and right environment to provide a movement away from the information. (Similar to GPS Positioning System)A principle of ultrasonic distance measurement1, the principle of piezoelectric ultrasonic generatorPiezoelectric ultrasonic generator is the use of piezoelectriccrystal resonators to work. Ultrasonic generator, the internal structure as shown in Figure 1, it has two piezoelectric chip and a resonance plate. When it's two plus pulse signal, the frequency equal to the intrinsic piezoelectric oscillation frequency chip, the chip will happen piezoelectric resonance, and promote the development of plate vibrationresonance, ultrasound is generated. Conversely, if the two are notinter-electrode voltage, when the board received ultrasonic resonance,it will be for vibration suppression of piezoelectric chip, the mechanical energy is converted to electrical signals, then it becomes the ultrasonic receiver.2, the principle of ultrasonic distance measurementUltrasonic transmitter in a direction to launch ultrasound, in the moment to launch the beginning of time at the same time, the spread of ultrasound in the air, obstacles on his way to return immediately, the ultrasonic reflected wave received by the receiver immediately stop the clock. Ultrasound in the air as the propagation velocity of 340m / s, according to the timer records the time t, we can calculate the distance between the launch distance barrier (s), that is: s = 340t / 2 Ultrasonic Ranging System for the Second Circuit DesignSystem is characterized by single-chip microcomputer to control the use of ultrasonic transmitter and ultrasonic receiver since the launch from time to time, single-chip selection of 8751, economic-to-use, and the chip has 4K of ROM, to facilitate programming. Circuit schematic diagram shown in Figure 2. Draw only the front range of the circuit wiring diagram, left and right in front of Ranging circuits and the same circuit, it is omitted.1,40 kHz ultrasonic pulse generated with the launchRanging system using the ultrasonic sensor of piezoelectric ceramic sensors UCM40, its operating voltage of the pulse signal is 40kHz, whichby the single-chip implementation of the following procedures to generate.puzel: mov 14h, # 12h; ultrasonic firing continued 200mshere: cpl p1.0; output 40kHz square wavenop;nop;nop;djnz 14h, here;retRanging in front of single-chip termination circuit P1.0 input port, single chip implementation of the above procedure, the P1.0 port in a40kHz pulse output signal, after amplification transistor T, the drive to launch the first ultrasonic UCM40T, issued 40kHz ultrasonic pulse, and the continued launch of 200ms. Ranging the right and the left side of the circuit, respectively, then input port P1.1 and P1.2, the working principle and circuit in front of the same location.2, reception and processing of ultrasonicUsed to receive the first launch of the first pair UCM40R, the ultrasonic pulse modulation signal into an alternating voltage, the op-amp amplification IC1A and after polarization IC1B to IC2. IC2 is locked loop with audio decoder chip LM567, internal voltage-controlledoscillator center frequency of f0 = 1/1.1R8C3, capacitor C4 determine their target bandwidth. R8-conditioning in the launch of the carrier frequency on the LM567 input signal is greater than 25mV, the outputfrom the high jump 8 feet into a low-level, as interrupt request signals to the single-chip processing.Ranging in front of single-chip termination circuit output port INT0 interrupt the highest priority, right or left location of the output circuit with output gate IC3A access INT1 port single-chip, whilesingle-chip P1.3 and P1. 4 received input IC3A, interrupted by the process to identify the source of inquiry to deal with, interruptpriority level for the first left right after. Part of the source codeis as follows:receive1: push pswpush accclr ex1; related external interrupt 1jnb p1.1, right; P1.1 pin to 0, ranging from right to interrupt service routine circuitjnb p1.2, left; P1.2 pin to 0, to the left ranging circuit interrupt service routinereturn: SETB EX1; open external interrupt 1pop accpop pswretiright: ...; right location entrance circuit interrupt serviceroutineAjmp Returnleft: ...; left Ranging entrance circuit interrupt service routineAjmp Return4, the calculation of ultrasonic propagation timeWhen you start firing at the same time start the single-chipcircuitry within the timer T0, the use of timer counting function records the time and the launch of ultrasonic reflected wave received time. When you receive the ultrasonic reflected wave, the receivercircuit outputs a negative jump in the end of INT0 or INT1 interrupt request generates a signal, single-chip microcomputer in response to external interrupt request, the implementation of the external interrupt service subroutine, read the time difference, calculating the distance . Some of its source code is as follows:RECEIVE0: PUSH PSWPUSH ACCCLR EX0; related external interrupt 0MOV R7, TH0; read the time valueMOV R6, TL0?CLR CMOV A, R6SUBB A, # 0BBH; calculate the time differenceMOV 31H, A; storage resultsMOV A, R7SUBB A, # 3CHMOV 30H, ASETB EX0; open external interrupt 0POP ACCPOP PSWRETIFourth, the ultrasonic ranging system software designSoftware is divided into two parts, the main program and interrupt service routine, shown in Figure 3 (a) (b) (c) below. Completion of the work of the main program is initialized, each sequence of ultrasonic transmitting and receiving control.Interrupt service routines from time to time to complete three ofthe rotation direction of ultrasonic launch, the main external interrupt service subroutine to read the value of completion time, distance calculation, the results of the output and so on.V. CONCLUSIONSRequired measuring range of 30cm ~ 200cm objects inside the plane to do a number of measurements found that the maximum error is 0.5cm, and good reproducibility. Single-chip design can be seen on the ultrasonic ranging system has a hardware structure is simple, reliable, small features such as measurement error. Therefore, it can be used not only for mobile robot can be used in other detection systems.Thoughts: As for why the receiver do not have the transistoramplifier circuit, because the magnification well, CX20106 integrated amplifier, but also with automatic gain control level, magnification to 76dB, the center frequency is 38k to 40k, is exactly resonant ultrasonic sensors frequency.超声波测距系统的电路设计本文所介绍的三方向(前、左、右)超声波测距系统,就是为机器人了解其前方、左侧和右侧的环境而提供一个运动距离信息。
英文原文:Ultrasonic distance sensorDesign Principles:Ultrasonic sensor is developed from the use of the characteristics of ultrasonic sensors.Higher frequency ultrasound is a mechanical acoustic waves, the transducer excitation voltage of the chip occurs in the vibration, and it has a high frequency, short wavelength, diffraction is small, especially the direction of good, to be the ray and the orientationcommunication and so on.Ultrasound on liquids and solids through a great ability, especially in opaque solids in the sun, which can penetrate tens of meters in depth.Ultrasonic impurities or sub-interface will encounter a significant reflection reflection into the echo formation, hit moving objects can produce the Doppler effect.Therefore widely used in industrial ultrasonic inspection, defense, biomedical and other aspects of the ultrasound as a means of detection, must generate and receive ultrasound ultrasound.To fulfill this function the device is ultrasonic sensors, traditionally known as the ultrasonic transducer or ultrasonic probe.The main performance indicators of ultrasonic sensors:Ultrasound probe is the core of its plastic jacket or a piece of metal in the piezoelectric jacket.Constitute the chip can have many kinds of materials.Chip size, such as diameter and thickness also vary, so the performance of each probe is different, we used to know it in advance before the performance.The main performance indicators of ultrasonic sensors include: (1) operating frequency.Frequency is the resonant frequency of the piezoelectric wafer.When added to the AC voltage across it, and the frequency of the resonant frequency of the chip are equal, the maximum energy output, sensitivity is highest.(2) operating temperature.Since the Curie point of piezoelectric materials generally high, particularly when using the power of diagnostic ultrasound probe small, so the temperature is relatively low, you can work long hours without producing failure.Medical ultrasound probe temperature is relatively high, requiring a separate cooling device.(3) sensitivity.Depends primarily on manufacturing the chip itself.Electromechanical coupling coefficient, high sensitivity; the other hand, low sensitivity.Structure and Working Principle:When voltage is applied to piezoelectric ceramic, it will with the voltage and frequency of changes in the mechanical deformation.On the other hand, when the vibration of piezoelectric ceramics, it will generate a ing this principle, when given by the two piezoelectric ceramic or a piezoelectric ceramic and a vibrator, sheet metal, the so-called bimorph element called the imposition of an electricalsignal, it will emit ultrasonic vibration due to bending.Conversely, when applied to the bimorph ultrasonic devices, it will generate an electrical signal.Based on the above role, it can be used as a piezoelectric ceramic ultrasonic sensors.Such as ultrasonic sensors, a compound vibrator was flexibility on a fixed base.The vibrator is a composite resonator, and by a metal plate and a piezoelectric bimorph element consisting of a combination vibrator.Resonator and trumpets the purpose of effective radiation generated by the ultrasonic vibrations, and can effectively make ultrasonic vibrator gathered in a central location.Outdoor uses ultrasonic sensors must have a good seal in order to prevent dew, rain and dust intrusion.Piezoelectric ceramic is fixed on the top of the metal box inside the body.Base fixed in the open end of box, and covered with resin.Of ultrasonic sensors for industrial robots, the requirements to achieve an accuracy of 1mm, and has strong ultrasonic ponents using conventional bimorph bending vibration of the vibrator, in the case of frequencies above 70kHz, it is impossible to achieve this purpose.Therefore, in the high-frequency probe, you must use the vertical thickness vibration mode piezoelectric ceramic.In this case, the acoustic impedance of piezoelectric ceramics and the air becomes very important match.Acoustic impedance of piezoelectric ceramic 2.6 × 10⁷kg/m2s, while the acoustic impedance of air is 4.3×10²kg/m2s.5different power piezoelectric vibration will result in substantial losses of radiation on the surface.Adhesion of a special material on the piezoelectric ceramic, matching layers, as the sound can be achieved with air impedance match.This structure allows up to several hundred kHz ultrasonic sensors in the frequency of the circumstances, still be able to work properly.Ultrasonic distance sensor technology and application of the principle:Ultrasonic distance sensor can be widely used in Level (level) monitoring, robot collision avoidance, a variety of ultrasonic proximity switches, and related areas such as anti-theft alarm, reliable, easy installation, waterproof, small launch angle, high sensitivity,display instruments to facilitate connections with industry, also provides a larger probe launch angle.1, ultrasonic range finder: ultra-high energy acoustic ranging techniques to ultrasonic distance measurement techniques have been major breakthroughs, it not only broadens the applications of ultrasonic distance measurement technology (for very poor working conditions), and the use of smart regulation technology,greatly improve the reliability of ultrasonic products, and performance indicators, allowing users to worry about without looking back.Excellent echo processing technology ,5-50KHZ of ultra high strength level meter wave frequency to the maximum range up to 120 meters for medium temperature is -20℃-+175℃.Intelligent automatic adjustment made wave frequency, automatic temperature compensation function to work more stable and reliable.HpAWK series also has a flexible work (the power supply for 12VDC, 24VDC, 110V AC, 220V AC; two / three / four-wire system can be freely combined in the same instrument.It also has advanced remote GSM, CDMA, Internet debugging features, enabling users to readily available technical support.中文译文:超声波距离传感器设计原理:超声波传感器是利用超声波的特性研制而成的传感器。
参考资料原文:Capacitive sensors and the main features of the basic concepts: The measured volume of the machinery, such as displacement, pressure change is converted to the sensor capacitance. It is the sensitive part of the capacitor with variable parameters. Its most common form is composed of two parallel electrodes, a very inter-air as the medium of the capacitor, if the neglect edge effects, the capacitance for the capacitor plate ε A / δ, where εis a very inter-medium dielectric constant, A two electrode effective area covered by each other, δ is the distance between two electrodes. δ, A, εone of the three parameters will lead to the change in capacitance changes can be used for measurement. Therefore capacitive sensors can be divided into polar distance change type, change type size, media type three types of changes.Most from the changes in small type generally used to measure the linear displacement, or as a result of force, pressure, vibration caused by changes in polar distance (see capacitive pressure sensors). Change type size generally used to measure the angular displacement or linear displacement larger. Changes in media type commonly used in level measurement and a variety of media, temperature, density, humidity measurement. The advantage of the sensor capacitor structure is simple, inexpensive, high sensitivity,过载能力strong, good dynamic response and high temperature, radiation, vibration and other adverse conditions of strong adaptability and strong. The disadvantage is that there are non-linear output, parasitic capacitance and the distributed capacitance on the sensitivity and accuracy the impact of larger and more complex circuits, such as connectivity. Since the late 70s, with the development of integrated circuit technology, a packaging and micro-measuring instrument with capacitive sensors.This new type of distributed capacitance sensors can greatly reduce the impact to overcome the inherent drawbacks. Capacitive sensor is a very wide use, a great potential for development of the sensor.Capacitive sensor working principle:Capacitive sensor surface of the induction of two coaxial metal electrode composition, much like "open" capacitor electrode, the two electrodes form a capacitor, in series with the RC oscillation circuit. Power when connected, RC oscillator is notoscillating, when a goal of moving around electrical capacitor, the capacitor capacity increased, the oscillator to start oscillation. Circuit after the passage of the deal, will be two kinds of vibration and vibration signals into switching signals, which played a detection purpose of the existence of any objects. The sensor can detect metal objects, but also to detect non-metallic objects, metal objects can move away from the largest, non-metallic objects on the decision to move away from the dielectric constant material, the greater the dielectric constant materials, the availability of action the greater distance.Application of capacitive sensors:Capacitive sensor can be used to measure linear displacement, angular displacement, vibration amplitude, especially suitable for measuring high-frequency vibration amplitude, precision rotary axis accuracy, acceleration and other mechanical parameters. Pole-changing type of application from a smaller displacement in the measurement range to several hundred microns in 0.01m, precision can reach 0.01m, a resolution of up to 0.001m. Change type size larger displacement can be measured, for the zero-range a few millimeters to a few hundred mm, 0.5 percent better than the linear resolution of 0.01 ~ 0.001m. Capacitive angular displacement sensor point of view and the dynamic range to a few degrees, a resolution of about 0.1 "up to the stability of the zero angle-second, widely used in precision angle measurement, such as for high-precision gyroscopes and accelerometers tilting . capacitive measurement sensor can measure the peak amplitude for the 0 ~ 50m, a frequency of 10 ~ 2kHz, sensitivity is higher than 0.01m, non-linear error of less than 0.05m.Capacitive sensor can also be used to measure pressure, differential pressure, level, surface, composition content (such as oil, the water content of food), non-metallic coating materials, such as film thickness, dielectric measurements of humidity, density, thickness, etc., in the automatic detection and control systems are also often used as a location signal generator. Capacitive differential pressure sensor measuring range up to 50MPa, an accuracy of ± 0.25% ~ ± 0.5%. Capacitive sensor for measuring range of the thickness of a few hundred microns, resolution of up to 0.01m. Capacitive Proximity Switches can not only detect metal, but also can detect plastic, wood,paper, and other dielectric liquids, but can not achieve the ultra-small, the movement distance of about 10 ~ 20mm. Electrostatic capacitive level switch is widely used in detection is stored in the tank, hopper, such as the location of containers in a variety of objects of a mature product. When the capacitive sensor measuring metal surface conditions, from the size, vibration amplitude is often used very variable from unilateral type, when the measured object is a capacitor electrode, and the other electrode in the sensor inside. This type of sensor is a non-contact measurement, dynamic range is relatively small, about a few millimeters is about the precision of more than 0.1m, a resolution of 0.01 ~ 0.001m.译文:电容式传感器的基本概念及主要特点:把被测的机械量,如位移、压力等转换为电容量变化的传感器。
专利名称:Ultrasonic distance measuring system 发明人:Phelan, James J.,Hawkinson,Jeffrey c.申请号:EP91108554.6申请日:19910527公开号:EP0459336B1公开日:19950823专利内容由知识产权出版社提供摘要:A distance sensing system (10) includes an ultrasonic transducer (XM1), a transceiver (12) and a microcontroller-based signal processing unit (14). The transducer (12) periodically generates and directs towards the terrain a dual frequency ultrasonic signal. Echo signals from the ground and/or any intervening crop or trash are reflected back to the transducer (12) and are processed. The system generates amplified and filtered echo envelope signals. Leading and trailing edge times are determined as the times the echo signals cross a threshold value which is a certain proportion of a maximum echo amplitude value. A near distance value is derived from the leading edge time of the first echo which exceeds a minimum amplitude. A far distance value is determined as the trailing edge time of the last echo signal which has an amplitude which exceeds a certain value. Multiple echo time and amplitude values are derived from the maximum amplitude echo. These values are used to prevent echoes which occur after the multiple echo time with less than a certain amplitude from being used in the determination of the far distance value. This far distance value represents the distance to ground and weaker, earlier echoes from trash or crop and later, multiple echoes may be ignored.申请人:DEERE & CO地址:US国籍:US代理机构:Feldmann, Bernhard 更多信息请下载全文后查看。
毕业设计(论文)外文资料翻译系(院):电子与电气工程学院专业:测控技术与仪器姓名:学号:外文出处:United States Patent5442592(用外文写)附件:1.外文资料翻译译文;2.外文原文。
指导教师评语:所选内容与课题相关,对课题设计参考具有一定价值;翻译具有一定难度,工作量适中;译文基本正确,语句通顺,但也存在部分错误。
总体评价:良签名:2012 年 3 月 15 日注:请将该封面与附件装订成册。
附件1:外文资料翻译译文超声波测距仪文件类型和数目:美国专利5442592摘要:提出了一种可以抵消温度的影响和湿度的变化的新型超声波测距仪,包括测量单元和参考资料。
在每一个单位,重复的一系列脉冲的产生,每有一个重复率,直接关系到各自之间的距离,发射机和接收机。
该脉冲序列提供给各自的计数器,计数器的产出的比率,是用来确定被测量的距离。
出版日期:1995年8月15日主审查员:罗保.伊恩j.一、背景发明本发明涉及到仪器的测量距离,最主要的是,这种仪器,其中两点之间传输超声波。
精密机床必须校准。
在过去,这已经利用机械设备来完成,如卡钳,微米尺等。
不过,使用这种装置并不利于本身的自动化技术发展。
据了解,两点之间的距离可以通过测量两点之间的行波传播时间的决定。
这样的一个波浪型是一种超声波,或声波。
当超声波在两点之间通过时,两点之间的距离可以由波的速度乘以测量得到的在分离的两点中波中转的时间。
因此,本发明提供仪器利用超声波来精确测量两点之间的距离对象。
当任意两点之间的介质是空气时,声音的速度取决于温度和空气的相对湿度。
因此,它是进一步的研究对象,本次的发明,提供的是独立于温度和湿度的变化的新型仪器。
二、综述发明这项距离测量仪器发明是根据上述的一些条件和额外的一些基础原则完成的,其中包括一个参考单位和测量单位。
参考和测量单位是相同的,每个包括一个超声波发射机和一个接收机。
间隔发射器和接收器的参考值是一个固定的参考距离,而间距之间的发射机和接收机的测量单位是有最小距离来衡量的。
在每一个单位,发射器和接收器耦合的一个反馈回路,它会导致发射器产生超声脉冲,这是由接收器和接收到一个电脉冲然后被反馈到发射机转换,从而使重复系列脉冲的结果。
重复率脉冲是成反比关系之间的距离发射器和接收器。
在每一个单位,脉冲提供一个反馈。
由于参考的距离是众所周知的声速,比例反产出是利用数学以确定所期望的距离来衡量。
由于这两方面都是相同的影响,温度和湿度的变化,采取的比例相同,由此产生的测量变得准确。
三、详细说明(一)超声波测距原理1、压电式超声波发生器原理压电式超声波发生器实际上是利用压电晶体的谐振来工作的。
超声波发生器内部结构如下所示,它有两个压电晶片和一个共振板。
当它的两极外加脉冲信号,其频率等于压电晶片的固有振荡频率时,压电晶片将会发生共振,并带动共振板振动,便产生超声波。
反之,如果两电极间未外加电压,当共振板接收到超声波时,将压迫压电晶片作振动,将机械能转换为电信号,这时它就成为超声波接收器了。
测量脉冲到达时间的传统方法是以拥有固定参数的接收信号开端为基础的。
这个界限恰恰选于噪音水平之上,然而脉冲到达时间被定义为脉冲信号刚好超过界限的第一时刻。
一个物体的脉冲强度很大程度上取决于这个物体的自然属性尺寸还有它与传感器的距离。
进一步说,从脉冲起始点到刚好超过界限之间的时间段随着脉冲的强度而改变。
结果,一种错误便出现了——两个拥有不同强度的脉冲在不同时间超过界限却在同一时间到达。
强度较强的脉冲会比强度较弱的脉冲超过界限的时间早点,因此我们会认为强度较强的脉冲属于较近的物体。
2、超声波测距原理超声波发射器向某一方向发射超声波,在发射时刻的同时开始计时,超声波在空气中传播,途中碰到障碍物就立即返回来,超声波接收器收到反射波就立即停止计时。
超声波在空气中的传播速度为340m/s,根据计时器记录的时间t,就可以计算出发射点距障碍物的距离(s),即:s=340t/2二超声波测距系统的电路设计系统的特点是利用单片机控制超声波的发射和对超声波自发射至接收往返时间的计时,单片机选用8751,经济易用,且片内有4K的ROM,便于编程。
电路原理图如图所示。
其中只画出前方测距电路的接线图,左侧和右侧测距电路与前方测距电路相同,故省略之。
1、40kHz脉冲的产生与超声波发射测距系统中的超声波传感器采用UCM40的压电陶瓷传感器,它的工作电压是40kHz的脉冲信号,这由单片机执行下面程序来产生。
puzel: mov 14h, #12h;超声波发射持续200mshere: cpl p1.0 ;输出40kHz方波nop ;nop ;nop ;djnz 14h,here;ret前方测距电路的输入端接单片机P1.0端口,单片机执行上面的程序后,在P1.0端口输出一个40kHz的脉冲信号,经过三极管T放大,驱动超声波发射头UCM40T,发出40kHz的脉冲超声波,且持续发射200ms。
右侧和左侧测距电路的输入端分别接P1.1和P1.2端口,工作原理与前方测距电路相同。
2、超声波的接收与处理接收头采用与发射头配对的UCM40R,将超声波调制脉冲变为交变电压信号,经运算放大器IC1A和IC1B两极放大后加至IC2。
IC2是带有锁定环的音频译码集成块LM567,内部的压控振荡器的中心频率f0=1/1.1R8C3,电容C4决定其锁定带宽。
调节R8在发射的载频上,则LM567输入信号大于25mV,输出端8脚由高电平跃变为低电平,作为中断请求信号,送至单片机处理。
前方测距电路的输出端接单片机INT0端口,中断优先级最高,左、右测距电路的输出通过与门IC3A的输出接单片机INT1端口,同时单片机P1.3和P1.4接到IC3A的输入端,中断源的识别由程序查询来处理,中断优先级为先右后左。
部分源程序如下:receive1:push pswpush accclr ex1 ;关外部中断1jnb p1.1, right ; P1.1引脚为0,转至右测距电路中断服务程序 jnb p1.2, left ; P1.2引脚为0,转至左测距电路中断服务程序return: SETB EX1;开外部中断1pop accpop pswretiright: ... ;右测距电路中断服务程序入口ajmp returnleft: ... ;左测距电路中断服务程序入口ajmp return3、计算超声波传播时间在启动发射电路的同时启动单片机内部的定时器T0,利用定时器的计数功能记录超声波发射的时间和收到反射波的时间。
当收到超声波反射波时,接收电路输出端产生一个负跳变,在INT0或INT1端产生一个中断请求信号,单片机响应外部中断请求,执行外部中断服务子程序,读取时间差,计算距离。
其部分源程序如下:RECEIVE0: PUSH PSWPUSH ACCCLR EX0 ;关外部中断0MOV R7, TH0 ;读取时间值MOV R6, TL0CLR CMOV A, R6SUBB A, #0BBH;计算时间差MOV 31H, A ;存储结果MOV A, R7SUBB A, #3CHMOV 30H, ASETB EX0 ;开外部中断0POP ACCPOP PSWRETI对于一个平坦的目标,距离测量包括两个阶段:粗糙的测量和精细测量。
第一步:脉冲的传送产生一种简单的超声波。
第二步:根据公式改变回波放大器的获得量直到回拨被检测到。
第三步:检测两种回波的振幅与过零时间。
第四步:设置回波放大器的所得来规格输出,假定是3伏。
通过脉冲的周期设置下一个脉冲。
根据第二部的数据设定时间窗。
第五步:发射两串脉冲产生干扰波。
测量过零时间与回波的振幅。
如果逆向发生在回波中,决定要不通过在低气压插入振幅。
第六步:通过公式计算距离y。
四、超声波测距系统的软件设计软件分为两部分,主程序和中断服务程序,如图3(a)(b)(c) 所示。
主程序完成初始化工作、各路超声波发射和接收顺序的控制。
定时中断服务子程序完成三方向超声波的轮流发射,外部中断服务子程序主要完成时间值的读取、距离计算、结果的输出等工作。
系统初始化后就启动定时器T1从0开始计数,此时主程序进入等待,当到达定时时间时T1溢出进入T1中断服务子程序;在T1中断服务子程序中将启动一次新的超声波发射,此时将在P1.0引脚上开始产生kHz40的方波,同时开启定时器T0计时,为了避免直射波的绕射,需要延迟1ms后再开INT0中断允许;INT0中断允许打开后,若此时出现低电平则代表收到回波信号,将提出中断请求进入INT0中断服务子程序,在INT0中断服务子程序中将停止定时器T0计时,读取定时器T0时间值到相应的存储区,同时设置接收成功标志;主程序一旦检测到接收成功标志,将调用测温子程序,采集超声波测距时的环境温度,并换算出准确的声速,存储到RAM存储单元中;单片机再调用距离计算子程序进行计算,计算出传感器到目标物体之间的距离;此后主程序调用显示子程序进行显示;当一次发射、接收、显示的过程完成后,系统将延迟100ms重新让T1置初值,再次启动T1以溢出,进入下一次测距。
如果由于障碍物过远,超出量程,以致在T0溢出时尚未接收到回波,则显示“ERROR”重新回到主流程进入新一轮测试。
五、结论对所要求测量范围30cm~200cm内的平面物体做了多次测量发现,其最大误差为0.5cm,且重复性好。
可见基于单片机设计的超声波测距系统具有硬件结构简单、工作可靠、测量误差小等特点。
因此,它不仅可用于移动机器人,还可用在其它检测系统中。
思考:至于为什么接收不用晶体管做放大电路呢,因为放大倍数搞不好,CX20106集成放大电路,还带自动电平增益控制,放大倍数为76dB,中心频率是38k到40k,刚好是超声波传感器的谐振频率。
附件2:外文原文(复印件)Ultrasonic distance meterDocument Type and Number:United States Patent 5442592 Abstract:An ultrasonic distance meter cancels out the effects of temperature and humidity variations by including a measuring unit and a reference unit. In each of the units, a repetitive series of pulses is generated, each having a repetition rate directly related to the respective distance between an electroacoustic transmitter and an electroacoustic receiver. The pulse trains are provided to respective counters, and the ratio of the counter outputs is utilized to determine the distance being measured.Publication Date:08/15/1995Primary Examiner:Lobo, Ian J.A.BACKGROUND OF THE INVENTIONThis invention relates to apparatus for the measurement of distance and, more particularly, to such apparatus which transmits ultrasonic waves between two points. Precision machine tools must be calibrated. In the past, this has been accomplished utilizing mechanical devices such as calipers, micrometers, and the like. However, the use of such devices does not readily lend itself to automation techniques. It is known that the distance between two points can be determined by measuring the propagation time of a wave travelling between those two points. One such type of wave is an ultrasonic, or acoustic, wave. When an ultrasonic wave travels between two points, the distance between the two points can be measured by multiplying the transit time of the wave by the wave velocity in the medium separating the two points. It is therefore an object of the present invention to provide apparatus utilizing ultrasonic waves to accurately measure the distance between two points.When the medium between the two points whose spacing is being measured is air, the sound velocity is dependent upon the temperature and humidity of the air. It is therefore a further object of the,present invention to provide apparatus of the type described which is independent of temperature and humidity variations.B.SUMMARY OF THE INVENTIONThe foregoing and additional objects are attained in accordance with the principles of this invention by providing distance measuring apparatus which includes a reference unit and a measuring unit. The reference and measuring units are the same and each includes an electroacoustic transmitter and an electroacoustic receiver. The spacing between the transmitter and the receiver of the reference unit is a fixed reference distance, whereas the spacing between the transmitter and receiver of the measuring unit is the distance to be measured. In each of the units, the transmitter and receiver are coupled by a feedback loop which causes the transmitter to generate an acoustic pulse which is received by the receiver and converted into an electrical pulse which is then fed back to the transmitter, so that a repetitive series of pulses results. The repetition rate of the pulses is inversely related to the distance between the transmitter and the receiver. In each of the units, the pulses are provided to a counter. Since the reference distance is known, the ratio of the counter outputs is utilized to determine the desired distance to be measured. Since both counts are identically influenced by temperature and humidity variations, by taking the ratio of the counts, the resultant measurement becomes insensitive to such variations. C.DETAILED DESCRIPTIONA.principle of ultrasonic distance measurement1, the principle of piezoelectric ultrasonic generatorPiezoelectric ultrasonic generator is the use of piezoelectric crystal resonators to work. Ultrasonic generator, the internal structure as shown in Figure 1, it has two piezoelectric chip and a resonance plate. When it's two plus pulse signal, the frequency equal to the intrinsic piezoelectric oscillation frequency chip, the chip will happen piezoelectric resonance, and promote the development of plate vibration resonance, ultrasound is generated. Conversely, if the two are not inter-electrode voltage, when the board received ultrasonic resonance, it will be for vibration suppression of piezoelectric chip, the mechanical energy is converted to electrical signals, then it becomes the ultrasonic receiver.The traditional way to determine the moment of the echo's arrival is based on thresholding the received signal with a fixed reference. The threshold is chosen well above the noise level, whereas the moment of arrival of an echo is defined as the firstmoment the echo signal surpasses that threshold. The intensity of an echo reflecting from an object strongly depends on the object's nature, size and distance from the sensor. Further, the time interval from the echo's starting point to the moment when it surpasses the threshold changes with the intensity of the echo. As a consequence, a considerable error may occur Even two echoes with different intensities arriving exactly at the same time will surpass the threshold at different moments. The stronger one will surpass the threshold earlier than the weaker, so it will be considered as belonging to a nearer object. 2, the principle of ultrasonic distance measurementUltrasonic transmitter in a direction to launch ultrasound, in the moment to launch the beginning of time at the same time, the spread of ultrasound in the air, obstacles on his way to return immediately, the ultrasonic reflected wave received by the receiver immediately stop the clock. Ultrasound in the air as the propagation velocity of 340m / s, according to the timer records the time t, we can calculate the distance between the launch distance barrier (s), that is: s = 340t / 2B.Ultrasonic Ranging System for the Second Circuit DesignSystem is characterized by single-chip microcomputer to control the use of ultrasonic transmitter and ultrasonic receiver since the launch from time to time, single-chip selection of 8751, economic-to-use, and the chip has 4K of ROM, to facilitate programming. Circuit schematic diagram shown in Figure 2. Draw only the front range of the circuit wiring diagram, left and right in front of Ranging Ranging circuits and the same circuit, it is omitted.1,40 kHz ultrasonic pulse generated with the launchRanging system using the ultrasonic sensor of piezoelectric ceramic sensors UCM40, its operating voltage of the pulse signal is 40kHz, which by the single-chip implementation of the following procedures to generate.puzel: mov 14h, # 12h; ultrasonic firing continued 200mshere: cpl p1.0; output 40kHz square wavenop;nop;nop;djnz 14h, here;retRanging in front of single-chip termination circuit P1.0 input port, single chip implementation of the above procedure, the P1.0 port in a 40kHz pulse output signal, after amplification transistor T, the drive to launch the first ultrasonic UCM40T, issued 40kHz ultrasonic pulse, and the continued launch of 200ms. Ranging the right and the left side of the circuit, respectively, then input port P1.1 and P1.2, the working principle and circuit in front of the same location.2, reception and processing of ultrasonicUsed to receive the first launch of the first pair UCM40R, the ultrasonic pulse modulation signal into an alternating voltage, the op-amp amplification IC1A and after polarization IC1B to IC2. IC2 is locked loop with audio decoder chip LM567, internal voltage-controlled oscillator center frequency of f0 = 1/1.1R8C3, capacitor C4 determine their target bandwidth. R8-conditioning in the launch of the carrier frequency on the LM567 input signal is greater than 25mV, the output from the high jump 8 feet into a low-level, as interrupt request signals to the single-chip processing.Ranging in front of single-chip termination circuit output port INT0 interrupt the highest priority, right or left location of the output circuit with output gate IC3A access INT1 port single-chip, while single-chip P1.3 and P1. 4 received input IC3A, interrupted by the process to identify the source of inquiry to deal with, interrupt priority level for the first left right after. Part of the source code is as follows:receive1: push pswpush accclr ex1; related external interrupt 1jnb p1.1, right; P1.1 pin to 0, ranging from right to interrupt service routine circuitjnb p1.2, left; P1.2 pin to 0, to the left ranging circuit interrupt service routinereturn: SETB EX1; open external interrupt 1pop accpop pswretiright: ...?; right location entrance circuit interrupt service routineAjmp Returnleft: ...; left Ranging entrance circuit interrupt service routineAjmp Return3, the calculation of ultrasonic propagation timeWhen you start firing at the same time start the single-chip circuitry within the timer T0, the use of timer counting function records the time and the launch of ultrasonic reflected wave received time. When you receive the ultrasonic reflected wave, the receiver circuit outputs a negative jump in the end of INT0 or INT1 interrupt request generates a signal, single-chip microcomputer in response to external interrupt request, the implementation of the external interrupt service subroutine, read the time difference, calculating the distance . Some of its source code is as follows:RECEIVE0: PUSH PSWPUSH ACCCLR EX0; related external interrupt 0MOV R7, TH0; read the time valueMOV R6, TL0CLR CMOV A, R6SUBB A, # 0BBH; calculate the time differenceMOV 31H, A; storage resultsMOV A, R7SUBB A, # 3CHMOV 30H, ASETB EX0; open external interrupt 0POP ACCPOP PSWRETIFor a flat target, a distance measurement consists of two phases: a coarse measurement and. a fine measurement:Step 1: Transmission of one pulse train to produce a simple ultrasonic wave.Step 2: Changing the gain of both echo amplifiers according to equation , until the echo is detected.Step 3: Detection of the amplitudes and zero-crossing times of both echoes.Step 4: Setting the gains of both echo amplifiers to normalize the output at, say 3 volts.Setting the period of the next pulses according to the : period of echoes. Setting the time window according to the data of step 2.Step 5: Sending two pulse trains to produce an interfered wave. Testing the zero-crossing times and amplitudes of the echoes. If phase inversion occurs in the echo, determine to otherwise calculate to by interpolation using the amplitudes near the trough. Derive t sub m1 and t sub m2 .Step 6: Calculation of the distance y using equation .D.Fourth, the ultrasonic ranging system software designSoftware is divided into two parts, the main program and interrupt service routine, shown in Figure 3 (a) (b) (c) below. Completion of the work of the main program is initialized, each sequence of ultrasonic transmitting and receiving control.Interrupt service routines from time to time to complete three of the rotation direction of ultrasonic launch, the main external interrupt service subroutine to read the value of completion time, distance calculation, the results of the output and so on..System initialization after the start timer T1 starts counting from 0 to enter the main program to wait for the T1 overflow into the T1 interrupt service routine when the time is reached; T1 interrupt service routine will start a new ultrasonic transmitting, the square wave will be generated in the P1.0 pin at the same time open the timer T0 timing, in order to avoid the diffraction of the direct wave, the delay 1ms and then, after the INT0 interrupt Enable; the INT0 interrupt to allow open, if thisoccurs when the low is representative of the received echo signal, the interrupt request to INT0 interrupt service routine, the INT0 interrupt service routine will stop the timer T0 timing, read the timevalue of T0 timer to the appropriate storage area.set to receive a sign of success; main program detects reception hallmarks of success, the temperature subroutine is called, collecting the ambient temperature when the ultrasonic ranging, and converted the accurate speed of sound stored in RAM storage unit; SCM calls the distance calculationsubroutine to calculate, calculate the distance between the sensor to the target object; since the main program calls the display subroutine to display; after completion of the first launch, receive, display, the system will delay 100ms re-T1 set initial value againstart T1 to overflow into the next ranging. If the obstacle is too far beyond the range that T0 overflow has not yet received echo "ERROR" is displayed back to the main flow into a new round of tests.E. CONCLUSIONSRequired measuring range of 30cm ~ 200cm objects inside the plane to do a number of measurements found that the maximum error is 0.5cm, and good reproducibility. Single-chip design can be seen on the ultrasonic ranging system has a hardware structure is simple, reliable, small features such as measurement error. Therefore, it can be used not only for mobile robot can be used in other detection systems.Thoughts: As for why the receiver do not have the transistor amplifier circuit, because the magnification well, CX20106 integrated amplifier, but also with automatic gain control level, magnification to 76dB, the center frequency is 38k to 40k, is exactly resonant ultrasonic sensors frequency。