北大心理学系psychtoolbox2
- 格式:ppt
- 大小:6.26 MB
- 文档页数:4
心理评估工具以下全部量表来源:1.张作记.行为医学量表手册.北京:中华医学电子音像出版社,2005. 2.中国心理卫生出版社.心理卫生量表手册增订版.北京:中国心理卫生杂志社,1999.一、人格测验常用量表1.16项人格因素问卷(16 Personality Factor Questionnaire, 16PF)是美国伊利诺州立大学人格与能力测验研究所几经修改和淘汰,最后留下187个问题,包括15个人格因素和1个智力因素。
北京师范大学心理测评研究所应用国际最新心理测量成果及国际最新的IRT技术,对16PF做了大幅度修改,开发出最新版本的MDPF-2004,共计十六种分量表,即乐群性、聪慧性、稳定性、恃强性、兴奋性、有恒性、敢为性、敏感性、怀疑性、幻想性、事故性、忧虑性、实验性、独立性、自律性和紧张性。
16PF是为正常人群应用而设计的,也有研究者用此工具在临床上试用。
2.艾森克人格问卷(Eysenck Personality Questionnaire, EPQ)又称艾森克个性问卷,是英国伦敦大学心理系和精神病学研究所艾森克分为四个分量表,即外倾性(Extraversion, E)、神经质(Neuroticism, N)、精神质(Psychoticism, P)和测谎(Lie, L)。
N维度反映情绪稳定性;E维度反映内向和外向性;P维度反映精神病质倾向;L做为效度量表使用。
我国学者龚耀先教授组织全国28个协作单位进行了中文版的标准化工作,于1983年发布了中文版手册。
钱铭怡教授在2000年引进了艾森克人格问卷简式量表(EPQ-RS),并修订艾森克人格问卷简式量表中国版(EPQ-RSC)。
二、临床评定量表1.症状自评量表(Symptom Checklist 90, SCL-90)有时也叫做Hopkin’s症状清单(HSCL),现版本由Derogatis编制于1973年。
SCL-90在国外应用甚广,80年代引入我国,随即广泛应用,在各种自评量表中是较受欢迎的一种。

心理健康评估工具及其应用心理健康是每个人都应该关注的重要领域,它对于个体的幸福感、内心平衡和生活品质有着重要的影响。
而心理健康评估工具的开发与应用,为我们提供了评估和了解个体心理健康状况的重要手段。
本文将介绍一些常见的心理健康评估工具,以及它们的应用场景和作用。
一、抑郁症筛查量表抑郁症是一种常见的心理障碍,对患者的心理健康造成了严重的影响。
抑郁症筛查量表是一种常用的工具,用于评估个体是否存在抑郁症状。
其中,汉密尔顿抑郁评定量表(Hamilton Depression Rating Scale,简称HAMD)是一种常见的抑郁症评估工具。
它通过对患者的行为、情绪和身体症状进行打分,从而评估抑郁症的严重程度。
抑郁症筛查量表的应用十分广泛,它可以用于临床诊断、科研研究和心理辅导等领域。
临床上,医生可以使用抑郁症筛查量表来评估病人的抑郁症状,从而制定相应的治疗方案。
科研研究中,抑郁症筛查量表可以帮助研究人员了解不同群体中抑郁症的发病率和相关因素,为进一步的研究提供依据。
同时,抑郁症筛查量表还可以用于心理辅导中,辅助心理咨询师了解患者的抑郁程度,从而制定个性化的干预方案。
二、焦虑症评估量表焦虑症是一种常见的心理障碍,患者常常伴随着持续的紧张、恐惧和不安。
焦虑症评估量表是评估个体焦虑症状的工具,其中汉密尔顿焦虑评定量表(Hamilton Anxiety Rating Scale,简称HAMA)是一种常用的评估工具。
它通过评估患者在心理、情绪和生理上的焦虑症状,从而确定焦虑症的严重程度。
焦虑症评估量表的应用范围广泛,包括临床诊断、科研研究和心理咨询等领域。
在临床上,医生可以使用焦虑症评估量表来了解患者的焦虑症状,制定个体化的治疗计划。
科研研究中,焦虑症评估量表可以帮助研究人员探索焦虑症的发生机制和相关因素,为预防和干预提供依据。
在心理咨询中,焦虑症评估量表可以辅助咨询师了解患者的焦虑程度,从而提供精准的咨询服务。

《基本认知能力测验》及其软件简介“临床记忆量表”中国科学院心理研究所2005年成果推广培训信息中国科学院心理研究所是国家级科研机构,承担着国家级和教委及各部委的多项重点科研项目。
是硕士、博士培养点,有博士后流动站,专家云集。
是劳动部定点的心理咨询师培训、及各种短期心理学培训机构。
国际合作广泛。
办学二十几年,经验丰富,师资力量雄厚,各种资料、教材种类齐全。
我们把2005年的计划发给您,欢迎各界人士参加并代为宣传张贴。
•美国明尼苏达多项个性调查量表第二版(MMPI-2)•托尼非语文智力测验(TONI-2)--本世纪修订的最新、最附和儿童、少年智力现状的量表•LCVIT职业兴趣测验•中国科学院心理研究所心理测量系统16PF 、SCL-90、艾森克人格、焦虑量表、抑郁量表•临床记忆量表(秋季班不讲)•青少年心理健康测验(MHT)•大学生心理健康调查表(UPI)•瑞文智力(联合型)量表•全国首届青少年网络成瘾心理治疗研讨班•心理咨询与心理治疗高级研讨进修班•临床神经心理康复高级研讨班•精神分析疗法连续培训第一届招生简章•危机干预与自杀预防研讨班•报名办法(以上各班共用)心理测验使用资格证书培训班我所准备2005年春季在北京和秋季在海口举办两次为期7天的心理测验培训班。
主要推广以下量表,培训结束,经专家考核合格,中国科学心理研究所颁发心理测验使用资格证书。
第一、美国明尼苏达多项个性调查量表第二版(MMPI-2)1、MMPI量表是美国1942年制定,我所于七十年代修订的。
美国于二十世纪八十年代对其进行了修订,简记为MMPI-2。
我所张建新、宋维真等教授于九十年代对MMPI-2进行了标准化工作,制定了中国常模,2003年完成手册编制及计算机化操作。
它更加适应现代人的心理特征。
目前美国已停止使用MMPI。
2、中文版MMPI-2修改和新增加的题目占总题量的三分之一,题目总数达567道。
效度量表增加到7个,内容量表增加到15个、开发了全部附加量表和临床量表的亚量表等重要指标。

北大实验心理学第一章绪论&1.观察与实验一.实验的意义以精密的控制获得正确的结果eg:下落物体的重量与下落时间的关系。
物体高度,初速大小,重量,形状质地,etc时间为因变量,其他均为控制变量二.心理学研究涉及的变量1.自变量——可操纵(对一个事物),选择(男女,被试年龄。
)刺激变量(一般都可操纵)被试变量(一般是用选择的方法)2.因变量——测量(包括计数)3.干扰变量(或称控制变量)也包括刺激变量,被试变量。
三.思考1.学习以后,再现之前,插入学习材料的多少与原来学习材料的遗忘情况之间的关系。
2.对外语单词每次记多少个(自变量)比较合适,测验做对的题数(因变量)。
3.视力(自变量)对字词再认(因变量)再认的影响4.男女生(性别自~)对计算机爱好差异(程度因~)5.小学生可否学代数年龄(小学生/中学生自~)(学会/学不会因~)6.培养自学能力,提高教学质量。
(培养/不培养自~)(成绩因~)7.说出变量控制上的问题(i) 一学校用计算机辅助教学,一组用PC机,一组用Apple机结论:用计算机好。
X.因为是在比较不同的机型。
(ii) 一老是用计算机辅助口算数学。
一节课后测验,发现用计算机的学生的成绩高于不用计算机的学生。
(智商,水平,性别,年龄都一样)结论:用计算机好X.(因为情绪变量设有控制)用CIA,兴奋。
&2.心理学实验设计的基本问题一.问题的选定从某理论,从生活经验二.选定实验目的检验何种自变量与何种因变量之间的关系三.实验方法(程序)eg:(I)A~B 对照(两组)(ii)ANA (一组)方法一——N(新方法)——方法——(iii)ANNAAN…随机(一组)四.(被试)选择对象五.时间,地点,人员,材料&3.实验报告的写法一.题目二.关键词3~5个三.引言。
从前的实验。
引用的话。
自己的目的,原实验有何矛盾,问题。
四.方法五.结果(不下结论)统计检验,有无显著性差异(也可能有引用,要注明)六.讨论(自由发挥)七.结论强调结果八.参考文献九.附录(原始数据,资料)带有统计编号意义的用阿拉伯数字(年月日,时间也是)约数用中文(不要顿号),个位数也常用中文,文献中,古籍——中文,现代——数字万,亿,兆可压缩——eg:1.2亿3千”X”第二章反应时&1一般问题一.人差方程A-B=0.5二.反应时没有反应的时间(又叫反应潜伏期)三.唐德斯,反应时A,B,C图(略)四.反应时的测定&2.减法反应时一.减法反应时的定义任务一与任务二只差一个要研究的环节,两反应时相减得到的结果即要研究的环节的反应时。

PsychELab®心理教学系统实验操作指南PsychELab®心理教学系统是教育部“实验心理学”名牌课程课题科研成果之一,开发于2000年左右,由北京师范大学心理学专家完成,最初用于北京师范大学心理系实验心理学课程的教学软件。
经过10多年的应用与探索,目前有超过200所高校与单位在使用。
PsychELab®心理教学系统配有更明了的教学指南:每个实验都配有针对实验本身的帮助文件,内含实验背景、实验设计范式、结果数据含义及处理方法、参考文献、软件操作指导等内容(见附录不同材料的学习迁移)。
附:不同材料的学习迁移实验背景知识学习迁移:一种学习对另一种学习的影响。
也可以说它是用已获得的知识、技能、学习方法或学习态度对学习新知识、新技能和解决新问题所产生的一种影响;或者说是将学得的经验有变化地运用到另一种情境。
先学习的材料对后学习的材料的阻碍作用称为负迁移,先学习的材料对后学习的材料的促进作用称为正迁移。
研究学习迁移常用的实验方法有前后测验法和继续学习法。
对于继续学习法的实验,可以将被试随机分成A、B两组。
本实验将采用继续学习法来研究学习迁移,分为A组:先学甲,后学乙和B组:先学乙,后学甲,实验结束后可以比较学会标准所用的时间。
验证学习迁移的效果。
实验介绍一、实验设计和实验材料1、实验仪器与实验材料装有PsychELab®心理教学系统的计算机,键盘。
本实验中有两种学习材料(见表-1)。
材料A,第一行是五种不同形状的图形,第二行是五个频的汉字双字词,并分别与五种图形一一对应;材料B,第一行为五个高频的汉字双子词,第二行为五个大写英文字母(H、M、K、T、E)分别与之一一对应,具体实验材料如下:表-1 学习迁移实验材料材料A材料B2、实验设计本实验采用对照组(材料学习顺序不同)实验设计,一组为先学材料A后学材料B,另一组先学材料B后学材料A)。
3、实验过程(1)首先,把被试随机分成甲乙两等组,甲先学A后学B,乙先学B后学A。

matlab psychtoolbox点探测范式下载提示:该文档是本店铺精心编制而成的,希望大家下载后,能够帮助大家解决实际问题。
文档下载后可定制修改,请根据实际需要进行调整和使用,谢谢!本店铺为大家提供各种类型的实用资料,如教育随笔、日记赏析、句子摘抄、古诗大全、经典美文、话题作文、工作总结、词语解析、文案摘录、其他资料等等,想了解不同资料格式和写法,敬请关注!Download tips: This document is carefully compiled by this editor. I hope that after you download it, it can help you solve practical problems. The document can be customized and modified after downloading, please adjust and use it according to actual needs, thank you! In addition, this shop provides you with various types of practical materials, such as educational essays, diary appreciation, sentence excerpts, ancient poems, classic articles, topic composition, work summary, word parsing, copy excerpts, other materials and so on, want to know different data formats and writing methods, please pay attention!MATLAB Psychtoolbox是一种在心理学研究中广泛使用的工具,可以帮助实验设计和数据收集。

积极心理学团体疗法在双相情感障碍患者中的应用效果目录一、内容概要 (2)(一)双相情感障碍概述 (3)(二)积极心理学与团体疗法简介 (3)(三)研究背景与意义 (5)二、双相情感障碍的现状分析 (6)(一)流行病学数据 (7)(二)病因与发病机制探讨 (8)(三)临床特点及治疗挑战 (9)三、积极心理学团体疗法的理论基础 (10)(一)积极心理学的核心理念 (11)(二)团体疗法的理论支撑 (12)(三)积极心理学团体疗法的实践原则 (14)四、积极心理学团体疗法在双相情感障碍患者中的应用方法 (15)(一)团体成员的选择标准 (17)(二)团体疗法的实施步骤 (17)(三)治疗过程中的注意事项 (18)五、积极心理学团体疗法在双相情感障碍患者中的应用效果评估 (20)(一)评估工具的选择与设计 (21)(二)实证研究方法介绍 (23)(三)应用效果的具体表现 (24)六、案例分析与讨论 (25)(一)成功案例分享 (27)(二)失败案例剖析 (28)(三)经验总结与反思 (29)七、结论与展望 (30)(一)研究结论的阐述 (31)(二)研究的局限性与不足之处 (32)(三)未来研究方向展望 (34)一、内容概要PPGT)在双相情感障碍(BD)患者中的临床应用及其实际效果。
该研究旨在通过实证支持,评估PPGT如何作为心理治疗的一种辅助手段,有效地应对BD患者的症状,如情绪波动、社交退缩和自我认知困扰等。
综合文献回顾、定性访谈及量表评估,本研究采用前瞻性和回顾性相结合的方法,分析不同阶段的治疗进展以及患者的自我报告、生活质量变化和社交功能恢复的情况。
该研究预期将为健康专业人士提供权威的干预模式,并有可能促进对双相情感障碍治疗策略的创新与定制,从而提高患者的整体治疗效果和生活质量。
通过本研究,有可能找到改善当前治疗路径的方式,助力更系统、更精确的治疗行动框架的建立。
本研究的理论框架植根于积极心理学的三个核心领域——性格特质、积极情绪和意义与目的。

2017北大实验心理学之思维
第七章思维
第一节问题解决
一、影响问题解决的一些因素
1. 刺激物的名称是否呈现会影响问题的解决
2. 噪声
3. 定势的作用
4. 解决问题的策略
5. 个性的影响
第二节概念的形成
概念就是对具有相似特征的一组刺激所作的同样反应。
概念形成就是去发现那些相似特征的过程。
l 年龄的确对辩别学习有巨大影响。
一种策略是,刚才圆的是对的,三角形是错的。
现在反过来了,圆的是错的,三角形是对的了。
这样的策略属于逆转换,因为被试只在图形这个维度上作了改变。
还有第二种策略,刚才圆的是对的,现有红的对了。
这样的策略属于额外因素转换,因为被试转换了维度把图形换成了颜色。
第三节决策
卡尼曼和底沃斯基:研究表明:人们往往受一些与作出决定无关的信息的影响,但是又常常忽略了一些与作出决定至关重要的信息。
在日常生活中我们常常把代表性搞错而在决定概率的犯错误。
可利用性也常常导致人们的错误判断。
样本的大小是一个正确的线索,但人们没有好好利用它。
小样本的数据更容易偏离平均数。
二、影响决策的因素
1. 年龄的差别对人们作出决策的影响
青年人更敢于冒风险。
老年人使用的标准较高,较保守。
2. 性格特点对决策的影响。

北大青鸟心理学仪器数据采集软件北京青鸟天桥仪器设备有限责任公司北大青鸟心理学仪器实验、测试结束后,为了方便原始数据的保留与汇总,大多具有数据输出功能。
此类仪器在面板或操作屏上有“打印”功能键:或,在仪器的一侧的有“打印”或“打印机”输出端:或。
具有此功能的仪器在北大青鸟“科教仪器产品价目表”的备注栏中有标注“可选配微型打印机”。
具体可见附录2的清单。
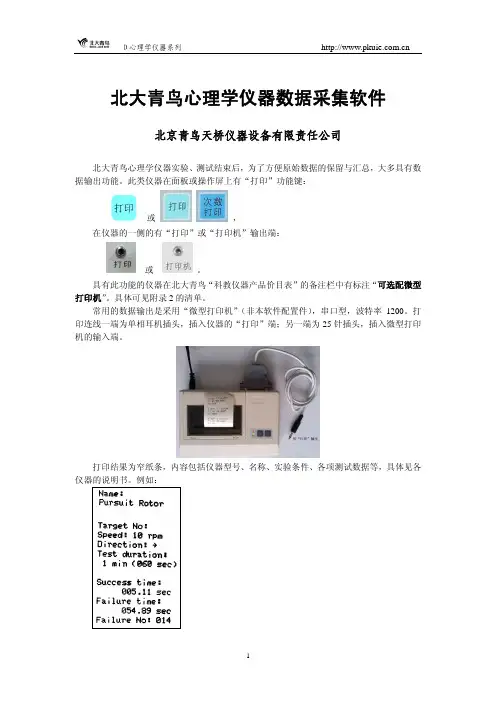
常用的数据输出是采用“微型打印机”(非本软件配置件),串口型,波特率1200。
打印连线一端为单相耳机插头,插入仪器的“打印”端;另一端为25针插头,插入微型打印机的输入端。
打印结果为窄纸条,内容包括仪器型号、名称、实验条件、各项测试数据等,具体见各仪器的说明书。
例如:数据“打印”输出除向微型打印机输出外,也可以向PC机输出,这样更方便于数据的汇总。
“北大青鸟心理学仪器数据采集”软件专为北大青鸟生产的心理学仪器设计,为此类仪器的通用软件。
具有打印输出功能的各种心理学仪器,计算机通过其串口或USB口,可以采集“打印”输出的全部实验结果数据。
数据可以以文本或EXCEL格式保存。
l本软件配置:软件光盘;数据线(一端单相耳机插头,另一端为9针插头);USB—RS232转换线(附驱动软件)。
l电脑操作系统:Windows XP、Windows Vista。
屏幕分辨率:最低1024*768。
l软件安装:执行安装程序,按照提示逐步确定,直到完成。
l连接数据线:单相耳机插头插入心理学仪器的“打印”插座中,另一端9针插头联接于计算机的串口通讯插座中。
如计算机串口选用USB口,则9针串口端必须连接USB—RS232转换线,并安装相应的驱动程序。
注意切勿带电插拔数据线,插拔数据线必须关断计算机及心理学仪器的电源。
l运行程序:一、由串口直接采集1、串口设置:程序自动设别本计算机存在的串口号,并列出。
选择数据线连接的串口号。
计算机通讯串口为COM1或COM2。
如选用USB口,接入USB—RS232转换线后,串口端口号通常在COM6以上,由计算机自动确定,并且可以人工修改,具体串口端口号查看及修改方法见附录3。

心理咨询师的评估与诊断工具使用在心理咨询领域,评估与诊断是帮助咨询师了解和解决客户问题的重要工具。
通过评估工具,咨询师可以获取客户的相关信息,了解他们的情绪状态、个性特点和潜在问题。
而诊断工具则帮助咨询师对客户进行分类和分析,从而提供个性化的治疗方案。
本文将介绍一些心理咨询师常用的评估与诊断工具,包括自我报告量表、面谈和观察等。
自我报告量表是一种常用的心理评估工具,它通过让客户填写问卷来了解他们的情感状态、行为特征和人际关系等。
比较典型的自我报告量表包括贝克抑郁自评量表、汉密尔顿抑郁量表等。
贝克抑郁自评量表通过询问客户的心理症状,如悲伤、焦虑等,以评估其抑郁状况的程度。
而汉密尔顿抑郁量表则通过面谈和观察来评估客户的抑郁程度。
这些自我报告量表为咨询师提供了客观的数据,帮助他们更全面地了解客户的心理状态。
除了自我报告量表,面谈也是评估与诊断的重要手段之一。
面谈可以提供更加详细和个性化的信息,同时也有助于建立咨询师和客户之间的沟通和信任。
在面谈中,咨询师可以通过开放式和封闭式问题,进一步探索客户的问题和需求,并帮助他们更好地表达自己的情感和困扰。
此外,面谈还可以用来观察客户的非语言行为,如肢体语言、面部表情等,这些都是了解客户内心的重要线索。
除了面谈外,观察也是一种有效的评估工具。
观察可以帮助咨询师了解客户的行为模式和应对机制,进而对他们进行诊断和治疗。
观察可以在咨询师的办公室进行,也可以在客户的日常生活环境中进行。
通过观察客户的行为,咨询师可以判断他们的自控能力、情绪调节水平等。
此外,观察还可以帮助咨询师评估客户与他人的互动情况,如家庭关系、社交能力等,从而提供相应的咨询建议。
当然,在使用评估与诊断工具时,咨询师还应注意一些因素。
首先,咨询师需要对各种评估工具和诊断标准有所了解,确保选择合适的工具和方法。
其次,咨询师应注意保护客户的隐私和知情权,在使用评估工具前向客户详细解释测试目的和流程,并获得他们的同意。
评估双相障碍的工具
评估双相障碍的工具包括多种量表和问卷,其中最常用的是双相障碍诊断量表(Bipolar Disorder Checklist,BDC)。
BDC是一个包含11个问题的量表,用于评估双相障碍的症状和严重程度。
患者可以根据自己的情况回答每个问题,并且量表可以在短时间内完成。
除了BDC之外,还有其他一些评估工具,如双相障碍生活质量问卷(Bipolar Disorder Quality of Life Scale,BDQ)、双相障碍治疗满意度问卷(Bipolar Disorder Satisfaction with Treatment Scale,BDST)和双相障碍自我管理问卷(Bipolar Disorder Self-Management Scale,BDSM-IV)。
这些问卷可以用来评估患者的病情、生活质量、治疗满意度和自我管理能力。
除了以上问卷和量表之外,还有一些临床评估工具,如汉密尔顿抑郁量表(Hamilton Depression Scale,HAMD)和蒙哥马利抑郁量表(Montgomery Asberg Depression Scale,MADRS)。
这些量表可以用来评估患者的抑郁症状的严重程度。
PART 2 - PTB Core CommandsThe core functionality of PsychToolbox is a set of powerful scripts to show stimuli and collect responses. In this section we will cover visual display, auditory presentation, timing issues and response collection.Before we begin, two important pointers (you might want to make use of the more command when viewing the help – this was explained in PART 1):i) The Psychophysics Toolbox contains a number of components:help psychtoolboxii) The Psychophysics Toolbox includes a number of demo programs and tests. For a list, see help psyschdemos and help psychtests. For example, to get some information about your computer and its graphics speed:screentestTry out a number of the other tests. They are usually very informative. The demos are useful for copying bits of code if you are trying to do something similar. To get an idea of what sorts of things you can do, click on the PsychToolboxDemos option (after typing help psychtoolbox) and pick a few fun scripts (check the list, as the PC version has different versions), e.g.,DriftDemo, MovieDemo, PhaseDistortDemo, SpriteDemo, KbDemoiii) If you have not yet done so please type PsychJavaTrouble at the command line to add the Java library scripts.Now let’s move to Part2 by using cd to change into the appropriate directory:e.g., pwd % will show you where you are nowe.g., (cd W:\NITP\Lab2\Part2)While going through this tutorial it’s imperative that you look at the actual Matlab code in order to understand how scripts/functions work. e.g.,PracticeKeyPresses % to run (you might get an error% because of a PC bug here)edit PracticeKeyPresses % to look into the scripthelp PracticeKeyPresses % to get its help comments/usageVISUAL DISPLAYThe core of PTB display is to open a window, assign it to a pointer (which points to a screen), modify what’s in it and then send it to the screen. This is the basis of all images, animations etc. To do this we use the Screen command. You can see it work by running the DarkScreen.m script. DarkScreen % will flash a dark screen brieflyIf you look inside (either by “edit DarkScreen” OR “type DarkScreen”) you’ll see the sample usage. Let’s look at it closer:i) The first argument of Screen is ‘OpenWindow’. This is one of the sub-functions that Screen can perform. To see what other functions Screen can do try ‘help Screen’. But to see what the usage of ‘OpenWindow’ is you’ll need to use a question mark (?).Screen OpenWindow?Also check out the following… they’ll be usefulScreen CloseAll?help scaScreen Close?If you ever need to kill and experiment early or have a frozen screen you will need to first press ‘cntrl’ and the key ‘C’ simultaneously (this kills Matlab processes), then press return to clear the command line (which you may not be able to see still because it’s hidden behind your display), then type ‘sca’ and press return. NOTE: This does not work quite right on the PC for some display commands. In some cases if you press cntrl-shift-tab you’ll be able to get to process control and kill Matlab that way.ii) The second argument, screenNum, is a digit pointing to the screen that you want to send the output to. It is 0 (set in the first line), which means main screen. Other indices would be appropriate if your computer is connected to multiple display devices.Screen('screens') % should return 0Screen screens? % will tell you about the command usageiii) The third argument is color for the screen (it is 0, or black, here). There are two main color modes that you will probably use, 8-bit color and 32-bit color. 8-bit color means that the color information for each pixel is stored in an 8-bit (i.e. one byte) number, that is, a number ranging from 0 to 255. 32-bit color is actually usually uses only 24 bits (i.e. three bytes), one 8-bit number for the red, green and blue color channels. These numbers, each ranging between 0 and 255, together form an RGB triplet. The way that 8-bit color works is through a color lookup table (CLUT). The CLUT is a 256x3 matrix, each row containing an RGB triplet. When you display a color to the screen in 8-bit mode, the number you are writing is a reference to the CLUT entry. Drawing something with color 0 will draw it using the first entry of the CLUT, and so on. You can also use the RGB triplet instead of 0 (e.g., [0 0 0]).a=Screen('LoadCLUT',0);a(1,:) % will show you the first entry of the CLUT%% IF YOU TEST THE FOLLOWING LINE YOU’LL HAVE TO MANUALLY CLEAR THE SCREEN (CNTRL-C, RETURN, THEN TYPE sca and hit RETURN) %%wPtr = Screen(0,'OpenWindow',[0 0 0]) % triplet usageChange the 0 to something else (e.g., 0 255 0) in DarkScreen – it won’t change the back ground! Why? We’ll get to it on the next page!iv) The fourth argument is rect, which specifies position (and thus size). It is a set of rectangularcoordinates [x1 y1 x2 y2] specifying the upper left (x1, y1) and lower right (x2, y2)coordinates of a rectangle. The origin (0, 0) of the screen is in the upper left, so y increases from the top to the bottom of the screen, and x increases from left to right. When copying parts of windows, displaying images, and so on, you will always give the position on the screen in terms of a rect.You can also get the size of your screen using ‘WindowSize’ (the whole screen by default): [width, height]=Screen('WindowSize', 0);Then, you could compute the coordinates of the center of the screen:xcenter = width/2; ycenter = height/2It is useful to know the coordinates of the center of the screen since you will often be drawing stimuli relative to this point. Notice that in DarkScreen.m the size was hard-coded to be 50 x 50 x 1250 x 1024.v) The fifth argument is clrdepth. You can learn about it using the help for OpenWindow! So, how is the DarkScreen working? (look inside at code) It sets up the window. Gets the index for black and white colors using BlackIndex and WhiteIndex (look these up using help). Then it creates a Rectangle at the pointer (wPtr) and assigns a color to it. Finally it “flips” it – which means send to screen buffer (i.e., displays it, while synchronizing to the screen’s refresh rate). This is the core usage of Screen to draw an image to screen. Notice that at the end of the script we “CLOSE” the screen and reveal the cursor. This is the full protocol for displaying items to screen.Also note that this code actually shows two rectangles (first black and then white). The color for the shapes is set separately from the color for the background. This is why changing color in the original ‘OpenWindow’ call does not affect what you see. The “rectangles” fill the whole background. If you comment out the line starting with ‘black’ and change the color in the Screen call to [0 255 0] – the background should now change green because you’ve eliminated the color assignment and PTB toolbox color defaults are to use the last-called color!USES OF SCREENHere are a few things to try by modifying DarkScreen and rerunning… note that when you change DarkScreen, do not DELETE lines of code. Generally a bad idea! Instead, just comment out (using %) the lines you don’t want and add a new line immediately following!AUDIO PRESENTATIONSometimes you’ll want to play sound instead of or in addition to showing visual displays. There are built in function to do this, “sound” in Matlab and also “wavplay” (use “help” to learn what these are). In PTB3 the sounddriver is called PsychPortAudio. It is superior to other sound functions and is recommended. It (and wavplay) can be used asynchronously. This means that you can call the function to begin playing a sound, and then control will be returned immediately to the program so you can do other things while the sound is playing. See “help PsychPortAudio” for an overview.You can change the pitch of your sound by changing f. The way musical tones work is that every time you double the frequency, the tone increases by one octave. Most musical instruments are tuned to a reference A note of 440 Hz.Vectors played by the sound function must be in the range of –1 to 1. Since our sine wave oscillates between these extremes, it will be played at the full volume. To decrease the volume, we need to decrease the amplitude of the sine wave.You will notice that decreasing the amplitude of the sound vector does not make the sound be perceived as half as loud. It is possible to modulate the volume of the sound in time by slowly modulating the amplitude of the signal. For example, if we want to modulate the volume at a frequency of 1 Hz, we could multiply our original sound vector by an appropriate function:modf = 1; y=y.*(sin(2*pi*modf*t)+1)/2; sound(y,fs);You can see what this wave looks like by plotting it:plot(t,y)You can try out the stereo (the machines in the lab are mono, though):y1=sin(2*pi*f*t).*(sin(2*pi*modf*t)+1)/2; % channel 1y2=sin(2*pi*f*t).*(sin(2*pi*modf*t+pi)+1)/2; % channel 2sound([y1;y2]',fs) % one channel per row = stereoSome other waveforms you might want to try are square waves:y=sign(y); plot(y(1:2000)); sound(y,fs)and sawtooth waves:y=mod(1:fs*d,fs/f)*f/fs; plot(y(1:2000)); sound(y,fs)TIMINGBefore dealing with response collection, let’s briefly consider a few key issues in stimulus control. The first of these is timing. Timing becomes when, for instance, the time to load a stimulus is longer than the time for which it is supposed to be presented!Two helpful tools for controlling timing are the functions GetSecs and WaitSecs(x). The former returns the number of seconds that have passed since last reboot. The latter will pause for x seconds. You can use these in a loop structure to adjust the presentation of your stimuli: waittime = 2.5; % time to wait (in seconds) start_time = GetSecs; % get time stamp%(e.g., start of a block) while GetSecs-start_time < waittime; DO SOMETHING; endThis code will DO SOMETHING (e.g., display a stimulus, wait for a response, kill some time if you need to adjust your timing) for 2.5 sec. You can also get an idea of how fast your computer runs using the following:times=zeros(1,10000);for i=1:10000; times(i)=GetSecs; endplot(times) % should show a linear increaseplot(diff(times)) % will show the difference betweenconsecutive iterations of loopThe y-axis in the last plot is in seconds. So you can see that though fast, the iterations do take time. This is helpful when timing for instance how long it takes to draw a complicated image or animation. The following script will test the timing on your computer (you can copy and paste directly into Matlab). Press any key once the circles are on screen.[w,rect] = Screen(0,'OpenWindow',[0 0 0]);n=500; % number of circles to drawr=500; % radius of circletimes=zeros(1,n);x=rand(1,n)*rect(3);y=rand(1,n)*rect(4);colors = 256*rand(n,3);start_time = GetSecs;for i=1:nScreen(w,'FillOval',colors(i,:),[x(i)-r,y(i)-r,x(i)+r,y(i)+r]);Screen(w,'Flip');times(i) = GetSecs-start_time;endScreen(w,'Close')Now use the plot(diff(times)) command to see the diff(times) measure. What is the average drawing time? You can now make the circle radius bigger (you can decrease n as well to make it go quicker) – does it change the drawing time?Displaying images is a little more time consuming than drawing objects.img=imread('martini2.jpg');[sy sx sz] = size(img);[w,rect] = Screen(0,'OpenWindow',[0 0 0]);n=500; % number of images to drawtimes=zeros(1,n);x=rand(1,n)*rect(3); %on a Mac you can draw outside the screen bordersy=rand(1,n)*rect(4);%x=rand(1,n)*(rect(3)-sx)+sx/2; % on a PC you can’t%y=rand(1,n)*(rect(4)-sy)+sy/2;start_time = GetSecs;for i=1:nScreen('PutImage',w,img,[x(i)-sx/2,y(i)-sy/2,x(i)+sx/2,y(i)+sy/2]);Screen('Flip',w);times(i) = GetSecs-start_time;endScreen(w,'Close')Now do plot(diff(times),'.').Notice the distribution of drawing times. How does resizing the image affect the drawing times? Add the linessx=sx/2; sy=sy/2;after the second line of the above code and rerun. Try to double the size instead of halving it.RESPONE COLLECTIONThere are two components to response collection. One is hardware (setting up the device) and the other is software (registering key presses). Setting up devices was covered in a previous section. Indeed in setting up the experiment one must specify the device that will be used to collect responses (it does not have to be the same one that the experimenter uses to control the main computer). You can use the kind of script that’s present in hid_probe.m to do this.The main function used to collect responses is KbCheck.m:[keyIsDown,secs,keyCode] = KbCheck;keyIsDown is true if any key is pressed. secs is the time of the keypress, and keyCode is an array of all the possible key values. If key number 2 is depressed, then keyCode(2) will be true. Multiple keys can be pressed at once, and keyCode will register them all.The best way to figure out which key code corresponds to which key is to run the KbDemo program. It outputs the internal code that’s associated with each key-press on a keyboard (the standard device for responses). Upon running this functions and pressing keys you will get responses like:KbDemo1 of 4. Testing KbCheck and KbName: press a key to see its number.Press the escape key to proceed to the next demo.You pressed key 32 which is 3#You pressed key 38 which is 9(You pressed key 37 which is 8*You pressed key 33 which is 4$ …This shows the index of the key (in the array keyCode) and its internal code. Notice that number keys are coded with both the digit and the secondary function. To set up response collection, there are at least three steps to consider:KbCheck is the primary function to collect responses, but there are others. For other PTB functions type help KbCheck (at the bottom you’ll see some related scripts such as KbWait, GetChar and FlushEvents). KbWait is particularly useful if you need insert pauses or a delay on response collection. FlushEvents(‘keyDown’) is good to run after each collected response in order to flush the queue.You can also get input from devices other than the keyboard. The obvious way is to specify different devices to different variables and specify these in the KbCheck call. Note that we didn’t do that in the above example because we were using the keyboard for response collection (the default of KbCheck).[keyIsDown,secs,keyCode]=KbCheck(inputDevice);In some cases there are unique scripts to go with devices. Look up the GetMouse script to see one example. It works much the same way the KbCheck function does, returning the instantaneous state of the mouse. Try modifying the above program to read the mouse input. Note that since GetMouse doesn’t return a secs argument, you’ll have to issue a GetSecs command immediately upon getting a positive click from the mouse.FINALLY – SAVING YOUR DATA!You need to save your data as you run your script. Typically you’ll do this by assigning variables of interest into a matrix after each collected response (see examples of this in the demo scripts in Part 3 and 4). Run getResponse to execute the following lines of code:outVars = []; trialNumber = 1;fprintf('\npress any key…\n');FlushEvents('keyDown');keyIsDown = 0;startTimer = GetSecs;while ~keyIsDown[keyIsDown,secs,keyCode] = KbCheck;endOnce the script completes type the following to retrieve some info about your response.secs - startTimer % this is your response time in sec keyIsDown % 1 now b/c a resp has been registered KbName(find(keyCode)) % should show you which key you pressed% finally save the response press and time into our matrix variableoutVars(trialNumber,1) = find(keyCode);outVars(trialNumber,2) = secs-startTimer;% type outVars to see what you’ve done:format bankoutVars% your output will look something like this showing you the% keyCode associated with your keypress and your RT in seconds outVars =32.00 0.41Finally – we need to save this info to a text file. Open a file as follows:subjectID = 'dummy';logfile=sprintf('%s_data.txt',subjectID);fprintf('A log of this session will be saved to %s\n',logfile); fid=fopen(logfile,'a');if fid<1,error('could not open logfile!');endwrite the data to the file:fprintf(fid,'KEYpress\tRespTime');fprintf(fid,'\n');fprintf(fid,'%d\t%0.2f',outVars(trialNumber,:));and close the file.fclose(fid);Open your file to see how the data have been saved.edit dummy_data.txtNote that you only need to call the fopen and fclose commands at the outset and at the end of your experiment. The file will remain ‘open’ for writing during the experiment. ADVANCED: If you really want to be careful – save both a *mat and *txt version of the file (the former can be done using the save command), and include a try-catch statement in your code so that if the script crashes, the opened fid is closed properly.And voila… you’re ready to code experiments!。