表
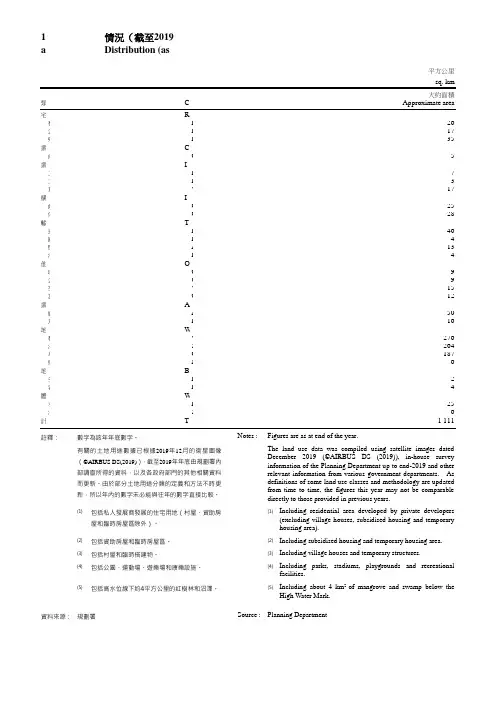
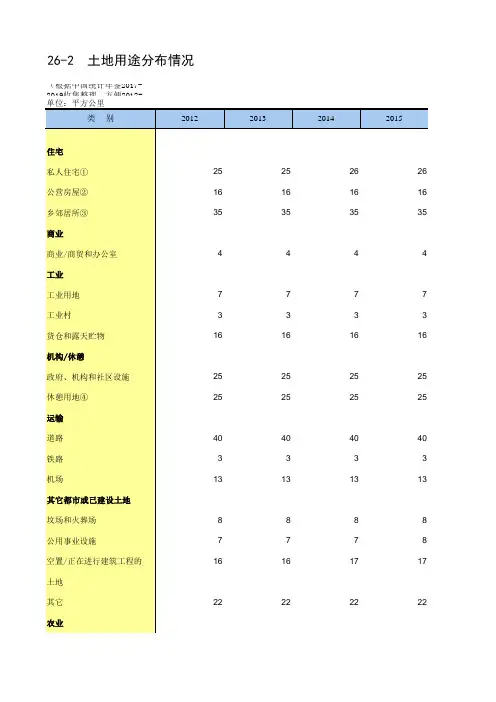
土地用途的分布
1T
情La況nd(U截sa至ge2019
a
Distribution (as
類住 宅
私 公 商鄉 業 工商 業 工 工 機貨 構 政 運休 輸 道 鐵 機 其港 他 墳 公 空 農其 業 農 林魚 地 林 灌 草 荒紅 地 劣 水岩 體 水 總河 計
註釋:
C
R P P R
C C
I I I W
大約面積 Approximate area
பைடு நூலகம்26 17 35
5
7 3 17
25 28
46 4
13 4
9 9 15 12
50 16
276 264 187
6
2 4
25 6
1 111
Notes :
Figures are as at end of the year.
The land use data was compiled using satellite images dated December 2019 (©AIRBUS DS (2019)), in-house survey information of the Planning Department up to end-2019 and other relevant information from various government departments. As definitions of some land use classes and methodology are updated from time to time, the figures this year may not be comparable directly to those provided in previous years.