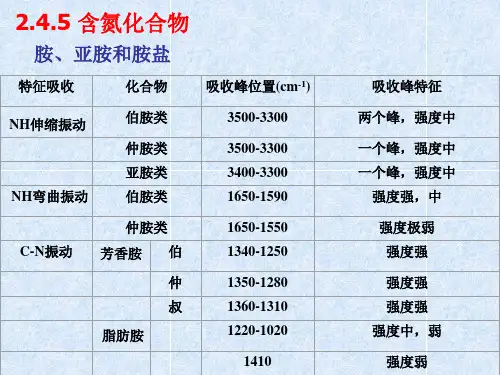
红外图谱数据库及其检索
- 格式:pdf
- 大小:353.55 KB
- 文档页数:6
红外图谱解析¾红外光谱的分区¾红外标准谱图及检索¾萨特勒红外谱图集是较常用的谱图集,数据库,网上资源¾红外图谱的解析步骤¾红外图谱的解析实例红外光谱的分区4000-2500cm-1:这是X-H单键的伸缩振动区。
2500-2000cm-1:此处为叁键和累积双键伸缩振动区2000-1500cm-1:此处为双键伸缩振动区1500-400cm-1:此区域主要提供C-H弯曲振动的信息红外图谱的解析步骤1.检查光谱图是否符合要求:基线的透过率在90%左右;最大的吸收峰不应成平头峰。
2.了解样品来源、样品的理化性质,其他分析的数据,样品重结晶溶剂及纯度。
3. 排除可能出现的“假谱带”:常见的有水的吸收:在3400、1640和650cm-1。
CO的吸收:在2350和667cm-1。
2还有处理样品时重结晶的溶剂吸收。
合成产品中未反应完的反应物或副产物等都可能会带入样品而引起干扰。
在KBr压片过程中可能有水混入试样。
5.确定分子所含基团及化学键的类型:物质红外光谱是各种基团红外光谱的叠加。
可以由特征谱带的位置、强度、形状指配所含基团或化学键的类型。
基团的特征吸收带会在一定范围内位移。
分析谱图常按:“先官能团区后指纹区,先强峰后次强峰和弱峰,先否定后肯定”的原则分析图谱,指配峰的归属。
4000∼1500cm-1范围的官能团区可以判断化合物的种类。
1500 ∼400cm-1范围的“指纹区”能反映整个分子结构的特点,两个化合物若“指纹区”图谱完全一样就是同一个化合物。
如苯环的存在可以由3100 ∼3000、∼1600、∼1580、∼1500、∼1450cm-1的吸收带判断,而苯环上取代类型要用900~650cm-1区域的吸收带判断吸收峰并非要全部解释清楚,先强峰后次强峰和弱峰,一般只要解释一些较强的峰,但是对一些特征性的弱峰也不可忽视。
在分析谱图时,只要在该出现的区城没有出现某基团的吸收,就可以否定此基团的存在,否定是可靠的。
红外谱图分析方法总结1. 简介红外(Infrared)分析技术是一种非常重要的分析测试方法,它可以用来研究物质的结构、组成、性质及相互作用等方面的信息。
红外谱图分析方法通过测量物质对红外辐射的吸收和散射,并结合相关的理论和数据库,得出样品的红外光谱图。
本文将总结常用的红外谱图分析方法。
2. 样品制备在进行红外谱图分析之前,首先需要将待测的样品制备成适合红外光谱测量的形式。
常见的样品制备方法包括固体试样法、液体试样法和气相试样法。
•固体试样法:将固体样品粉碎并与适量的无水氯化钾或氯化钠混合,制成样品块。
也可以使用压片法,将粉末样品压制成片。
•液体试样法:将液体样品滴在透明基片上,使其干燥后形成薄膜。
也可以将液体样品放入适合的红外吸收池中进行测量。
•气相试样法:将气体样品填充到气室中,通过红外吸收池进行测量。
3. 红外光谱测量仪器进行红外谱图分析需要使用红外光谱测量仪器。
常见的红外光谱测量仪器有红外光谱仪和红外光谱仪。
红外光谱仪主要由光源、干涉仪、样品室、探测器和数据采集系统等组成。
它通过生成红外光源并使其通过样品,然后测量样品对不同波长的红外光的吸收情况。
常用的红外光谱仪有傅立叶红外光谱仪(FTIR)和分散式红外光谱仪。
红外光谱仪是一种通过获取光谱仪的光栅分散红外光的仪器。
它通过将红外光分散为不同的波长,并通过探测器检测各个波长的红外光强度,得到红外光谱图。
4. 红外谱图解释红外谱图是指样品在红外区域内的吸收峰和吸收强度的图谱。
通过研究红外谱图,可以得到样品的结构和组成等信息。
红外谱图的解释可以从以下几个方面进行:•吸收峰的位置:吸收峰的位置与样品中存在的化学键相关。
不同化学键对应着不同波数的吸收峰。
•吸收峰的强度:吸收峰的强度与样品中某种化学键的含量相关。
吸收峰的强度越高,表示样品中该化学键的含量越多。
•布拉格方程:通过使用布拉格方程可以计算吸收峰的波数。
•参考谱库:借助谱库中的红外光谱标准数据,可以将待测样品的红外光谱与已知物质进行比对和鉴定。

【名称】ChemExper化学品目录CDD (包括MSDS、5000红外谱图)【资源简介】The database contains currently more than 70 000 chemicals, 16000 MSDS, 5000 IR spectra and more than 20 suppliers. It is the only chemical database that lets you SUBMIT your own data!【检索途径】You can find a chemical by its molecular formula, IUPAC name, common name, CAS number, catalog number, substructure or physical characteristics【地址】.chemexper.be/【名称】 (NMR谱图数据库及NMR谱图预测)【资源简介】This is a web-based approach implementing a new java applet that enables to assign a chemical structure to the corresponding NMR spectrum by simply drawing lines between atoms and automatically characterized signals.This NMR predictor allows to predict the spectrum from the chemical structure based on Spinus (Structure-based Predictions In NUclear magnetic resonance Spectroscopy), which is an on-going project for the development of structure-based tools for fast prediction of NMR spectra developed by Gasteiger (www2.chemie.uni-erlangen.de/services/spinus/index.html). SPINUS - WEB currently accepts molecular structures via a Java molecular editor, and estimates 1H NMR chemical shifts.【地址】/【名称】BioMagResBank (BMRB): 多肽、蛋白质、核酸等的核磁共振数据存储库【资源简介】IntroductionBioMagResBank (BMRB) is the publicly-accessible depository for NMR results from peptides, proteins, and nucleic acids recognized by the International Society of Magnetic Resonance and by the IUPAC-IUBMB-IUPAB Inter-Union Task Group on the Standardization of Data Bases of Protein and Nucleic Acid Structures Determined by NMR Spectroscopy. In addition, BMRB provides reference information and maintains a collection of NMR pulse sequences and computer software for biomolecular NMR. Access to data in BMRB is free directly from its web site (URL ) and ftp site () and will remain so as public funding permits. The concept of a biomolecular NMR data bank developed under a five-year research grant awarded to the University of Wisconsin-Madison from the National Library of Medicine, National Institutes of Health. This grant was phased out after that period, and a Request for Applications was issued by the NIH for future support of this activity. BMRB at t he University of Wisconsin-Madison won this competition, has been supported since 1 September 1996 by the National Library of Medicine, NIH under grant 1 P41 LM05799. The current award for five years expires on 31 August 2004.AimsIn collaboration with the Protein Data Bank (PDB, Brookhaven National Laboratories) and Nucleic Acid Data Bank (NDB, Rutgers University), BMRB aims to develop into the collection site for structural NMR data in proteins and nucleic acids. Steps are being taken at BMRB to achieve this capability, which will include transmission of all relevant data to the PDB and NDB collections. In addition, BMRB has the goal of archiving NMR-specific data including assigned chemical shifts, J-couplings, relaxation rates, and chemical information derived from NMR investigations (for example, hydrogen exchange rates and pKa values). In developing these collections BMRB intends to be responsive to the needs and priorities of the scientific community. The operating policy at BMRB is monitored and shaped by its Advisory Board which meets once each year to review progress and set priorities. The Advisory Board is composed of representatives from laboratories that originate and/or use data within the BMRB p urview.【地址】/【名称】NIST Chemistry WebBook【资源简介】The November 1998 release of The NIST WebBook is the fifth edition of the NIST Chemistry WebBook. It contains thermochemical data for over 5000 organic and small inorganic compounds, reaction thermochemistry data for over 8000 reactions, IR spectra for over 5000 compounds, mass spectra for over 10,000 compounds, electronic / vibrational spectra for over 3000 compounds, constants ofdiatomic molecules (spectroscopic data) for over 600 compounds, Ion energetics data for over 14,000 compounds, and thermophysical property data for 16 fluids There are many avenues for searching the database. Structures are given for most species, as well as common and commercial names.【检索途径】Formula NamePartial formulaCAS registry numberStructure basedIon energeticsVibrational and electronic spectraMolecular weightAuthor【地址】/chemistry【名称】粉末衍射模式数据库PowBase (Powder Patterns Database)【资源简介】PowBase is a "minimum database" of constant wavelength powder patterns. The data files (zipped) contain either a CIF file or a .dat file (the latter can be viewed by WinPLOTR, option INSTRM=0).The search output produces entry numbers with hyperlink to the raw data (zipped files), the formula, wavelength, a comment, and a reference with email address. Some pertinent hyperlinks may be added, and also a VRML 3D view, sometimes.【地址】 sdpd.univ-lemans.fr/powbase/【名称】有机化学所:化学数据库【资源简介】有机化学研究所的化学专业数据库由多个数据库组成,注册后可免费使用。
红外光谱图解析一、分析红外谱图(1)首先依据谱图推出化合物碳架类型,根据分子式计算不饱和度。
公式:不饱和度=F+1+(T-O)/2其中:F:化合价为4价的原子个数(主要是C原子);T:化合价为3价的原子个数(主要是N原子);O:化合价为1价的原子个数(主要是H原子)。
F、T、O分别是英文4,3 1的首字母,这样记起来就不会忘了举个例子:例如苯(C6H6),不饱和度=6+1+(0-6)/2=4,3个双键加一个环,正好为4个不饱和度。
(2)分析3300~2800cm^-1区域C-H伸缩振动吸收,以3000 cm^-1为界,高于3000cm^-1为不饱和碳C-H伸缩振动吸收,有可能为烯、炔、芳香化合物吗,而低于3000cm^-1一般为饱和C-H伸缩振动吸收。
(3)若在稍高于3000cm^-1有吸收,则应在2250~1450cm^-1频区,分析不饱和碳碳键的伸缩振动吸收特征峰,其中:炔—2200~2100 cm^-1烯—1680~1640 cm^-1芳环—1600、1580、1500、1450 cm^-1若已确定为烯或芳香化合物,则应进一步解析指纹区,即1000~650cm^-1的频区,以确定取代基个数和位置(顺反,邻、间、对)。
(4)碳骨架类型确定后,再依据其他官能团,如C=O,O-H,C-N 等特征吸收来判定化合物的官能团。
(5)解析时应注意把描述各官能团的相关峰联系起来,以准确判定官能团的存在,如2820、2720和1750~1700cm^-1的三个峰,说明醛基的存在。
解析的过程基本就是这样吧,至于制样以及红外谱图软件的使用,一般的有机实验书上都有比较详细的介绍的。
二、记住常见常用的健值1.烷烃3000-2850 cm-1C-H伸缩振动1465-1340 cm-1C-H弯曲振动一般饱和烃C-H伸缩均在3000 cm-1以下,接近3000 cm-1的频率吸收。
2.烯烃3100~3010 cm-1烯烃C-H伸缩1675~1640 cm-1C=C伸缩烯烃C-H面外弯曲振动(1000~675cm^1)。

3.2.4. 红外谱图数据库服务介绍:本数据用户可以在数据库中检索指定化合物的谱图,也可以根据谱图/谱峰数据检索相似的谱图,以协助进行谱图鉴定。
用户可以通过IE 浏览器显示谱图,特别提示:用户浏览器请勿禁用java applet 功能,否则可能导致谱图不能正常显示。
名词与概念:40403.2.4.1 相似谱图检索——输入谱峰检索基本原理用户输入某个谱图的特征谱峰数据,并指定命中谱图与输入的提问谱图的最低相似度、容许误差范围等参数。
系统根据这些参数,先进行初步筛选,得到候选红外谱图,然后将用户的提问谱数据与数据库中的所有候选红外谱图的特征谱峰数据进行逐一比较,找到与用户提问谱图相似的谱图,并将结果按照相似度递减顺序排列供用户对照。
第一步:谱峰数据输入输入的用户提问谱图的每个特征谱峰数据都包括4项,谱峰位置、谱峰透过率、峰宽、峰差。
系统总是假定用户提问谱图采用透过率T 来表示。
峰差(%半峰宽(cm-1页面的第一部分是输入谱峰的列表,供用户校对数据。
每个谱峰后面有“不可丢失”选项,勾选此选项,则要求检索命中的谱图中必须含有此特征峰,不包含这类特征峰的谱图,即使其他谱峰都能匹配,系统也不会认为它是合格的候选谱图。
如果用户不设定任何一个谱峰为不可丢失,则系统认为任何单个峰没有匹配时,都不影响候选谱图的筛选。
1. 谱图匹配模式,是指谱图筛选过程中匹配候选谱图的模式,单选,有3种模式可以选择:强峰匹配、官能团匹配、全峰匹配。
由于红外谱图的曲线上存在许多大小不同的谱峰,部分非常微弱的峰通常不用来作为鉴定的根据,一般只观察比较强的特征谱峰,因此强峰匹配在谱图筛选过程中只考察谱图的强峰,只要谱图的强峰索引与输入的提问谱图的强峰索引匹配,则将此谱图作为候选谱图。
官能团匹配是将输入谱峰的数据按照红外解析的规律,判断该谱图对应的官能团,生成官能团索引,系统根据官能团索引筛选出候选谱图。
全峰匹配跟强峰匹配的区别在于全峰匹配筛选过程将考察所有谱峰。
【名称】ChemExper化学品目录CDD (包括MSDS、5000张红外谱图)【资源简介】The database contains currently more than 70 000 chemicals, 16000 MSDS, 5000 IR spectra and more than 20 suppliers. It is the only chemical database that lets you SUBMIT your own data!【检索途径】You can find a chemical by its molecular formula, IUPAC name, common name, CAS number, catalog number, substructure or physical characteristics【地址】http://www.chemexper.be/【名称】 (NMR谱图数据库及NMR谱图预测)【资源简介】This is a web-based approach implementing a new java applet that enables to assign a chemical structure to the corresponding NMR spectrum by simply drawing lines between atoms and automatically characterized signals.This NMR predictor allows to predict the spectrum from the chemical structure based on Spinus (Structure-based Predictions In NUclear magnetic resonance Spectroscopy), which is an on-going project for the development of structure-based tools for fast prediction of NMR spectra developed by Gasteiger (http://www2.chemie.uni-erlangen.de/services/spinus/index.html). SPINUS - WEB currently accepts molecular structures via a Java molecular editor, and estimates 1H NMR chemical shifts.【地址】/【名称】BioMagResBank (BMRB): 多肽、蛋白质、核酸等的核磁共振数据存储库【资源简介】IntroductionBioMagResBank (BMRB) is the publicly-accessible depository for NMR results from peptides, proteins, and nucleic acids recognized by the International Society of Magnetic Resonance and by the IUPAC-IUBMB-IUPAB Inter-Union Task Group on the Standardization of Data Bases of Protein and Nucleic Acid Structures Determined by NMR Spectroscopy. In addition, BMRB provides reference information and maintains a collection of NMR pulse sequences and computer software for biomolecular NMR. Access to data in BMRB is free directly from its web site (URL ) and ftp site () and will remain so as public funding permits. The concept of a biomolecular NMR data bank developed under a five-year research grant awarded to the University of Wisconsin-Madison from the National Library of Medicine, National Institutes of Health. This grant was phased out after that period, and a Request for Applications was issued by the NIH for future support of this activity. BMRB at t he University of Wisconsin-Madison won this competition, has been supported since 1 September 1996 by the National Library of Medicine, NIH under grant 1 P41 LM05799. The current award for five years expires on 31 August 2004.AimsIn collaboration with the Protein Data Bank (PDB, Brookhaven National Laboratories) and Nucleic Acid Data Bank (NDB, Rutgers University), BMRB aims to develop into the collection site for structural NMR data in proteins and nucleic acids. Steps are being taken at BMRB to achieve this capability, which will include transmission of all relevant data to the PDB and NDB collections. In addition, BMRB has the goal of archiving NMR-specific data including assigned chemical shifts, J-couplings, relaxation rates, and chemical information derived from NMR investigations (for example, hydrogen exchange rates and pKa values). In developing these collections BMRB intends to be responsive to the needs and priorities of the scientific community. The operating policy at BMRB is monitored and shaped by its Advisory Board which meets once each year to review progress and set priorities. The Advisory Board is composed of representatives from laboratories that originate and/or use data within the BMRB p urview.【地址】/【名称】NIST Chemistry WebBook【资源简介】The November 1998 release of The NIST WebBook is the fifth edition of the NIST Chemistry WebBook. It contains thermochemical data for over 5000 organic and small inorganic compounds, reaction thermochemistry data for over 8000 reactions, IR spectra for over 5000 compounds, mass spectra for over 10,000 compounds, electronic / vibrational spectra for over 3000 compounds, constants ofdiatomic molecules (spectroscopic data) for over 600 compounds, Ion energetics data for over 14,000 compounds, and thermophysical property data for 16 fluids There are many avenues for searching the database. Structures are given for most species, as well as common and commercial names.【检索途径】Formula NamePartial formulaCAS registry numberStructure basedIon energeticsVibrational and electronic spectraMolecular weightAuthor【地址】/chemistry【名称】粉末衍射模式数据库PowBase (Powder Patterns Database)【资源简介】PowBase is a "minimum database" of constant wavelength powder patterns. The data files (zipped) contain either a CIF file or a .dat file (the latter can be viewed by WinPLOTR, option INSTRM=0).The search output produces entry numbers with hyperlink to the raw data (zipped files), the formula, wavelength, a comment, and a reference with email address. Some pertinent hyperlinks may be added, and also a VRML 3D view, sometimes.【地址】 http://sdpd.univ-lemans.fr/powbase/【名称】上海有机化学所:化学数据库【资源简介】上海有机化学研究所的化学专业数据库由多个数据库组成,注册后可免费使用。