利用MATLAB生成Word和Excel文档
- 格式:ppt
- 大小:1.58 MB
- 文档页数:1127

MATLAB与其他软件的交互使用杨文霞matlab提供了与microsoft公司的office系列软件的交互使用和便利的数据传输,使得用户能在word环境、Powerpoint中自如的使用matlab进行计算,为用户营造集文字处理、科学计算和工程设计于一体的工作环境。
本章介绍在数学建模和数学实验中最常用的两个软件Word及Excel与matlab的交互使用和数据传输。
1Word中使用Matlab在Word中使用Matlab主要通过matlab的Notebook功能实现的。
Notebook使得用户能够在word环境中使用matlab,使用户能将文字处理与科学计算放在一个工作环境中,方便用户使用。
Matlab制作的m-book文档不仅拥有ms-word的全部功能,而且具备matlab的数学结算能力。
在word中使用matlab的基本步骤为:(1)notebook的安装在command window中,键入:notebook,运行后,会出现如下界面:Welcome to the utility for setting up the MATLAB Notebookfor interfacing MATLAB to Microsoft WordChoose your version of Microsoft Word:[1] Microsoft Word 97[2] Microsoft Word 2000[3] Microsoft Word 2002 (XP)[4] Exit, making no changes选择适合的matlab版本后,Microsoft Word Version: 3Notebook setup is complete.此后,会打开一个word文档:即表示安装结束。
1.notebook的启动(1)从word中启动notebook打开一个word空白文档后,在文档的右边将会出现一个新建文档的选项:在模板选项下,选择:本机上的模板,则会出现如下对话框:选择m-book.dot模板。

MATLAB统计分析与应用:40个案例分析ISBN:00849 分类号:C819 /115 出版社:北京航空航天大学出版社【内容简介】本书从实际应用的角度出发,以大量的案例详细介绍了MATLAB环境下的统计分析与应用。
本书主要内容包括:利用MATLAB制作统计报告或报表;从文件中读取数据到MATLAB;从MATLAB中导出数据到文件;数据的平滑处理、标准化变换和极差归一化变换;生成一元和多元分布随机数;蒙特卡洛方法;参数估计与假设检验;Copula理论及应用实例;方差分析;基于回归分析的数据拟合;聚类分析;判别分析;主成分分析;因子分析;图像处理中的统计应用等。
本书可以作为高等院校本科生、研究生的统计学相关课程的教材或教学参考书,也可作为从事数据分析与数据管理的研究人员的参考用书。
【目录】第1章利用MATLAB生成Word和Excel文档组件对象模型(COM)1.1.1 什么是CoMCoM接口MATLAB中的ActiveX控件接口技术actxcontrol函数actxcontrollist函数actxcontrolselect函数actxserver函数利用MATLAB调用COM对象调用actxserver函数创建组件服务器案例1:利用MATLAB生成Word文档调用actxserver函数创建Microsoft Word服务器建立Word文本文档插入表格插入图片保存文档完整代码案例2:利用MATLAB生成Excel文档调用actxserver函数创建Microsoft Excel服务器新建Excel工作簿获取工作表对象句柄插入、复制、删除、移动和重命名工作表页面设置选取工作表区域设置行高和列宽合并单元格边框设置设置单元格对齐方式写入单元格内容插入图片保存工作簿完整代码第2章数据的导入与导出案例3:从TXT文件中读取数据利用数据导入向导导入TXT文件调用高级函数读取数据调用低级函数读取数据案例4:把数据写入TXT文件调用dlmread函数写入数据调用fprintf函数写入数据案例5:从Excel文件中读取数据利用数据导入向导导入Excel文件调用xlsread函数读取数据案例6:把数据写入Excel文件第3章数据的预处理案例7:数据的平滑处理smooth函数smoothts函数medfiltl函数案例8:数据的标准化变换标准化变换公式标准化变换的MATLAB实现案例9:数据的极差归一化变换极差归一化变换公式极差归一化变换的MATLAB实现第4章生成随机数案例10:生成一元分布随机数均匀分布随机数和标准正态分布随机数 RandStream类常见一元分布随机数任意一元分布随机数案例11:生成多元分布随机数案例12:蒙特卡洛方法有趣的蒙提霍尔问题抽球问题的蒙特卡洛模拟用蒙特卡洛方法求圆周率用蒙特卡洛方法求积分街头骗局揭秘第5章参数估计与假设检验案例13:常见分布的参数估计案例14:正态总体参数的检验……第6章 Copula理论及应用实例第7章方差分析第8章数据拟合第9章聚类分析第10章判别分析第11章主成分分析第12章因子分析附录A 图像处理中的统计应用案例附录B MATLAB统计工具箱函数大全参考文献。
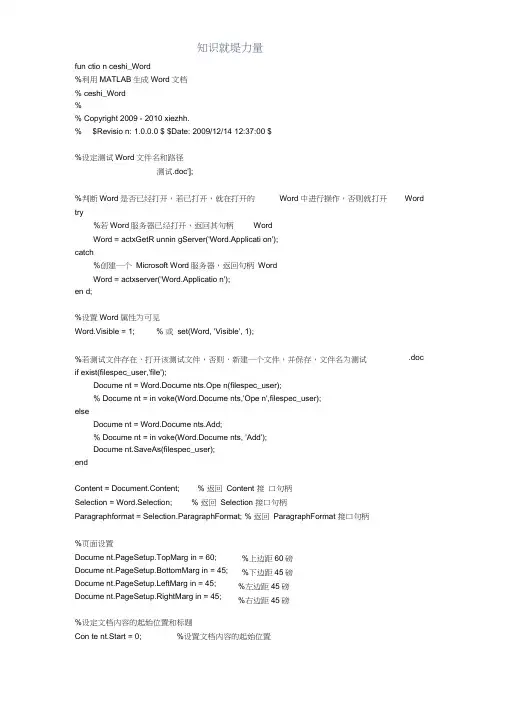
fun ctio n ceshi_Word%利用MATLAB生成Word文档% ceshi_Word%% Copyright 2009 - 2010 xiezhh.% $Revisio n: 1.0.0.0 $ $Date: 2009/12/14 12:37:00 $%设定测试Word文件名和路径测试.doc'];%判断Word是否已经打开,若已打开,就在打开的Word中进行操作,否则就打开try%若Word服务器已经打开,返回其句柄WordWord = actxGetR unnin gServer('Word.Applicati on');catch%创建一个Microsoft Word服务器,返回句柄WordWord = actxserver('Word.Applicatio n');en d;%设置Word属性为可见Word.Visible = 1; % 或set(Word, 'Visible', 1);%若测试文件存在,打开该测试文件,否则,新建一个文件,并保存,文件名为测试if exist(filespec_user,'file');Docume nt = Word.Docume nts.Ope n(filespec_user);% Docume nt = in voke(Word.Docume nts,'Ope n',filespec_user);elseDocume nt = Word.Docume nts.Add;% Docume nt = in voke(Word.Docume nts, 'Add');Docume nt.SaveAs(filespec_user);endContent = Document.Content; % 返回Content 接口句柄Selection = Word.Selection; % 返回Selection 接口句柄Paragraphformat = Selection.ParagraphFormat; % 返回ParagraphFormat 接口句柄%页面设置Docume nt.PageSetup.TopMarg in = 60;Docume nt.PageSetup.BottomMarg in = 45;Docume nt.PageSetup.LeftMarg in = 45;Docume nt.PageSetup.RightMarg in = 45;%设定文档内容的起始位置和标题Con te nt.Start = 0; %设置文档内容的起始位置Word .doc%上边距60磅%下边距45磅%左边距45磅%右边距45磅title ='试卷分析';Conten t.Text = title;%输入文字内容 Conten t.F on t.Size =16 ; %设置字号为16 Co nten t.Fo nt.Bold =4 ; %字体加粗 Con te nt.P aragraphs.Alig nment = 'wdAlig nParagraphCe nter :Select ion. TypeParagraph; xueqi = ' ( 2009— 2010 学年第一学期)’;Selection.Text = xueqi; % 在当前位置输入文字内容 Selectio n.Fo nt.Size = 12; % 设置字号为 12 Selectio n.Fo nt.Bold = 0; % 字体不加粗Tables = Docume nt.Tables.Add(Selectio n.Ra nge,12,9); %返回第1个表格的句柄DTI = Document.Tables.ltem(1); % 或 DTI = Tables; %设置表格边框DTI.Borders.OutsideLi neStyle = 'wdLi neStyleSi ngle'; DTI.Borders.OutsideLi neWidth = 'wdL in eWidth150pt'; DTI.Borders.I nsideLi neStyle = 'wdLi neStyleSi ngle'; DTI.Borders.I nsideLi neWidth = 'wdL in eWidth150pt'; DTI.Rows.Alig nment = 'wdAlig nRowCe nter';DTI.Rows.ltem(8).Borders.ltem(1).Li neStyle = 'wdL in eStyleNo ne'; DTI.Rows.ltem(8).Borders.lte m( 3).Li neStyle = 'wdL in eStyleNo ne';DTI.Rows.Item(11).Borders.Item(1).Li neStyle = 'wdLi neStyleNo ne'; DTI.Rows.ltem(11).Borders.ltem(3).Li neStyle = 'wdLi neStyleNo ne'; %设置表格列宽和行高column_width = [53.7736,85.1434,53.7736,35.0094,...35.0094,76.6981,55.1887,52.9245,54.9057];% 定义列宽向量row_height = [28.5849,28.5849,28.5849,28.5849,25.4717,25.4717,...32.8302,312.1698,17.8302,49.2453,14.1509,18.6792]; % 定义行高向量%通过循环设置表格每列的列宽 for i = 1:9DTI.Colu mn s.Item(i).Width = colu mn _width(i);%居中对齐Selectio n.Start = Conten t.e nd; %设定下面内容的起始位置%回车,另起一段 Selectio n.MoveDow n;%光标下移(取消选中)paragraphformat.Alig nment = 'wdAlig nParagraphCe nter : Select ion. TypeParagraph; %回车,另起一段 Select ion. TypeParagraph;%回车,另起一段Selection.Font.Size = 10.5; % 设置字号为 10.5%居中对齐%在光标所在位置插入一个12行9列的表格end%通过循环设置表格每行的行高for i = 1:12DTI.Rows.ltem(i).Height = row_height(i);end%通过循环设置每个单元格的垂直对齐方式for i = 1:12for j = 1:9DTI.Cell(i,j).VerticalAlig nment = 'wdCellAlig nV erticalCe nter'; endend%合并单元格DTI.Cell(1,4).Merge(DTI.Cell(1,5));DTI.Cell(2, 4).Merge(DTI.Cell(2, 5));DTI.Cell(3, 4).Merge(DTI.Cell(3, 5));DTI.Cell(4, 4).Merge(DTI.Cell(4, 5));DTI.Cell(5, 2).Merge(DTI.Cell(5, 5));DTI.Cell(5, 3).Merge(DTI.Cell(5, 6));DTI.Cell(6, 2).Merge(DTI.Cell(6, 5));DTI.Cell(6, 3).Merge(DTI.Cell(6, 6));DTI.Cell(5, 1).Merge(DTI.Cell(6, 1));DTI.Cell(7, 1).Merge(DTI.Cell(7, 9));DTI.Cell(8, 1).Merge(DTI.Cell(8, 9));DTI.Cell(9, 1).Merge(DTI.Cell(9, 3));DTI.Cell(9, 2).Merge(DTI.Cell(9, 3));DTI.Cell(9, 3).Merge(DTI.Cell(9, 4));DTI.Cell(9, 4).Merge(DTI.Cell(9, 5));DTI.Cell(10, 1).Merge(DTI.Cell(10, 9));DTI.Cell(11,5).Merge(DTI.Cell(11,9));DTI.Cell(12, 5).Merge(DTI.Cell(12, 9));DTI.Cell(11, 1).Merge(DTI.Cell(12, 4));Selection.Start = Content.end; % 设置光标位置在文档内容的结尾Select ion. TypeParagraph; %回车,另起一段Selection.Text ='主管院长签字:年月日';%输入文字内容Paragraphformat.Alig nment = 'wdAlig nParagraphRight'; % 右对齐Selection.MoveDown; % 光标下移%写入表格内容DTI.Cell(1,1).Range.Text ='课程名称';DTI.Cell(1,3).Range.Text ='课程号';DTI.Cell(1,5).Range.Text ='任课教师学院’;DTI.Cell(1,7).Range.Text ='任课教师 DTI.Cell(2,1).Range.Text ='授课班级 DTI.Cell(2,3).Range.Text ='考试日期 DTI.Cell(2,5).Range.Text ='应考人数 DTI.Cell(2,7).Range.Text ='实考人数 DTI.Cell(3,1).Range.Text ='出卷方式 DTI.Cell(3,3).Range.Text ='阅卷方式'; DTI.Cell(3,5).Range.Text ='选用试卷 A/B : DTI.Cell(3,7).Range.Text ='考试时间'; DTI.Cell(4,1).Range.Text ='考试方式'; DTI.Cell(4,3).Range.Text ='平均分'; DTI.Cell(4,5).Range.Text ='不及格人数 DTI.Cell(4,7).Range.Text ='及格率'; DTI.Cell(5,1).Range.Text ='成绩分布'; DTI.Cell(5,2).Range.Text = '90 分以上 DTI.Cell(5,3).Ra nge.Text = '80---89 分 DTI.Cell(6,2).Ra nge.Text = '70--79 分 DTI.Cell(6,3).Ra nge.Text = '60---69 分DTI.Cell(7,1).Ra nge.Text =['试卷分析(含是否符合教学大纲、难度、知识覆'盖面、班级分数分布分析、学生答题存在的共性问题与知识掌握情况、教学中 '存在的问题及改进措施等内容) '];DTI.Cell(7,1).Ra nge.ParagraphFormat.Alig nment = 'wdAlig nParagraphLeft :DTI.Cell(9,2).Range.Text ='签字:: DTI.Cell(9,4).Range.Text ='年 月 日'; DTI.Cell(10,1).Range.Text ='教研室审阅意见:’;DTI.Cell(10,1).Ra nge.ParagraphFormat.Alig nment = 'wdAlig nParagraphLeft'; DTI.Cell(10,1).VerticalAlig nment = 'wdCellAlig nVerticalTop'; DTI.Cell(11,2).Range.Text ='教研室主任(签字):年 月 日';DTI.Cell(11,2).Ra nge.ParagraphFormat.Alig nment = 'wdAlig nParagraphLeft'; DTI.Cell(8,1).Ra nge.P aragraphFormat.Alig nment = 'wdAlig nParagraphLeft'; DTI.Cell(8,1).VerticalAlig nment = 'wdCellAlig nV erticalTop'; DTI.Cell(9,2).Borders.ltem(2).L in eStyle = 'wdLi neStyleN on e'; DTI.Cell(9,2).Borders.ltem(4).L in eStyle = 'wdLi neStyleN on e'; DTI.Cell(9,3).Borders.Item(4).L in eStyle = 'wdLi neStyleN on e'; DTI.Cell(11,1).Borders.Item(4).Li neStyle = 'wdL in eStyleNo ne'; %如果当前工作文档中有图形存在,通过循环将图形全部删除Shape = Document.Shapes; % 返回 Shapes 接口的句柄 ShapeCount = Shape.Count; % 返回文档中 Shape 对象的个数 if ShapeCou nt ~= 0;for i = 1:ShapeCo unt;Shape.Item(1).Delete; % 删除第 1 个 Shape 对象 en d;en d;%产生标准正态分布随机数,画直方图,并设置图形属性人占%'; 人占 %'; 人占%'; 人占%';zft = figure(' un its',' no rmalized','positi on',...[0.280469 0.553385 0.428906 0.251302],'visible','off); % 新建图形窗口,设为不可见set(gca,'position',[0.1 0.2 0.85 0.75]); % 设置坐标系的位置和大小data = normrnd(0,1,1000,1); % 产生标准正态分布随机数hist(data); %绘制标准正态分布随机数的频数直方图grid on; % 添加参考网格xlabel('考试成绩'); %为X轴加标签ylabel('人数'); %为Y轴加标签%将图形复制到粘贴板hgexport(zft, '-clipboard');%将图形粘贴到当前文档里(表格的第8行第1列的单元格里),并设置图形版式为浮于文字上方% Select ion .Ra nge.PasteSpecial;DTI.Cell(8,1).Ra nge. Paragraphs.ltem(1).Ra nge. PasteSpecial;Shape.ltem(1).WrapFormat.Type = 3;Shape.ltem(1).ZOrder('msoBringlnFrontOfText'); % 设置图片叠放次序为浮于文字上方delete(zft); %删除图形句柄Document.ActiveWindow.ActivePane.View.Type = 'wdPrintView'; % 设置视图方式为页面Document.Save; % 保存文档口Love is n ot a maybe thing. You know whe n you love some one.。

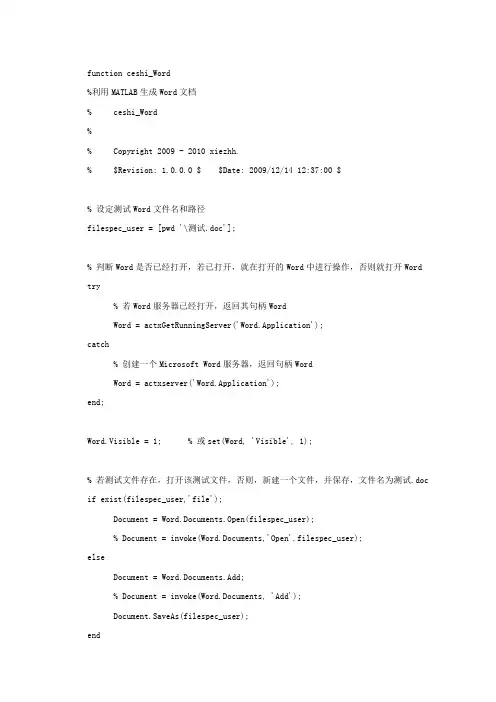
function ceshi_Word%利用MATLAB生成Word文档%ceshi_Word%%Copyright2009-2010xiezhh.%$Revision:1.0.0.0$$Date:2009/12/1412:37:00$%设定测试Word文件名和路径filespec_user=[pwd'\测试.doc'];%判断Word是否已经打开,若已打开,就在打开的Word中进行操作,否则就打开Word try%若Word服务器已经打开,返回其句柄WordWord=actxGetRunningServer('Word.Application');catch%创建一个Microsoft Word服务器,返回句柄WordWord=actxserver('Word.Application');end;Word.Visible=1;%或set(Word,'Visible',1);%若测试文件存在,打开该测试文件,否则,新建一个文件,并保存,文件名为测试.doc if exist(filespec_user,'file');Document=Word.Documents.Open(filespec_user);%Document=invoke(Word.Documents,'Open',filespec_user);elseDocument=Word.Documents.Add;%Document=invoke(Word.Documents,'Add');Document.SaveAs(filespec_user);endContent=Document.Content;Selection=Word.Selection;Paragraphformat=Selection.ParagraphFormat;Document.PageSetup.TopMargin=60;Document.PageSetup.BottomMargin=45;Document.PageSetup.LeftMargin=45;Document.PageSetup.RightMargin=45;Content.Start=0;title='试卷分析';Content.Text=title;Content.Font.Size=16;Content.Font.Bold=4;Content.Paragraphs.Alignment='wdAlignParagraphCenter';Selection.Start=Content.end;Selection.TypeParagraph;xueqi='(2009—2010学年第一学期)'; Selection.Text=xueqi;Selection.Font.Size=12;Selection.Font.Bold=0;Selection.MoveDown; paragraphformat.Alignment='wdAlignParagraphCenter'; Selection.TypeParagraph;Selection.TypeParagraph;Selection.Font.Size=10.5;Tables=Document.Tables.Add(Selection.Range,12,9);DTI=Document.Tables.Item(1);%或DTI=Tables;DTI.Borders.OutsideLineStyle='wdLineStyleSingle';DTI.Borders.OutsideLineWidth='wdLineWidth150pt';DTI.Borders.InsideLineStyle='wdLineStyleSingle';DTI.Borders.InsideLineWidth='wdLineWidth150pt';DTI.Rows.Alignment='wdAlignRowCenter';DTI.Rows.Item(8).Borders.Item(1).LineStyle='wdLineStyleNone';DTI.Rows.Item(8).Borders.Item(3).LineStyle='wdLineStyleNone';DTI.Rows.Item(11).Borders.Item(1).LineStyle='wdLineStyleNone';DTI.Rows.Item(11).Borders.Item(3).LineStyle='wdLineStyleNone';column_width=[53.7736,85.1434,53.7736,35.0094,...35.0094,76.6981,55.1887,52.9245,54.9057];row_height=[28.5849,28.5849,28.5849,28.5849,25.4717,25.4717,...32.8302,312.1698,17.8302,49.2453,14.1509,18.6792];for i=1:9DTI.Columns.Item(i).Width=column_width(i);endfor i=1:12DTI.Rows.Item(i).Height=row_height(i);endfor i=1:12for j=1:9DTI.Cell(i,j).VerticalAlignment='wdCellAlignVerticalCenter';endendDTI.Cell(1,4).Merge(DTI.Cell(1,5));DTI.Cell(2,4).Merge(DTI.Cell(2,5));DTI.Cell(3,4).Merge(DTI.Cell(3,5));DTI.Cell(4,4).Merge(DTI.Cell(4,5));DTI.Cell(5,2).Merge(DTI.Cell(5,5));DTI.Cell(5,3).Merge(DTI.Cell(5,6));DTI.Cell(6,2).Merge(DTI.Cell(6,5));DTI.Cell(6,3).Merge(DTI.Cell(6,6));DTI.Cell(5,1).Merge(DTI.Cell(6,1));DTI.Cell(7,1).Merge(DTI.Cell(7,9));DTI.Cell(8,1).Merge(DTI.Cell(8,9));DTI.Cell(9,1).Merge(DTI.Cell(9,3));DTI.Cell(9,2).Merge(DTI.Cell(9,3));DTI.Cell(9,3).Merge(DTI.Cell(9,4));DTI.Cell(9,4).Merge(DTI.Cell(9,5));DTI.Cell(10,1).Merge(DTI.Cell(10,9));DTI.Cell(11,5).Merge(DTI.Cell(11,9));DTI.Cell(12,5).Merge(DTI.Cell(12,9));DTI.Cell(11,1).Merge(DTI.Cell(12,4));Selection.Start=Content.end;Selection.TypeParagraph;Selection.Text='主管院长签字:年月日'; Paragraphformat.Alignment='wdAlignParagraphRight';Selection.MoveDown;DTI.Cell(1,1).Range.Text='课程名称';DTI.Cell(1,3).Range.Text='课程号';DTI.Cell(1,5).Range.Text='任课教师学院';DTI.Cell(1,7).Range.Text='任课教师';DTI.Cell(2,1).Range.Text='授课班级';DTI.Cell(2,3).Range.Text='考试日期';DTI.Cell(2,5).Range.Text='应考人数';DTI.Cell(2,7).Range.Text='实考人数';DTI.Cell(3,1).Range.Text='出卷方式';DTI.Cell(3,3).Range.Text='阅卷方式';DTI.Cell(3,5).Range.Text='选用试卷A/B';DTI.Cell(3,7).Range.Text='考试时间';DTI.Cell(4,1).Range.Text='考试方式';DTI.Cell(4,3).Range.Text='平均分';DTI.Cell(4,5).Range.Text='不及格人数';DTI.Cell(4,7).Range.Text='及格率';DTI.Cell(5,1).Range.Text='成绩分布';DTI.Cell(5,2).Range.Text='90分以上人占%';DTI.Cell(5,3).Range.Text='80---89分人占%';DTI.Cell(6,2).Range.Text='70--79分人占%';DTI.Cell(6,3).Range.Text='60---69分人占%';DTI.Cell(7,1).Range.Text=['试卷分析(含是否符合教学大纲、难度、知识覆'...'盖面、班级分数分布分析、学生答题存在的共性问题与知识掌握情况、教学中'...'存在的问题及改进措施等内容)'];DTI.Cell(7,1).Range.ParagraphFormat.Alignment='wdAlignParagraphLeft';DTI.Cell(9,2).Range.Text='签字:';DTI.Cell(9,4).Range.Text='年月日';DTI.Cell(10,1).Range.Text='教研室审阅意见:';DTI.Cell(10,1).Range.ParagraphFormat.Alignment='wdAlignParagraphLeft';DTI.Cell(10,1).VerticalAlignment='wdCellAlignVerticalTop';DTI.Cell(11,2).Range.Text='教研室主任(签字):年月日';DTI.Cell(11,2).Range.ParagraphFormat.Alignment='wdAlignParagraphLeft';DTI.Cell(8,1).Range.ParagraphFormat.Alignment='wdAlignParagraphLeft';DTI.Cell(8,1).VerticalAlignment='wdCellAlignVerticalTop';DTI.Cell(9,2).Borders.Item(2).LineStyle='wdLineStyleNone';DTI.Cell(9,2).Borders.Item(4).LineStyle='wdLineStyleNone';DTI.Cell(9,3).Borders.Item(4).LineStyle='wdLineStyleNone';DTI.Cell(11,1).Borders.Item(4).LineStyle='wdLineStyleNone';Shape=Document.Shapes;ShapeCount=Shape.Count;if ShapeCount~=0;for i=1:ShapeCount;Shape.Item(1).Delete;end;end;%产生标准正态分布随机数,画直方图,并设置图形属性zft=figure('units','normalized','position',...[0.2804690.5533850.4289060.251302],'visible','off');%新建图形窗口,设为不可见set(gca,'position',[0.10.20.850.75]);%设置坐标系的位置和大小data=normrnd(0,1,1000,1);%产生标准正态分布随机数hist(data);%绘制标准正态分布随机数的频数直方图grid on;%添加参考网格xlabel('考试成绩');%为X轴加标签ylabel('人数');%为Y轴加标签%将图形复制到粘贴板hgexport(zft,'-clipboard');%将图形粘贴到当前文档里(表格的第8行第1列的单元格里),并设置图形版式为浮于文字上方%Selection.Range.PasteSpecial;DTI.Cell(8,1).Range.Paragraphs.Item(1).Range.PasteSpecial;Shape.Item(1).WrapFormat.Type=3;Shape.Item(1).ZOrder('msoBringInFrontOfText');%设置图片叠放次序为浮于文字上方delete(zft);%删除图形句柄Document.ActiveWindow.ActivePane.View.Type='wdPrintView';%设置视图方式为页面Document.Save;%保存文档function ceshi_Excel%利用MATLAB生成Excel文档%ceshi_Excel%%Copyright2009-2010xiezhh.%$Revision:1.0.0.0$$Date:2009/12/1420:40:00$filespec_user=[pwd'\测试.xls'];tryExcel=actxGetRunningServer('Excel.Application');catchExcel=actxserver('Excel.Application');end;Excel.Visible=1;%set(Excel,'Visible',1);if exist(filespec_user,'file');Workbook=Excel.Workbooks.Open(filespec_user);%Workbook=invoke(Excel.Workbooks,'Open',filespec_user);elseWorkbook=Excel.Workbooks.Add;%Workbook=invoke(Excel.Workbooks,'Add');Workbook.SaveAs(filespec_user);endSheets=Excel.ActiveWorkbook.Sheets;%Sheets=Workbook.Sheets; Sheet1=Sheets.Item(1);Sheet1.Activate;Sheet1.PageSetup.TopMargin=60;Sheet1.PageSetup.BottomMargin=45;Sheet1.PageSetup.LeftMargin=45;Sheet1.PageSetup.RightMargin=45;RowHeight=[26,22,15,29,37,29,29,25,25,36,280,31,40,29,15,24]'; Sheet1.Range('A1:A16').RowHeight=RowHeight;Sheet1.Range('A1:H1').ColumnWidth=[9,15,9,9,9,9,9,9];Sheet1.Range('A1:H1').MergeCells=1;Sheet1.Range('A2:H2').MergeCells=1;Sheet1.Range('A8:A9').MergeCells=1;Sheet1.Range('B8:D8').MergeCells=1;Sheet1.Range('E8:H8').MergeCells=1;Sheet1.Range('B9:D9').MergeCells=1;Sheet1.Range('E9:H9').MergeCells=1;Sheet1.Range('A10:H10').MergeCells=1;Sheet1.Range('A11:H11').MergeCells=1;Sheet1.Range('A12:H12').MergeCells=1;Sheet1.Range('A13:H13').MergeCells=1;Sheet1.Range('A14:H14').MergeCells=1;Sheet1.Range('D16:H16').MergeCells=1;Sheet1.Range('A4:H14').Borders.Weight=3;Sheet1.Range('A10:H12').Borders.Item(3).Linestyle=0;Sheet1.Range('A10:H12').Borders.Item(4).Linestyle=0;Sheet1.Range('A13:H13').Borders.Item(4).Linestyle=0;Sheet1.Range('A14:H14').Borders.Item(3).Linestyle=0;Sheet1.Range('A1:H9').HorizontalAlignment=3;Sheet1.Range('A4:A9').HorizontalAlignment=6;Sheet1.Range('C4:C7').HorizontalAlignment=6;Sheet1.Range('E4:E7').HorizontalAlignment=6;Sheet1.Range('G4:G7').HorizontalAlignment=6;Sheet1.Range('A10:H10').HorizontalAlignment=6;Sheet1.Range('A11:H11').HorizontalAlignment=6;%-4130 Sheet1.Range('A11:H11').VerticalAlignment=1;Sheet1.Range('A12:H12').HorizontalAlignment=4;Sheet1.Range('A13:H13').VerticalAlignment=1;Sheet1.Range('A14:H14').HorizontalAlignment=4;Sheet1.Range('D16:H16').HorizontalAlignment=4;Sheet1.Range('A1').Value='试卷分析';Sheet1.Range('A2').Value='(2009—2010学年第一学期)'; Sheet1.Range('A4:H4').Value={'课程名称','','课程号',...'','任课教师学院','','任课教师',''};Sheet1.Range('A5:H5').Value={'授课班级','','考试日期',...'','应考人数','','实考人数',''};Sheet1.Range('A6:H6').Value={'出卷方式','','阅卷方式',...'','选用试卷A/B','','考试时间',''};Sheet1.Range('A7:H7').Value={'考试方式','','平均分',...'','不及格人数','','及格率',''};Sheet1.Range('A8').Value='成绩分布';Sheet1.Range('B8').Value='90分以上人占%';Sheet1.Range('E8').Value='80---89分人占%';Sheet1.Range('B9').Value='70---79分人占%';Sheet1.Range('E9').Value='60---69分人占%';Sheet1.Range('A10').Value=['试卷分析(含是否符合教学大纲、难度、知识覆'...'盖面、班级分数分布分析、学生答题存在的共性问题与知识掌握情况、教学中'...'存在的问题及改进措施等内容)'];Sheet1.Range('A12').Value='签字:年月日'; Sheet1.Range('A13').Value='教研室审阅意见:';Sheet1.Range('A14').Value='教研室主任(签字):年月日'; Sheet1.Range('D16').Value='主管院长签字:年月日';Sheet1.Range('A4:H12').Font.size=10.5;Sheet1.Range('A1').Font.size=16;Sheet1.Range('A1').Font.bold=2;Shapes=Sheet1.Shapes;if Shapes.Count~=0;for i=1:Shapes.Count;Shapes.Item(1).Delete;end;end;zft=figure('units','normalized','position',...[0.2804690.5533850.4289060.251302],'visible','off');set(gca,'position',[0.10.20.850.75]);data=normrnd(75,4,1000,1);hist(data);grid on;xlabel('考试成绩');ylabel('人数');hgexport(zft,'-clipboard');Sheet1.Range('A11').Select;Sheet1.Paste%Sheet1.PasteSpecial;delete(zft);Workbook.Save%保存文档。
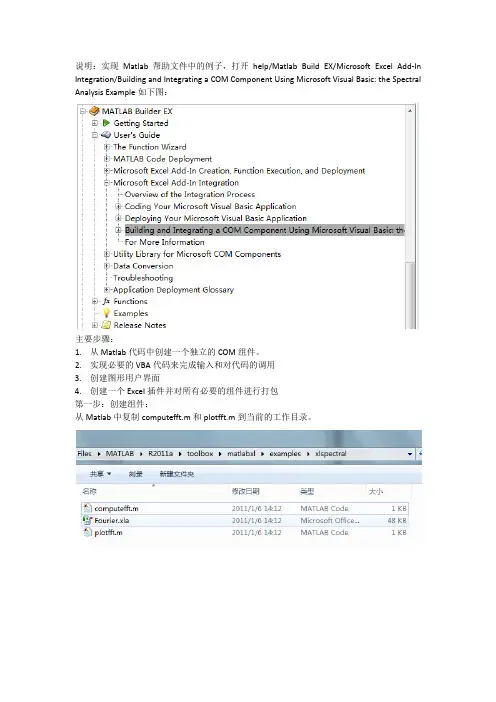
说明:实现Matlab帮助文件中的例子,打开help/Matlab Build EX/Microsoft Excel Add‐In Integration/Building and Integrating a COM Component Using Microsoft Visual Basic: the Spectral Analysis Example如下图:主要步骤:1.从Matlab代码中创建一个独立的COM组件。
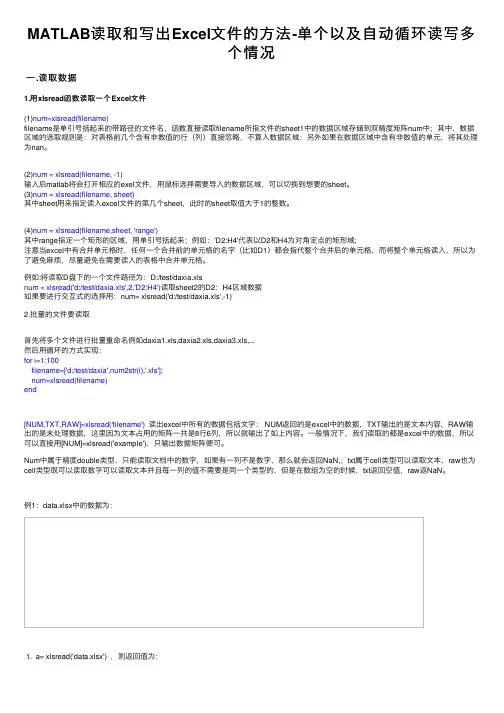
2.实现必要的VBA代码来完成输入和对代码的调用3.创建图形用户界面4.创建一个Excel插件并对所有必要的组件进行打包第一步:创建组件:从Matlab中复制computefft.m和plotfft.m到当前的工作目录。
按照下列步骤创建组件:1.输入mbuild –setup,选择VC的编译器2.输入deploytool,按照一下提示输入Note:有时候在自己的工作目录下编译不成功,可以把工程文件和所需的m文件copy到默认的matlab的目录下试试可能的工作:第二步:将组件集成到VBA中1.启动Excel2.点击开发工具/Visual Basic3.点击:工具/引用4.选择“Fourier 1.0 Type Library”和“MWComUtil 7.15 Type Library”创建VBA主模块1.右键单击VBAProject,点击插入/模块2.在模块的属性页修改“名称”属性为“FourierMain”3.在模块中输入一下代码:'' FourierMain ‐ Main module stores global state of controls' and provides initialization code'Public theFourier As Fourier.Fourier 'Global instance of Fourier objectPublic theFFTData As MWComplex 'Global instance of MWComplex to accept FFTPublic InputData As Range 'Input data rangePublic Interval As Double 'Sampling intervalPublic Frequency As Range 'Output frequency data rangePublic PowerSpect As Range 'Output power spectral density rangePublic bPlot As Boolean 'Holds the state of plot flagPublic theUtil As MWUtil 'Global instance of MWUtil objectPublic bInitialized As Boolean 'Module‐is‐initialized flagPrivate Sub LoadFourier()'Initializes globals and Loads the Spectral Analysis formDim MainForm As frmFourierOn Error GoTo Handle_ErrorCall InitAppSet MainForm = New frmFourierCall MainForm.ShowExit SubHandle_Error:MsgBox (Err.Description)End SubPrivate Sub InitApp()'Initializes classes and libraries. Executes once'for a given session of ExcelIf bInitialized Then Exit SubOn Error GoTo Handle_ErrorIf theUtil Is Nothing ThenSet theUtil = New MWUtilCall theUtil.MWInitApplication(Application)End IfIf theFourier Is Nothing ThenSet theFourier = New Fourier.FourierEnd IfIf theFFTData Is Nothing ThenSet theFFTData = New MWComplexEnd IfbInitialized = TrueExit SubHandle_Error:MsgBox (Err.Description)End Sub(注:帮助文件中有个地方有错)第三步:创建图形用户界面:1.右键单击VBAProject,点击插入/用户窗体2.在窗体的属性页:名称:frmFourier,Caption: Spectral Analysis3.给空白的窗体添加控件,属性设置如下:如下:右键单击窗体,查看代码:出入以下代码:第四步:添加Excel菜单1.右键单击This Workbook,查看代码,添加如下代码:Private Sub Workbook_AddinInstall()'Called when Addin is installedCall AddFourierMenuItemEnd SubPrivate Sub Workbook_AddinUninstall()'Called when Addin is uninstalledCall RemoveFourierMenuItemEnd SubPrivate Sub AddFourierMenuItem()Dim ToolsMenu As CommandBarPopupDim NewMenuItem As CommandBarButton'Remove if already existsCall RemoveFourierMenuItem'Find Tools menuSet ToolsMenu = mandBars(1).FindControl(ID:=30007) If ToolsMenu Is Nothing Then Exit Sub'Add Spectral Analysis menu itemSet NewMenuItem = ToolsMenu.Controls.Add(Type:=msoControlButton) NewMenuItem.Caption = "Spectral Analysis..."NewMenuItem.OnAction = "LoadFourier"End SubPrivate Sub RemoveFourierMenuItem()Dim CmdBar As CommandBarDim Ctrl As CommandBarControlOn Error Resume Next'Find tools menu and remove Spectral Analysis menu itemSet CmdBar = mandBars(1)Set Ctrl = CmdBar.FindControl(ID:=30007)Call Ctrl.Controls("Spectral Analysis...").DeleteEnd Sub保存插件:1.点击Excel,准备/文档属性2.选择:信息摘要,输入:Spectral Analysis3.另存为:Fourier.xlam第五步:测试1.启动一个新的Excel2.加载项,找到Fourier.xlam3.加载数据:点击Spectral Analysis输入数据:结果显示:如下第六步:打包点击Fourier.prj选择Package,加载一些必要的或者你想要的文件,可以添加MCR点击编译后面的打包(如何某个文件不存在,可以在相应的位置创建一个,保证打包程序运行)打包完成。


MATLAB读取和写出Excel⽂件的⽅法-单个以及⾃动循环读写多个情况⼀.读取数据1.⽤xlsread函数读取⼀个Excel⽂件(1)num=xlsread(filename)filename是单引号括起来的带路径的⽂件名,函数直接读取filename所指⽂件的sheet1中的数据区域存储到双精度矩阵num中;其中,数据区域的选取规则是:对表格前⼏个含有⾮数值的⾏(列)直接忽略,不算⼊数据区域;另外如果在数据区域中含有⾮数值的单元,将其处理为nan。
(2)num = xlsread(filename, -1)输⼊后matlab将会打开相应的exel⽂件,⽤⿏标选择需要导⼊的数据区域,可以切换到想要的sheet。
(3)num = xlsread(filename, sheet)其中sheet⽤来指定读⼊excel⽂件的第⼏个sheet,此时的sheet取值⼤于1的整数。
(4)num = xlsread(filename,sheet, 'range')其中range指定⼀个矩形的区域,⽤单引号括起来;例如:'D2:H4'代表以D2和H4为对⾓定点的矩形域;注意当excel中有合并单元格时,任何⼀个合并前的单元格的名字(⽐如D1)都会指代整个合并后的单元格,⽽将整个单元格读⼊,所以为了避免⿇烦,尽量避免在需要读⼊的表格中合并单元格。
例如:将读取D盘下的⼀个⽂件路径为:D:/test/daxia.xlsnum = xlsread('d:/test/daxia.xls',2,'D2:H4')读取sheet2的D2:H4区域数据如果要进⾏交互式的选择⽤:num= xlsread('d:/test/daxia.xls',-1)2.批量的⽂件要读取⾸先将多个⽂件进⾏批量重命名例如daxia1.xls,daxia2.xls,daxia3.xls,...然后⽤循环的⽅式实现:for i=1:100filename=['d:/test/daxia',num2str(i),'.xls'];num=xlsread(filename)end[NUM,TXT,RAW]=xlsread('filename') 读出excel中所有的数据包括⽂字: NUM返回的是excel中的数据,TXT输出的是⽂本内容,RAW输出的是未处理数据,这⾥因为⽂本占⽤的矩阵⼀共是8⾏6列,所以就输出了如上内容。
MATLAB⽣成Word⽂档⼀、创建Microsoft Word服务器1. 创建Microsoft Word服务器try% 若Word服务器已经打开,返回其句柄WordWord = actxGetRunningServer('Word.Application');catch% 创建⼀个Microsoft Word服务器,返回句柄WordWord = actxserver('Word.Application');end2. 设置对象属性设置Word服务器为可见状态set(Word, 'Visible', 1); %或Word.Visible = 1;⼆、建⽴Word⽂本⽂档1. 新建空⽩⽂档%调⽤Add⽅法建⽴⼀个空⽩⽂档,并返回其句柄DocumentDocument = Word.Documents.Add;2. 页⾯设置%查看PageSetup接⼝的所有属性Document.PageSetup.get%页⾯设置Document.PageSetup.TopMargin =60;%上边距60磅Document.PageSetup.BottomMargin =45;%下边距45磅Document.PageSetup.LeftMargin =45;%左边距45磅Document.PageSetup.RightMargin =45;%右边距45磅%查看枚举类型属性VerticalAlignment的属性值Document.PageSetup.set('VerticalAlignment')3. 写⼊⽂字Content接⼝Content接⼝有很多属性和⽅法,可通过Content.get和Content.methodsview命令查看;Start属性⽤来获取或设定⽂字内容的起始位置,End属性⽤来获取或设定⽂字内容的终⽌位置,Text属性⽤来写⼊⽂字内容,Font属性⽤于字体设置,Paragraphs属性⽤于段落设置。
MATLAB与word,excel,powerpoint联用作者:dinga 日期:2006-04-22字体大小: 小中大MATLAB与Microsoft Excel的连接本章需要读者对MA TLAB与Microsoft Excel有一定的使用经验。
介绍使用MATLAB Excel Builder实现MA TLAB和Microsoft Excel连接的方法和技巧,从而实现两者的无缝接口。
希望通过本章的学习,能够让读者对Excel连接的思路及实际应用有比较深入的了解。
通过两者的连接,可以使读者更加容易直观的处理数据。
在MA TLAB6.5以前的版本中,两者的连接是通过Excel link来实现的,其相关的使用方法本章不涉及。
1. 读者准备知识阅读本章内容,读者需要熟悉以下内容:(1)熟悉MA TLAB及MATLAB编译器;(2)Microsoft Excel;(3)Visual Basic for Applications (VBA) 。
2. 编译器并不是所有的编译器都支持COM组件,Excel Builder可以选用以下编译器:(1)Borland C++ Builder 4;(2)Borland C++ Builder 5;(3)Borland C++ Builder 6;(4)Microsoft Visual Studio 5.0;(5)Microsoft Visual Studio 6.0;(6)Microsoft Visual Studio .NET。
10.1 Excel中实现矩阵输出MATLAB Excel Builder的约束和限制类同于MATLAB编译器,但是有一点必须注意,一个版本下进行编码的Excel Add-in文件,只能在同版本下执行任务,例如,在Excel 97中进行编码的文件,不能在Excel 2000种进行工作。
用MA TLAB Excel Builder建立一个可调用的程序主要遵循以下几步:(1)创立一个新项目;(2)添加M文件或MEX文件;(3)对项目进行编码;(4)对模型进行测试;(5)程序的调用;(6)对程序进行打包。
filespec='C:\Documents and Settings\Administrator\桌面\xiezh.doc'; try;Word=actxGetRunningServer('Word.Application');catch;Word=actxserver('Word.Application');end;set(Word,'Visible',1);documents=Word.Documents;if exist(filespec,'file')document=invoke(documents,'Open',filespec);elsedocument=invoke(documents,'Add');document.SaveAs(filespec);endcontent=document.Content;duplicate=content.Duplicate;inlineshapes=content.InlineShapes;selection=Word.Selection;paragraphformat=selection.ParagraphFormat;%页面设置document.PageSetup.TopMargin=60;document.PageSetup.BottomMargin=45;document.PageSetup.LeftMargin=45;document.PageSetup.RightMargin=45;set(content,'Start',0);title='试卷分析';set(content,'Text',title);set(paragraphformat,'Alignment','wdAlignParagraphCenter');rr=document.Range(0,10);rr.Font.Size=16;rr.Font.Bold=4;end_of_doc=get(content,'end');set(selection,'Start',end_of_doc);selection.TypeParagraph;set(selection,'Text','(20—20学年第学期)'); selection.Font.Size=12;selection.MoveDown;set(paragraphformat,'Alignment','wdAlignParagraphCenter');selection.TypeParagraph;selection.TypeParagraph;selection.Font.Size=10.5;Tables=document.Tables.Add(selection.Range,12,9);%设置边框DTI=document.Tables.Item(1);DTI.Borders.OutsideLineStyle='wdLineStyleSingle';DTI.Borders.OutsideLineWidth='wdLineWidth150pt';DTI.Borders.InsideLineStyle='wdLineStyleSingle';DTI.Borders.InsideLineWidth='wdLineWidth150pt';DTI.Rows.Alignment='wdAlignRowCenter';DTI.Rows.Item(8).Borders.Item(1).LineStyle='wdLineStyleNone';DTI.Rows.Item(8).Borders.Item(3).LineStyle='wdLineStyleNone';DTI.Rows.Item(11).Borders.Item(1).LineStyle='wdLineStyleNone';DTI.Rows.Item(11).Borders.Item(3).LineStyle='wdLineStyleNone';column_width=[53.7736,80.9434,53.7736,29.0094,29.0094,76.6981,55.1887,52.9245,54.9057]; row_height=[28.5849,28.5849,28.5849,28.5849,25.4717,25.4717,32.8302,312.1698,17.8302,49.2 453,14.1509,18.6792];for i=1:9DTI.Columns.Item(i).Width=column_width(i);endfor i=1:12DTI.Rows.Item(i).Height=row_height(i);endfor i=1:12for j=1:9DTI.Cell(i,j).VerticalAlignment='wdCellAlignVerticalCenter';endendDTI.Cell(1,4).Merge(DTI.Cell(1,5));DTI.Cell(2,4).Merge(DTI.Cell(2,5));DTI.Cell(3,4).Merge(DTI.Cell(3,5));DTI.Cell(4,4).Merge(DTI.Cell(4,5));DTI.Cell(5,2).Merge(DTI.Cell(5,5));DTI.Cell(5,3).Merge(DTI.Cell(5,6));DTI.Cell(6,2).Merge(DTI.Cell(6,5));DTI.Cell(6,3).Merge(DTI.Cell(6,6));DTI.Cell(5,1).Merge(DTI.Cell(6,1));DTI.Cell(7,1).Merge(DTI.Cell(7,9));DTI.Cell(8,1).Merge(DTI.Cell(8,9));DTI.Cell(9,1).Merge(DTI.Cell(9,3));DTI.Cell(9,2).Merge(DTI.Cell(9,3));DTI.Cell(9,3).Merge(DTI.Cell(9,4));DTI.Cell(9,4).Merge(DTI.Cell(9,5));DTI.Cell(10,1).Merge(DTI.Cell(10,9));DTI.Cell(11,5).Merge(DTI.Cell(11,9));DTI.Cell(12,5).Merge(DTI.Cell(12,9));DTI.Cell(11,1).Merge(DTI.Cell(12,4));end_of_doc=get(content,'end');set(selection,'Start',end_of_doc);selection.TypeParagraph;set(selection,'Text','主管院长签字:年月日');set(paragraphformat,'Alignment','wdAlignParagraphRight');%右对齐DTI.Cell(1,1).Range.Text='课程名称';DTI.Cell(1,3).Range.Text='课程号';DTI.Cell(1,5).Range.Text='任课教师学院';DTI.Cell(1,7).Range.Text='任课教师';DTI.Cell(2,1).Range.Text='授课班级';DTI.Cell(2,3).Range.Text='考试日期';DTI.Cell(2,5).Range.Text='应考人数';DTI.Cell(2,7).Range.Text='实考人数';DTI.Cell(3,1).Range.Text='出卷方式';DTI.Cell(3,3).Range.Text='阅卷方式';DTI.Cell(3,5).Range.Text='选用试卷A/B';DTI.Cell(3,7).Range.Text='考试时间';DTI.Cell(4,1).Range.Text='考试方式';DTI.Cell(4,3).Range.Text='平均分';DTI.Cell(4,5).Range.Text='不及格人数';DTI.Cell(4,7).Range.Text='及格率';DTI.Cell(5,1).Range.Text='成绩分布';DTI.Cell(5,2).Range.Text='90分以上人占%';DTI.Cell(5,3).Range.Text='80---89分人占%';DTI.Cell(6,2).Range.Text='70--79分人占%';DTI.Cell(6,3).Range.Text='60---69分人占%';DTI.Cell(7,1).Range.Text='试卷分析(含是否符合教学大纲、难度、知识覆盖面、班级分数分布分析、学生答题存在的共性问题与知识掌握情况、教学中存在的问题及改进措施等内容)';DTI.Cell(7,1).Range.ParagraphFormat.Alignment='wdAlignParagraphLeft';%左对齐DTI.Cell(9,2).Range.Text='签字:';DTI.Cell(9,4).Range.Text='年月日';DTI.Cell(10,1).Range.Text='教研室审阅意见:';DTI.Cell(10,1).Range.ParagraphFormat.Alignment='wdAlignParagraphLeft';%居左DTI.Cell(10,1).VerticalAlignment='wdCellAlignVerticalTop';%置顶DTI.Cell(11,2).Range.Text='教研室主任(签字):年月日';DTI.Cell(11,2).Range.ParagraphFormat.Alignment='wdAlignParagraphLeft';DTI.Cell(8,1).Range.ParagraphFormat.Alignment='wdAlignParagraphLeft';DTI.Cell(8,1).VerticalAlignment='wdCellAlignVerticalTop';DTI.Cell(9,2).Borders.Item(2).LineStyle='wdLineStyleNone';DTI.Cell(9,2).Borders.Item(4).LineStyle='wdLineStyleNone';DTI.Cell(9,3).Borders.Item(4).LineStyle='wdLineStyleNone';DTI.Cell(11,1).Borders.Item(4).LineStyle='wdLineStyleNone';。
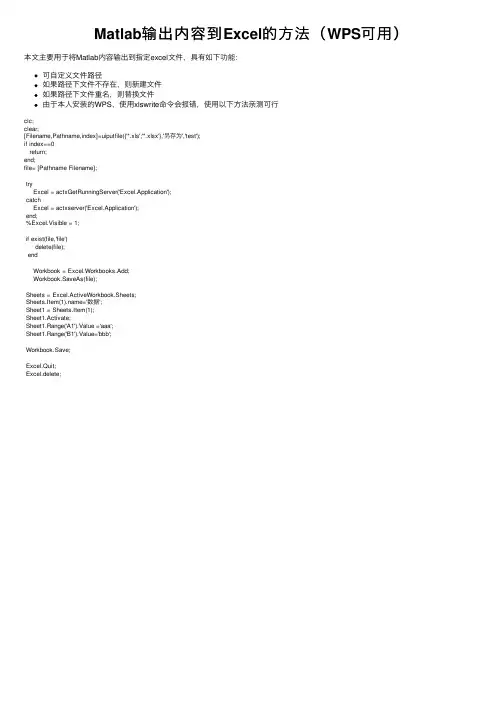
在MATLAB程序中创建MicrosoftExcel⽂档技巧⽤途对于数据分析来说,很多时候⽤户希望数据分析的结果可以保存到常⽤格式的⽂件中,⽐如doc或者xls⽂件。
MATLAB有专门的读写Excel⽂档的函数:xlsread和xlswrite,可以根据⽤户需要将数据结果保存到Excel⽂件中指定的⼯作表或者将Excel⽂件中的数据读⼊MATLAB⼯作空间。
对于图形结果,MATLAB没有提供现成的函数,但是MATLAB完全可以将图形结果输出到Excel⼯作簿中,甚⾄可以操作Excel编程,⽐如控制Excel对某⼀个区域的数据进⾏分析,绘制Excel提供的各类统计图表等。
这时需要⼀种称为OLE(Object Linking and Embedding)即对象链接与嵌⼊技术,它是ActiveX技术的前⾝,基于COM(Component Object Model)即组件对象模型,是不同的软件环境之间共享程序功能的⼀种⽅式。
这⼀节介绍MATLAB控制Excel⽂件的⽅式,熟练使⽤MATLAB操作Excel⽂件,可以建⽴符合⽤户需要的专业报表。
技巧实现1. MATLAB⾃动化功能介绍MATLAB⽀持组件⾃动化(COM Automation),这是⼀个COM协议,该协议允许⼀个程序或者组件去控制另⼀个程序或者组件。
MATLAB⽀持的组件技术分为以下3个内容:(1)在MATLAB下运⾏其他软件的组件;(2)在其他程序下运⾏MATLAB的组件(包括MATLAB本⾝);(3)将所需的MATLAB功能(通常有若⼲m和mex⽂件构成),利⽤MATLAB⾃⾝的COM Builder编译成组件供其他程序使⽤。
MATLAB控制Excel⽂件操作属于第(1)种,也即将MATLAB作为⾃动化客户端,调⽤Excel服务器完成⼀系列功能。
MATLAB打开创建COM服务器的函数为actxserver。
其基本⽤法如下:actxserver('prodid');其中prodid为COM 服务器的标识号。