用xlsread命令将excel中数据导入到matlab并作图
- 格式:doc
- 大小:108.50 KB
- 文档页数:1
首先Excel必须是office的(WPS的不可以,MATLAB不能识别),在MATLAB中使用命令xlsread读取Excel中的数据到MATLAB里,如下所示:[number,txt,raw]=xlsread(''),此时读取的文件须在MATLAB默认路径下,命令具体用法及参数含义可直接用help命令在MATLAB中查找。
读取的数据界面如下:
1.如何将Excel中的数据导入MATLAB并在MATLAB中画出图像?
首先Excel必须是office的(WPS的不可以,MATLAB不能识别),file-Import Data-在工作路径下找到需要导入的文件(图3)-点击打开(图4)-点击next-点击finish-导入成功-在workspace中看到图5(导入的数据)。
至此数据导入成功。
下面是如何利用该数据绘图:
法一:双击workspace中的data打开如图6,选中要画图的数据如图7(数据范围可以根据需要随便选择),点击上方的plot(data(1:874,1:2),画出图像如图8,并且在工作空间中自动显示画图命令。
法二:直接在工作空间中写画图命令。
图3
图4
图5图6图7图8。
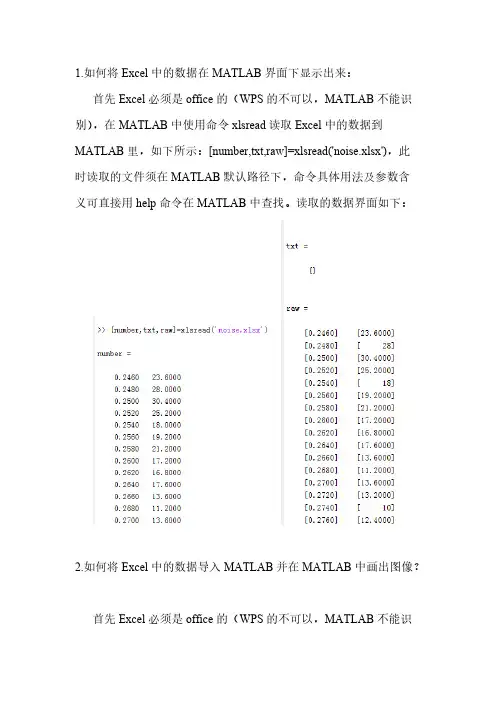
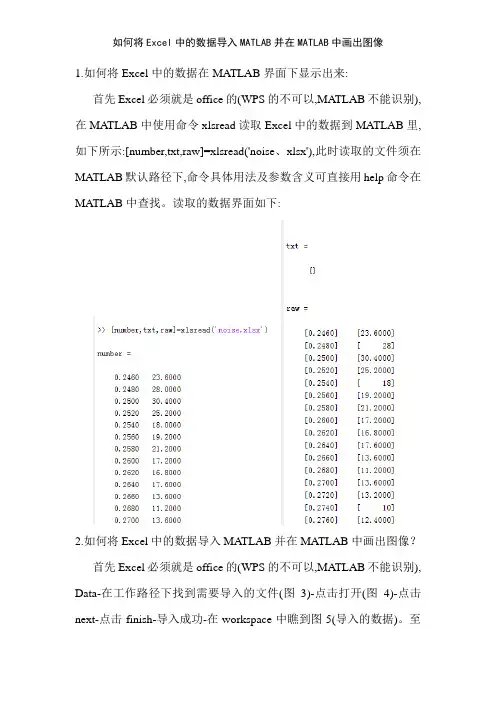
1.如何将Excel中的数据在MATLAB界面下显示出来:
首先Excel必须是office的(WPS的不可以,MATLAB不能识别),在MATLAB中使用命令xlsread读取Excel中的数据到MATLAB里,如下所示:[number,txt,raw]=xlsread('noise.xlsx'),此
时读取的文件须在MATLAB默认路径下,命令具体用法及参数含
义可直接用help命令在MATLAB中查找。
读取的数据界面如下:
2.如何将Excel中的数据导入MATLAB并在MATLAB中画出图像?
首先Excel必须是office的(WPS的不可以,MATLAB不能识
别),file-Import Data-在工作路径下找到需要导入的文件(图3)-点击打开(图4)-点击next-点击finish-导入成功-在workspace中看到图5(导入的数据)。
至此数据导入成功。
下面是如何利用该数据绘图:
法一:双击workspace中的data打开如图6,选中要画图的数据如图7(数据范围可以根据需要随便选择),点击上方的
plot(data(1:874,1:2),画出图像如图8,并且在工作空间中自动显示画图命令。
法二:直接在工作空间中写画图命令。
图3
图4
图5
图6
图7
图8。
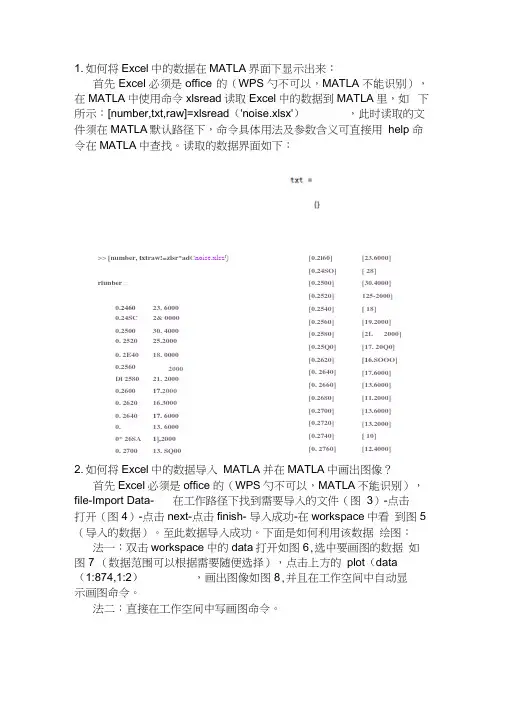
1. 如何将Excel中的数据在MATLA界面下显示出来:首先Excel必须是office 的(WPS勺不可以,MATLA不能识别),在MATLA中使用命令xlsread读取Excel中的数据到MATLA里,如下所示:[number,txt,raw]=xlsread('noise.xlsx'),此时读取的文件须在MATLA默认路径下,命令具体用法及参数含义可直接用help 命令在MATLA中查找。
读取的数据界面如下:[0.2i60][0.24SO][0.2500][0.2520][0.2540][0.2560][0.2580][0.25Q0][0.2620][0. 2640][0. 2660][0.2680][0.2700][0.2720][0.2740][0. 2760][23.6000][ 28][30.4000]125-2000][ 18][19.2000][2L 2000][17. 20Q0][16.SOOO][17.6000][13.6000][11.2000][13.6000][13.2000][ 10][12.4000]2. 如何将Excel中的数据导入MATLA并在MATLA中画出图像?首先Excel必须是office 的(WPS勺不可以,MATLA不能识别),file-Import Data- 在工作路径下找到需要导入的文件(图3)-点击打开(图4)-点击next-点击finish- 导入成功-在workspace中看到图5 (导入的数据)。
至此数据导入成功。
下面是如何利用该数据绘图:法一:双击workspace中的data打开如图6,选中要画图的数据如图7 (数据范围可以根据需要随便选择),点击上方的plot(data(1:874,1:2),画出图像如图8,并且在工作空间中自动显示画图命令。
法二:直接在工作空间中写画图命令。
>> [number, txt raw!=zlsr*ad C noise.xlsz J)riunber 二0.246023. 60000.24SC 2& 00000.2500 30. 40000. 2520 25.20000. 2E40 18. 00000.2560 2000Di 2580 21. 20000.2600 17.20000. 2620 16.30000. 2640 17. 60000. 13. 60000* 26SA 1],20000. 2700 13. SQ00Import Data査找范圉(X):库计算机网貉名称'悸改日期,,noise.rriat2014/3/1S 19:181^gnoisenKlsx2014/3/1& 19:01I HKTIAB ▼> ®文件名曲):iriOL XISX文件类型⑴;Recognized Filww取消 |JJWorkspace圄■鱼1鲂I^Lr Select data ...〒Name *田[甌Value<874x2 double* rrrCommand Window■+* □ ? X>> plol (datadia?^ I. = 2), J DisplayMafte J p J dataCl;874? 1;2)a ? J YDataSource 1/ data(i:B74? 1:2^ ) .f igurt (ecf)九—K —图81 f 4New to MATLAB? Watch thi$ Sdg see 口旳口轧 or read Getting 5t^rt 亡cLNew Parallel D”ktq 因❼Ctirrent F file Edit 0ew Ins-ert lo&ls Desktop Window Help□ U 矗B |輿耳U 物穏摇TO □囲I ■口IXCommaHd Window。


1.如何将Excel中的数据在MATLAB界面下显示出来:
首先Excel必须就是office的(WPS的不可以,MATLAB不能识别),在MATLAB中使用命令xlsread读取Excel中的数据到MATLAB里,如下所示:[number,txt,raw]=xlsread('noise、xlsx'),此时读取的文件须在MATLAB默认路径下,命令具体用法及参数含义可直接用help命令在MATLAB中查找。
读取的数据界面如下:
2.如何将Excel中的数据导入MATLAB并在MATLAB中画出图像?
首先Excel必须就是office的(WPS的不可以,MATLAB不能识别), Data-在工作路径下找到需要导入的文件(图3)-点击打开(图4)-点击next-点击finish-导入成功-在workspace中瞧到图5(导入的数据)。
至
此数据导入成功。
下面就是如何利用该数据绘图:
法一:双击workspace中的data打开如图6,选中要画图的数据如图7(数据范围可以根据需要随便选择),点击上方的plot(data(1:874,1:2),画出图像如图8,并且在工作空间中自动显示画图命令。
法二:直接在工作空间中写画图命令。
图3
图4 图5
图6
图7
图8。
matlab根据excel生成模拟曲线的方法1. 引言1.1 概述本文旨在介绍如何使用MATLAB根据Excel数据生成模拟曲线的方法。
近年来,数据处理和分析在科学研究、工程设计和商业决策等领域中扮演着越来越重要的角色。
而Excel作为一款常用的电子表格软件,广泛应用于数据整理和存储。
然而,Excel在进行复杂数据处理和曲线拟合方面功能有限,无法满足特定需求。
相对而言,MATLAB作为一种强大的数值计算和科学编程语言,在数据处理、绘图和拟合等方面具备出色的能力。
本文将详细介绍如何利用MATLAB导入Excel中的数据,并使用多种曲线拟合方法、插值方法以及多项式拟合方法生成模拟曲线。
1.2 文章结构本文总共分为五个部分:引言、MATLAB生成模拟曲线方法、模拟曲线生成原理、实践示例与应用案例以及结论与总结。
首先,在引言部分我们将概述文章的目的并介绍本文主要内容。
接着,在第二部分中我们将深入讨论MATLAB和Excel的基本概念,并提供了导入Excel数据到MATLAB的方法。
第三部分将解释模拟曲线的生成原理,包括曲线拟合方法、插值方法和多项式拟合方法。
在第四部分中,我们将通过一个实际案例来展示如何准备和导入示例数据,并详细介绍利用MATLAB生成模拟曲线的步骤。
同时,我们还将通过案例分析和结果展示来验证该方法的有效性。
最后,在结论与总结部分中,我们将总结文章中的主要观点,并讨论本文研究的价值及不足之处。
此外,我们还会提出一些建议以供进一步研究使用。
1.3 目的本文旨在帮助读者了解如何利用MATLAB根据Excel数据生成模拟曲线。
通过本文所介绍的方法,读者可以更加灵活地进行数据处理与分析,并能够针对特定需求生成准确而美观的模拟曲线。
希望本文能为科学研究、工程设计和商业决策等领域提供有价值的参考,推动相关领域技术发展和应用创新。
2. MATLAB生成模拟曲线方法2.1 MATLAB和Excel的基本概念在开始介绍MATLAB生成模拟曲线方法之前,我们先了解一些基本概念。
matlab中xlsread用法
在MATLAB中,xlsread函数用于从Excel文件中读取数据。
该函数的基本用法如下:1. 读取一个Excel文件中的所有数据:data = xlsread(filename) 其中,filename为Excel文件的路径和名称。
data为一个矩阵,包含了Excel文件中的所有数据。
2. 读取Excel文件中指定的工作表数据:data =
xlsread(filename, sheet) 其中,sheet为要读取的工作表名称或索引(从1开始)。
data为一个矩阵,包含了指定工作表中的所有数据。
3. 读取指定单元格范围的数据:data = xlsread(filename, range) 其中,range为要读取的单元格范围,格式为'A1:B10',表示从单元格A1到B10的范围。
data为一个矩阵,包含了指定范围的数据。
除了以上的基本用法外,xlsread函数还提供了其他几个可选的输入参数,用于指定数据起始位置、数据转换方式等。
更详细的用法可以通过在MATLAB命令窗口中输入"help xlsread"来查看。
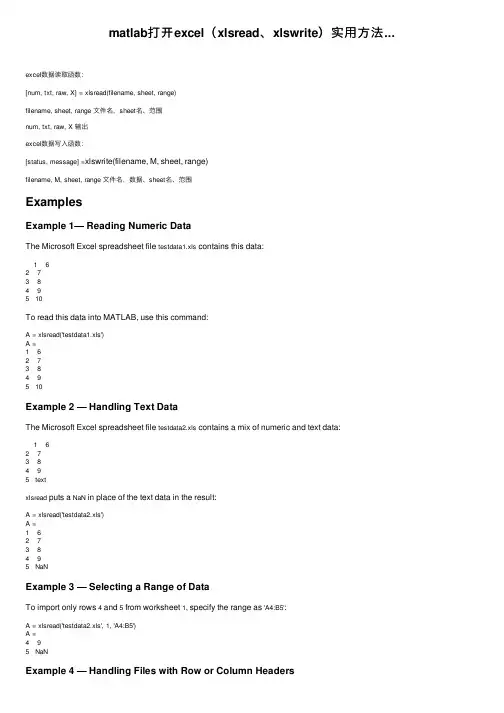
matlab打开excel(xlsread、xlswrite)实⽤⽅法...excel数据读取函数:[num, txt, raw, X] =xlsread(filename, sheet, range)filename, sheet, range ⽂件名,sheet名、范围num, txt, raw, X 输出excel数据写⼊函数:[status, message] =xlswrite(filename, M, sheet, range)filename, M, sheet, range ⽂件名,数据、sheet名、范围ExamplesExample 1— Reading Numeric DataThe Microsoft Excel spreadsheet file testdata1.xls contains this data:1 62 73 84 95 10To read this data into MATLAB, use this command:A = xlsread('testdata1.xls')A =1 62 73 84 95 10Example 2 — Handling Text DataThe Microsoft Excel spreadsheet file testdata2.xls contains a mix of numeric and text data:1 62 73 84 95 textxlsread puts a NaN in place of the text data in the result:A = xlsread('testdata2.xls')A =1 62 73 84 95 NaNExample 3 — Selecting a Range of DataTo import only rows 4 and 5 from worksheet 1, specify the range as 'A4:B5':A = xlsread('testdata2.xls', 1, 'A4:B5')A =4 95 NaNExample 4 — Handling Files with Row or Column HeadersA Microsoft Excel spreadsheet labeled Temperatures in file tempdata.xls contains two columns of numeric data with text headers for each column:Time Temp12 9813 9914 97If you want to import only the numeric data, use xlsread with a single return argument. Specify the filename and sheet name as inputs.xlsread ignores any leading row or column of text in the numeric result.ndata = xlsread('tempdata.xls', 'Temperatures')ndata =12 9813 9914 97To import both the numeric data and the text data, specify two return values for xlsread:[ndata, headertext] = xlsread('tempdata.xls', 'Temperatures')ndata =12 9813 9914 97headertext ='Time' 'Temp'+++++++++++++++++++++++++++++++++++++++++++++++++++++++++++++++++++++++ExamplesExample 1 — Writing Numeric Data to the Default WorksheetWrite a 7-element vector to Microsoft Excel file testdata.xls. By default, xlswrite writes the data to cells A1 through G1 in the first worksheet in the file: xlswrite('testdata.xls', [12.7 5.02 -98 63.9 0 -.2 56])Example 2 — Writing Mixed Data to a Specific WorksheetThis example writes the following mixed text and numeric data to the file tempdata.xls:d = {'Time', 'Temp'; 12 98; 13 99; 14 97};Call xlswrite, specifying the worksheet labeled Temperatures, and the region within the worksheet to write the data to. xlswrite writes the 4-by-2 matrix to the rectangular region that starts at cell E1 in its upper left corner:s = xlswrite('tempdata.xls', d, 'Temperatures', 'E1')s =1The output status s shows that the write operation succeeded. The data appears as shown here in the output file:Time Temp12 9813 9914 97Example 3 — Appending a New Worksheet to the FileNow write the same data to a worksheet that doesn’t yet exist in tempdata.xls. In this case, xlswrite appends a new sheet to the workbook, calling it by the name you supplied in the sheets input argument, 'NewTemp'. xlswrite displays a warning indicating that it has added a new worksheet to the file:xlswrite('tempdata.xls', d, 'NewTemp', 'E1')Warning: Added specified worksheet.If you don’t want to see these warnings, you can turn them off with this command:warning off MATLAB:xlswrite:AddSheetNow try the write command again, this time creating another new worksheet, NewTemp2. Although the message does not appear this time, you can still retrieve it and its identifier from the second output argument, msg:[stat msg] = xlswrite('tempdata.xls', d, 'NewTemp2', 'E1');msgmsg =message: 'Added specified worksheet.'identifier: 'MATLAB:xlswrite:AddSheet'No Related Post。
xlsread函数
xlsread函数是MATLAB中一个非常重要的函数,它可以用来读取Excel文件中的数据。
在实际工作中,我们经常需要从Excel文件中读取数据进行分析和处理,而xlsread函数就是一个非常方便的工具。
使用xlsread函数非常简单,只需要在MATLAB命令窗口中输入以下命令即可:
[data, text, raw] = xlsread('filename', 'sheet', 'range')
其中,filename表示Excel文件名,sheet表示工作表名,range表示读取的数据范围。
xlsread函数会将Excel文件中的数据读取到MATLAB中,并返回三个变量:data、text和raw。
data变量是一个矩阵,其中存储了Excel文件中的数值数据。
text 变量是一个单元格数组,其中存储了Excel文件中的文本数据。
raw 变量是一个混合数组,其中存储了Excel文件中的所有数据,包括数值和文本。
除了以上三个变量,xlsread函数还可以返回其他一些信息,比如Excel文件中的列名和行名等。
具体可以参考MATLAB的帮助文档。
需要注意的是,xlsread函数只能读取Excel文件中的数据,而不能
修改或保存Excel文件。
如果需要修改或保存Excel文件,可以使用MATLAB中的其他函数,比如xlswrite函数。
xlsread函数是MATLAB中一个非常实用的函数,它可以帮助我们快速地读取Excel文件中的数据,并进行进一步的分析和处理。
如果你经常需要从Excel文件中读取数据,那么一定要掌握好这个函数。
MATLAB读取excel文件中的数据
使用函数:[NUM,TXT,RAW]=xlsread('example')
读取整个表格中的数据
Excel中的数据:
首先我们将此excel选入当前工作目录(必要步骤),然后再MATLAB主窗口中输入下面命令:[NUM,TXT,RAW]=xlsread('example'),其中example是你的excel文件名。
得到结果
NUM返回的是excel中的数据,TXT输出的是文本内容,RAW输出的是未处理数据,这里因为文本占用的矩阵一共是8行6列,所以就输出了如上内容。
一般情况下,我们读取的都是excel中的数据,所以可以直接用[NUM]=xlsread('example'),只输出数据矩阵便可。
读取指定sheet中的数据
假如想读取第二个sheet中的数据,由于matlab读取excel中的数据是按照sheet在excel 中的排放顺序来的,sheet3现在排在第二位,我们输入命令[NUM]=xlsread('example',2)
读取指定单元格的数据
假设我们读取A1-B4之间的数据,那么我们输入命令num=xlsread('1.xls','A1:B4') 结果如下:。
xlsread函数用法
一. 简介
xlsread函数是MATLAB中用于读取Excel文件的函数,它可以从Excel文件中读取数据并将数据存储为MATLAB数组。
xlsread函数可以读取Excel文件中的数字、字符、公式等数据类型,并且可以读取任意大小的Excel文件。
二. 语法
xlsread函数的基本语法如下:
A = xlsread(filename,sheet,range)
参数说明:
- filename:Excel文件的名称或者包含文件路径的完整文件名。
- sheet:Excel中的工作表名称或索引号。
默认值为1,表示第一个工作表。
- range:指定待读取数据的范围。
可以指定单个单元格、单行、单列或多行多列的范围。
返回值:
- A:读取到的Excel数据,存储为MATLAB数组。
三. 示例
1. 读取整个Excel文件
为了演示xlsread函数的用法,先创建一个包含数据的Excel文件,然后使用xlsread函数读取这个文件。
```Matlab
A = xlsread('data.xlsx');
```
这段代码将读取名为\。