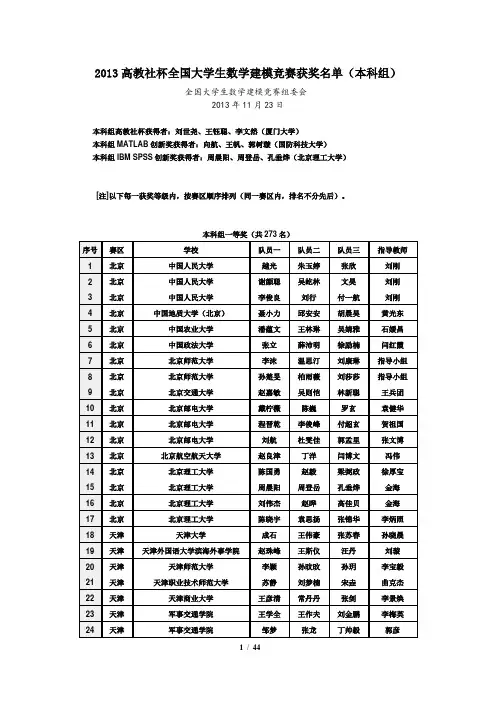
2013数学建模优秀作品
- 格式:doc
- 大小:1.01 MB
- 文档页数:31
承诺书我们仔细阅读了《全国大学生数学建模竞赛章程》和《全国大学生数学建模竞赛参赛规则》(以下简称为“竞赛章程和参赛规则”,可从全国大学生数学建模竞赛网站下载)。
我们完全明白,在竞赛开始后参赛队员不能以任何方式(包括电话、电子邮件、网上咨询等)与队外的任何人(包括指导教师)研究、讨论与赛题有关的问题。
我们知道,抄袭别人的成果是违反竞赛章程和参赛规则的,如果引用别人的成果或其他公开的资料(包括网上查到的资料),必须按照规定的参考文献的表述方式在正文引用处和参考文献中明确列出。
我们郑重承诺,严格遵守竞赛章程和参赛规则,以保证竞赛的公正、公平性。
如有违反竞赛章程和参赛规则的行为,我们将受到严肃处理。
我们授权全国大学生数学建模竞赛组委会,可将我们的论文以任何形式进行公开展示(包括进行网上公示,在书籍、期刊和其他媒体进行正式或非正式发表等)。
我们参赛选择的题号是(从A/B/C/D中选择一项填写): D我们的参赛报名号为(即为你队的电子文件名):所属学校(请填写完整的全名):参赛队员(打印并签名) :1.2.3.指导教师或指导教师组负责人(打印并签名):(论文纸质版与电子版中的以上信息必须一致,只是电子版中无需签名。
以上内容请仔细核对,提交后将不再允许做任何修改。
如填写错误,论文可能被取消评奖资格。
)日期: 2013 年 9 月 16 日赛区评阅编号(由赛区组委会评阅前进行编号):编号专用页赛区评阅编号(由赛区组委会评阅前进行编号):全国统一编号(由赛区组委会送交全国前编号):全国评阅编号(由全国组委会评阅前进行编号):公共自行车服务系统优化模型摘要本模型的解决是为了提高公共自行车的使用率。
问题一,根据附件1中的公共自行车数据可统计出各站点20天中每天及累计的借车频次和还车频次(见于附件1),并得出各个站点累计的借车频次和还车频次进行从小到大的排序(见于附件2)。
根据附件1,可以得知每次用车的时长的统计,并根据此统计数据使用EXCEL软件描绘每次用车时长的分布图,通过此图,可以得知:用车时间在0—60分钟的次数较多,在20分钟附近较为突出,超过60分钟的次数较少。
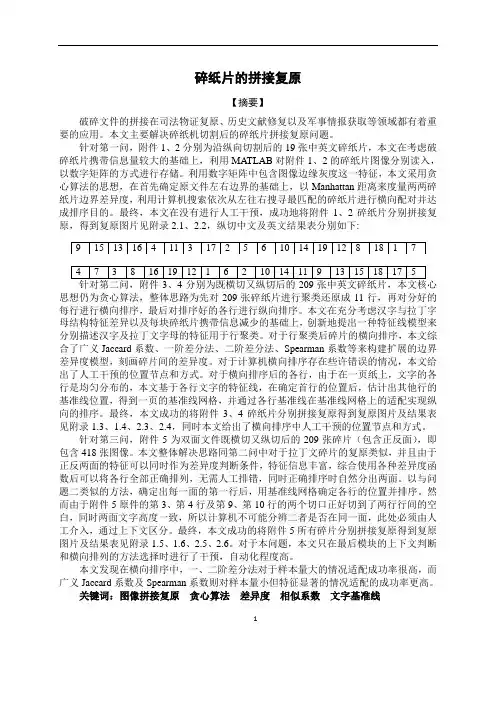
碎纸片的拼接复原【摘要】破碎文件的拼接在司法物证复原、历史文献修复以及军事情报获取等领域都有着重要的应用。
本文主要解决碎纸机切割后的碎纸片拼接复原问题。
针对第一问,附件1、2分别为沿纵向切割后的19张中英文碎纸片,本文在考虑破碎纸片携带信息量较大的基础上,利用MATLAB对附件1、2的碎纸片图像分别读入,以数字矩阵的方式进行存储。
利用数字矩阵中包含图像边缘灰度这一特征,本文采用贪心算法的思想,在首先确定原文件左右边界的基础上,以Manhattan距离来度量两两碎纸片边界差异度,利用计算机搜索依次从左往右搜寻最匹配的碎纸片进行横向配对并达成排序目的。
最终,本文在没有进行人工干预,成功地将附件1、2碎纸片分别拼接复原,得到复原图片见附录2.1、2.2,纵切中文及英文结果表分别如下:思想仍为贪心算法,整体思路为先对209张碎纸片进行聚类还原成11行,再对分好的每行进行横向排序,最后对排序好的各行进行纵向排序。
本文在充分考虑汉字与拉丁字母结构特征差异以及每块碎纸片携带信息减少的基础上,创新地提出一种特征线模型来分别描述汉字及拉丁文字母的特征用于行聚类。
对于行聚类后碎片的横向排序,本文综合了广义Jaccard系数、一阶差分法、二阶差分法、Spearman系数等来构建扩展的边界差异度模型,刻画碎片间的差异度。
对于计算机横向排序存在些许错误的情况,本文给出了人工干预的位置节点和方式。
对于横向排序后的各行,由于在一页纸上,文字的各行是均匀分布的,本文基于各行文字的特征线,在确定首行的位置后,估计出其他行的基准线位置,得到一页的基准线网格,并通过各行基准线在基准线网格上的适配实现纵向的排序。
最终,本文成功的将附件3、4碎纸片分别拼接复原得到复原图片及结果表见附录1.3、1.4、2.3、2.4,同时本文给出了横向排序中人工干预的位置节点和方式。
针对第三问,附件5为双面文件既横切又纵切后的209张碎片(包含正反面),即包含418张图像。
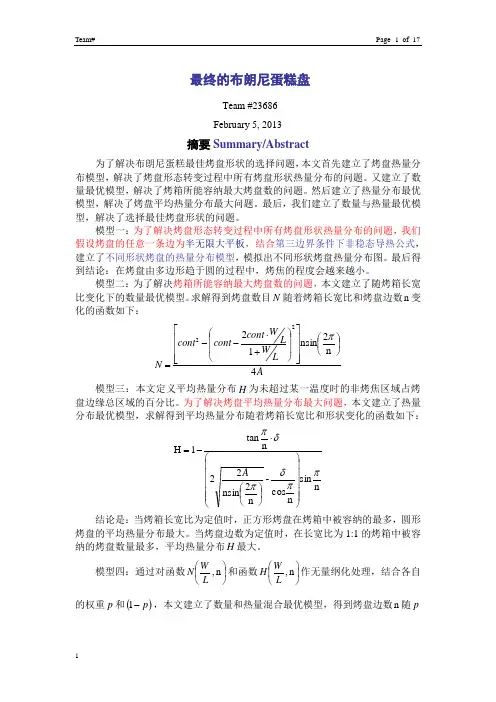
最终的布朗尼蛋糕盘Team #23686 February 5, 2013摘要Summary/Abstract为了解决布朗尼蛋糕最佳烤盘形状的选择问题,本文首先建立了烤盘热量分布模型,解决了烤盘形态转变过程中所有烤盘形状热量分布的问题。
又建立了数量最优模型,解决了烤箱所能容纳最大烤盘数的问题。
然后建立了热量分布最优模型,解决了烤盘平均热量分布最大问题。
最后,我们建立了数量与热量最优模型,解决了选择最佳烤盘形状的问题。
模型一:为了解决烤盘形态转变过程中所有烤盘形状热量分布的问题,我们假设烤盘的任意一条边为半无限大平板,结合第三边界条件下非稳态导热公式,建立了不同形状烤盘的热量分布模型,模拟出不同形状烤盘热量分布图。
最后得到结论:在烤盘由多边形趋于圆的过程中,烤焦的程度会越来越小。
模型二:为了解决烤箱所能容纳最大烤盘数的问题,本文建立了随烤箱长宽比变化下的数量最优模型。
求解得到烤盘数目N 随着烤箱长宽比和烤盘边数n 变化的函数如下:AL W L W cont cont cont N 4n2nsin 1222⎪⎭⎫ ⎝⎛⎥⎥⎥⎦⎤⎢⎢⎢⎣⎡⎪⎪⎭⎫ ⎝⎛+⋅--=π模型三:本文定义平均热量分布H 为未超过某一温度时的非烤焦区域占烤盘边缘总区域的百分比。
为了解决烤盘平均热量分布最大问题,本文建立了热量分布最优模型,求解得到平均热量分布随着烤箱长宽比和形状变化的函数如下:n sin n cos -n 2nsin 22ntan1H ππδπδπ⎪⎪⎪⎪⎪⎭⎫⎝⎛⎪⎭⎫ ⎝⎛⋅-=A结论是:当烤箱长宽比为定值时,正方形烤盘在烤箱中被容纳的最多,圆形烤盘的平均热量分布最大。
当烤盘边数为定值时,在长宽比为1:1的烤箱中被容纳的烤盘数量最多,平均热量分布H 最大。
模型四:通过对函数⎪⎭⎫ ⎝⎛n ,L W N 和函数⎪⎭⎫⎝⎛n ,L W H 作无量纲化处理,结合各自的权重p 和()p -1,本文建立了数量和热量混合最优模型,得到烤盘边数n 随p值和LW的函数。
第六届“认证杯”数学中国数学建模网络挑战赛承诺书我们仔细阅读了第六届“认证杯”数学中国数学建模网络挑战赛的竞赛规则。
我们完全明白,在竞赛开始后参赛队员不能以任何方式(包括电话、电子邮件、网上咨询等)与队外的任何人(包括指导教师)研究、讨论与赛题有关的问题。
我们知道,抄袭别人的成果是违反竞赛规则的, 如果引用别人的成果或其他公开的资料(包括网上查到的资料),必须按照规定的参考文献的表述方式在正文引用处和参考文献中明确列出。
我们郑重承诺,严格遵守竞赛规则,以保证竞赛的公正、公平性。
如有违反竞赛规则的行为,我们将受到严肃处理。
我们允许数学中国网站()公布论文,以供网友之间学习交流,数学中国网站以非商业目的的论文交流不需要提前取得我们的同意。
我们的参赛队号为:2261参赛队员(签名) :队员1:张述平队员2:魏方征队员3:乔赛参赛队教练员(签名):参赛队伍组别:2261第六届“认证杯”数学中国数学建模网络挑战赛编号专用页参赛队伍的参赛队号:2261竞赛统一编号(由竞赛组委会送至评委团前编号):竞赛评阅编号(由竞赛评委团评阅前进行编号):2013年第六届“认证杯”数学中国数学建模网络挑战赛题目护岸框架减速效果的优化方案关键词护岸框架减速效果单因素方差分析最小二乘拟合回归分析摘要:四面六边透水框架是一种新型江河护岸工程技术,对于降低岸边流速、稳定河道、保护堤岸有显著的作用。
本文针对所引用参考文献中的图像、数据,从四面六边透水框架群框架尺寸、架空率和长度三方面出发,对框架群的水力特性及其影响因素进行分析,探讨三要素对减速效果的影响,建立三个模型,为这种“亲水”式生态防护技术在工程中推广运用提供参考依据。
模型一:架空率对减速效果影响的分析。
首先,利用单因素方差分析,推断出架空率对减速效果的影响较显著;其次,采取最小二乘法拟合曲线具体演示二者的发展趋势,并得到关系模型,依照此模型得出架空率对减速效果影响显著。
得出框架率ε=4.2~4.8 之间时,框架群的减速率比较高,能够使得框架群的阻水消能作用和“亲水”功能较好的结合起来。
关于公布2013全国大学生数学建模竞赛陕西赛区获奖名单(初稿)的说明
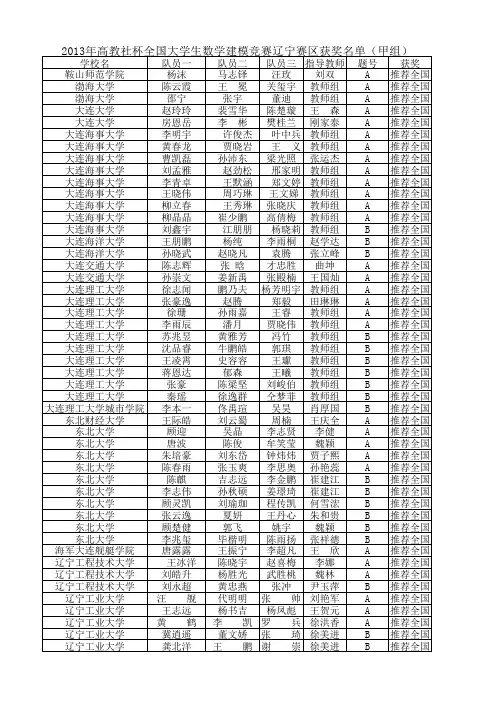
2013全国大学生数学建模竞赛陕西赛区获奖名单
(初稿)
陕西赛区优秀组织工作奖(排名不分先后)
西安交通大学西安文理学院
西北工业大学西安外事学院
西安电子科技大学西安欧亚学院
西北大学西京学院
西安理工大学空军工程大学
陕西科技大学西安航空职业技术学院
西安科技大学西安铁路职业技术学院
延安大学陕西工商职业学院
西安邮电大学延安大学西安创新学院
陕西理工学院
本科组、专科组获奖名单(按获奖等级排列;同一等级内按本科组、专科组分别排列;同一等级同一组内学校排名不分先后)
本科组全国一等奖(17名)
专科组全国一等奖(2名)
本科组全国二等奖(56名)
专科组全国二等奖(20名)
本科组陕西一等奖(188名)
专科组陕西一等奖(50名)
本科组陕西二等奖(367名)
专科组陕西二等奖(102名)。
2013年全国大学生数学建模竞赛河北赛区获奖名单2013年全国大学生数学建模竞赛河北赛区论文评阅工作已经结束,我赛区共有49所院校的743队完成参赛(其中本科组631队)。
经专家评阅,我赛区共评出河北省一等奖84队(其中本科组73队),河北省二等奖154队(其中本科组130),名单如下。
最终获奖名单以河北省教育厅文件及证书为准。
全国大学生数学建模竞赛河北赛区组委会2013年10月5日获奖名单:队员1 队员2 队员3 指导教师学校奖项顾志明李盛鹏展朝飞张翠莲北华航天工业学院省一等安晓云朱凌正李涛相秀芬承德石油高等专科学校省一等李仰杰刘虎路亚召刘兵承德石油高等专科学校省一等邱丽娟李宁陈兴旺王辉承德石油高等专科学校省一等于紫荫程社磊孙朋杰陈阳承德石油高等专科学校省一等曲原晖黄紫薇任家宽指导教师组东北大学秦皇岛分校省一等沈丽娜杜学甫李振兴指导教师组东北大学秦皇岛分校省一等胡玉崭高小妮刘迪赵春广等邯郸学院省一等刘增林祁美丽张少楠张青等邯郸学院省一等吝红宇董超马宛盈邯郸职业技术学院省一等仝环白志杰刘晓蒙邯郸职业技术学院省一等申江荣刘焕秋张林芳指导教师组河北大学省一等徐丹胡明珠吕红欣指导教师组河北大学省一等张天一柯豪爽李森指导教师组河北大学省一等蔡鹏王涛李林山庞培林河北工程大学省一等缴海洲李蒙张鸿志马丽涛河北工程大学省一等张振运焦增连刘晏榕王晓睿河北工程大学省一等李清泉刘翠翠尹胜利金大永河北工业大学省一等史雪薇邬丽梅张璐王金环河北工业大学省一等王星录罗玉林张亚琨徐勇河北工业大学省一等谢宁高冠楠王亚东谭春晓河北工业大学省一等袁文迁黄雅欢孙畅刁心薇河北工业大学省一等师鹏焕邓伟刘颖指导教师组河北金融学院省一等马银波何学滨皮秋云指导教师组河北科技大学省一等张明史萌珂苏云涛指导教师组河北科技大学省一等王宏恩李肖潘影指导教师组河北科技师范学院省一等蔡沛丰韩菁冯柳伟指导教师组河北联合大学省一等韩伟丹顿温新刘明浩指导教师组河北联合大学省一等夏雪伟王晓蕊张兰兰指导教师组河北联合大学省一等夏亚丽孙鑫徐玉坤指导教师组河北联合大学省一等杨敏尹姗姗严炳指导教师组河北联合大学省一等李瑶刘春龙孙文康指导教师组河北联合大学轻工学院省一等李颖袁树兵冯敦敦指导教师组河北联合大学轻工学院省一等钱永杰李一帆张丽艳指导教师组河北联合大学轻工学院省一等国维洁刘乐吕晓雅尚宇辉河北民族师范学院省一等何莎莎王丽娟胡振红左亚丽河北民族师范学院省一等范松郑伟丽孟毅远指导教师组河北农业大学省一等王欣宇董青青刘雪解建军河北师范大学省一等张燕华丁玲玲崔雅洁王志巍河北师范大学省一等边静于新利周帅虎侯波河北师范大学汇华学院省一等王泰业尤扬吴臻王娜衡水学院省一等曹澄沙刘畅李博孔倩华北电力大学省一等曹昕孙聪王资博张坡华北电力大学省一等陈垒尹唱王康成张坡华北电力大学省一等董文凯靳伟佳殷加玞指导教师组华北电力大学省一等李大勇闫人滏汤钰赵美玲华北电力大学省一等汤潘邓睿臧晓玲孔倩华北电力大学省一等王凯陈章妍俞飞杨刘敬刚华北电力大学省一等王怡聪张伟波马启超张亚刚华北电力大学省一等顼佳宇杨智伟孟天骄赵美玲华北电力大学省一等余泽远邱智韬陈晓琳刘敬刚华北电力大学省一等赵珈靓祁俊雄张和泉张隆阁华北电力大学省一等赵炜林荧史康宁刘敬刚华北电力大学省一等周奥军毛宇晗张超炜指导教师组华北电力大学省一等牛玺童高钢锋李淼指导教师组华北电力大学科技学院省一等张玉杰金绘民张泽帅指导教师组华北电力大学科技学院省一等程胜杰杨书河王琛杨文光华北科技学院省一等阎祥善毛铭芷郑翰翔指导教师组军械工程学院省一等龙鑫董辛燕许园园刘凤君廊坊师范学院省一等勾立健邵建敏郑坤赵鹏廊坊燕京职业技术学院省一等杨杏刘凤张永乾辛玉东石家庄经济学院省一等尹奕丹田利王清彦康娜石家庄经济学院省一等张晓蕊王艳华李津康娜石家庄经济学院省一等刘勇超张健雨李潇王秋宝石家庄铁道大学省一等祁炎萍杨洋吴梦瑶张保才石家庄铁道大学省一等徐旭晨赵圣婴程里浩王永亮石家庄铁道大学省一等赵大志郑乐乐赵习超孙秋杰石家庄铁道大学省一等周亚男刘昱丞董书月商美娟石家庄学院省一等曹群韩永朋李洪水冯娟邢台学院省一等甘纯王飞魏东章胤燕山大学省一等桑志远陈敬东胡秀珍李建东燕山大学省一等王敏马玲魏伟赵晓知燕山大学省一等王越耿冬冬牛安琪张晓冉燕山大学省一等武明康徐旭陈思赵晓华燕山大学省一等闫莉莉房丽鹏张楠宋向东燕山大学省一等杨宝山郭彦杰王霞王艳宁燕山大学省一等赵晓史海杰朱晓龙章胤燕山大学省一等祝根朱丽蓉姜景耀章胤燕山大学省一等黄金华王倩悦李奇阳杨洋等燕山大学里仁学院省一等孟爱文吴瑶张琳爽汪梅婷等燕山大学里仁学院省一等乔喜伟马灿王勇樊剑武等燕山大学里仁学院省一等杨鹏程王美美王薇章胤等燕山大学里仁学院省一等韩春雨孙璐杨立强姜春艳中国人民武装警察部队学院省一等罗郑桥史化成周英杰兰月新中国人民武装警察部队学院省一等董珍珍王鹏卉卢金库指导组保定学院省二等程金明安朋涛赵泽毫陈博海北华航天工业学院省二等方驰苏鑫夏雅男江志超北华航天工业学院省二等韩琦李桦楠孟明聂铭玮北华航天工业学院省二等岳涛曹东方杨旭全李晓玲北京交通大学海滨学院省二等张继龙华江波杨娇娇陈丙振北京交通大学海滨学院省二等盖伟浩李风波王佳欢王辉承德石油高等专科学校省二等刘冰徐杰孟德良毛羽强承德石油高等专科学校省二等马可心张慧改孙鹏蔡谋全承德石油高等专科学校省二等王雅婵闫召亮王宁张红玉承德石油高等专科学校省二等焦昀涛何世伟凌亚娟指导教师组东北大学秦皇岛分校省二等李福盛段凯云许红威指导教师组东北大学秦皇岛分校省二等孟令伍王满梁艳丽指导教师组东北大学秦皇岛分校省二等王双翁嘉佳王奕蓝指导教师组东北大学秦皇岛分校省二等王煜张天宇周琳指导教师组东北大学秦皇岛分校省二等王丹丹贡欢吴宇指导教师组东北大学秦皇岛分校省二等杨志强朱川蔡青松指导教师组东北大学秦皇岛分校省二等周晔刘江南张栋指导教师组东北大学秦皇岛分校省二等丁艳青王东穆明慧靳志同防灾科技学院省二等李向恒陈胜斌刘启萌张丽娟防灾科技学院省二等张玉静吴胤君张显张丽娟防灾科技学院省二等张照京陈安国李浩钱小仕防灾科技学院省二等赵庆彬王茜茜赵静刘丽英等邯郸学院省二等武远东柴会芳郑延荞邯郸职业技术学院省二等张娟高书红李晶马鹏程河北北方学院省二等王亮曹营营张今指导教师组河北大学省二等杨奕慰徐大菲赵云杰指导教师组河北大学省二等冯晓云李晓娜刘莉王晓睿河北工程大学省二等李双双李慧君陈道森路瑞华河北工程大学省二等马龙亮黎亨卓田立瑶周少玲河北工程大学省二等高静梅李君艳国江涛穆国旺河北工业大学省二等韩雨王娇彭中硕郭献洲河北工业大学省二等李杨庞天宇侯丽媛孔海荣河北工业大学省二等刘晓倩王翠柳李欣孙丞河北工业大学省二等施江程马昊宋晓龙孙光坤河北工业大学省二等苗亦山杨阳许丙顺宋从芝等河北工业职业技术学院省二等高千鹤李安曼张帆指导教师组河北金融学院省二等安森许向前岳小芬指导教师组河北科技大学省二等蔡献敏刘怀宇高兵指导教师组河北科技大学省二等杜玫马涛周楠楠指导教师组河北科技大学省二等史建博高陶刘冲指导教师组河北科技大学省二等孙晓庆张赛刘思佳指导教师组河北科技大学省二等陈倩倩杨珍李森指导教师组河北科技师范学院省二等高立思魏文哲翟小娟指导教师组河北科技师范学院省二等孙鸿丽王晓娜张晓娜指导教师组河北科技师范学院省二等柏玲常爽王彬指导教师组河北联合大学省二等高星乐段珊刘云指导教师组河北联合大学省二等黄健初毅张雅男指导教师组河北联合大学省二等敬志奇李岩陈凤栋指导教师组河北联合大学省二等李佳刘元东陈立卓指导教师组河北联合大学省二等刘道进李小雪赵聪指导教师组河北联合大学省二等罗昕祺郑惠婷赵振勇指导教师组河北联合大学省二等孙朋川吴宇航李晨曦指导教师组河北联合大学省二等王雪梅国占飞卢丽丹指导教师组河北联合大学省二等陈紫文黄朋欣付赛指导教师组河北联合大学轻工学院省二等崔晓东国宇任文静指导教师组河北联合大学轻工学院省二等范理诚田朝阳邹蕊灿指导教师组河北联合大学轻工学院省二等冯国辉崔莹莹殷文硕指导教师组河北联合大学轻工学院省二等李亚子张园园刘根禹指导教师组河北联合大学轻工学院省二等彭凯旋王亮王路指导教师组河北联合大学轻工学院省二等隋愿王少丹展明瑶指导教师组河北联合大学轻工学院省二等于俊鹏李娜王伟指导教师组河北联合大学轻工学院省二等张浩杰封乾隆李凡指导教师组河北联合大学轻工学院省二等郑超张利伟王晓琴指导教师组河北联合大学轻工学院省二等敬志奇李岩陈凤栋指导教师组河北联合大学省二等李佳刘元东陈立卓指导教师组河北联合大学省二等刘道进李小雪赵聪指导教师组河北联合大学省二等罗昕祺郑惠婷赵振勇指导教师组河北联合大学省二等孙朋川吴宇航李晨曦指导教师组河北联合大学省二等王雪梅国占飞卢丽丹指导教师组河北联合大学省二等陈紫文黄朋欣付赛指导教师组河北联合大学轻工学院省二等崔晓东国宇任文静指导教师组河北联合大学轻工学院省二等范理诚田朝阳邹蕊灿指导教师组河北联合大学轻工学院省二等冯国辉崔莹莹殷文硕指导教师组河北联合大学轻工学院省二等李亚子张园园刘根禹指导教师组河北联合大学轻工学院省二等彭凯旋王亮王路指导教师组河北联合大学轻工学院省二等隋愿王少丹展明瑶指导教师组河北联合大学轻工学院省二等于俊鹏李娜王伟指导教师组河北联合大学轻工学院省二等张浩杰封乾隆李凡指导教师组河北联合大学轻工学院省二等郑超张利伟王晓琴指导教师组河北联合大学轻工学院省二等邵逸桓申振华杜桂明周婷衡水学院省二等陈明渊张怡王新赫张隆阁华北电力大学省二等洪冬欢周丽娟曹大卫马燕鹏华北电力大学省二等王一飞姜宇轩蒋乐赵美玲华北电力大学省二等杨达马玉龙张岩张亚刚华北电力大学省二等杨宏宇任洁马梦祥张隆阁华北电力大学省二等周晨祝凯庄颖涛马新顺华北电力大学省二等周雁南王茜戴岸珏刘敬刚华北电力大学省二等周仲强刘宏杨黄淳驿张坡华北电力大学省二等高峰王松史超张文彬华北电力大学科技学院省二等高文林王冰川刘越李雨华北电力大学科技学院省二等李阮王士勤王永治指导教师组华北电力大学科技学院省二等冯富威吴东霖黄姗杨文光华北科技学院省二等连瑞锋李永亮葛增晔魏静华北科技学院省二等叶声俊朱文浩王华李强丽华北科技学院省二等丁申虎何静牛子硕指导教师组军械工程学院省二等葛绪龙宋楠迪肖义指导教师组军械工程学院省二等刘书友刘飞宋泉霖指导教师组军械工程学院省二等刘征刘瑶李向阳指导教师组军械工程学院省二等张冠湘牟弦和段小杰指导教师组军械工程学院省二等曹大林胡佳辉韩荣荣李文升廊坊师范学院省二等房翠娟张煜唱韩伟歌康娜石家庄经济学院省二等郭泽泽许杰敏高朵康娜石家庄经济学院省二等姜华陈荣王雪静辛玉东石家庄经济学院省二等姜月娜李冰杰熊元瑟辛玉东石家庄经济学院省二等李玉王婷杨紫佳辛玉东石家庄经济学院省二等刘丹霍金山袁玥康娜石家庄经济学院省二等卢迪王璐孟铭康娜石家庄经济学院省二等乔丹赵楚月朱培培辛玉东石家庄经济学院省二等杨探赵月赵晗康娜石家庄经济学院省二等张东雷杜海峰韩雨浩康娜石家庄经济学院省二等张洁李涛贾红芳康娜石家庄经济学院省二等张君伍杨兰陈欣欣康娜石家庄经济学院省二等章伟韩春广刘红豆指导教师组石家庄理工职业学院省二等高延行刘斯睿尹元志陈庆辉石家庄铁道大学省二等李浩王素稳侯赛张保才石家庄铁道大学省二等吕良玉余浩淼墨宁宁赵晔石家庄铁道大学省二等吴璋翔张斌赵轶群刘宝友石家庄铁道大学省二等谢义昌马康马郡浛田瑞兰石家庄铁道大学省二等杨盼伟邓国猛李威陈聚峰石家庄铁道大学省二等侯立发李江涛李晓燕郑莉芳石家庄铁道大学四方学院省二等张月单正洲杜飞申思远石家庄铁道大学四方学院省二等郭超赵培葛陈明月许聪聪石家庄铁路职业技术学院省二等武乐晓王志明郝志辉杨林广石家庄铁路职业技术学院省二等姚顺程王娜李云帆魏会贤石家庄铁路职业技术学院省二等苗云飞王志波王梦云商美娟石家庄学院省二等王志强袁春欢袁丽丽商美娟石家庄学院省二等杨杉张凛然谢璐崔永刚石家庄学院省二等于跃赵桂林赵彦茜李伟才石家庄学院省二等张丽芙武永晶支福才张东凯石家庄学院省二等鲁情张明洁蒋立蓉指导教师组石家庄邮电职业技术学院省二等王广宇李海波杨春园指导教师组石家庄邮电职业技术学院省二等赵川涛廖水凤邹亮指导教师组石家庄邮电职业技术学院省二等马凯柳吴延武李停陈佩宁石家庄职业技术学院省二等魏鹏飞刘力恒邢磊陈佩宁石家庄职业技术学院省二等毕秋慧金坤萌钱亚宁孙秀娟唐山师范学院省二等王晓聪李想左秀秀王成唐山学院省二等曹秋寒高云艳孙静杨静唐山职业技术学院省二等郑树超宋乐张文斌李国成唐山职业技术学院省二等周天恒宋晨晨孙宁宁刘金民唐山职业技术学院省二等杨欢欢董博陈彬张洁邢台职业技术学院省二等张俊英刘璐杨金佳张凤等燕京理工学院省二等陈迪何少坤路晓艳赵晓知燕山大学省二等董卓娇姚辉孟超王艳宁燕山大学省二等韩立飞杨超曹志良赵晓知燕山大学省二等贾文笑张朋温胜男管巍燕山大学省二等蒋名超闫羽春何姣王永茂燕山大学省二等李三强刘伟郑雪梅王艳宁燕山大学省二等梁峻槐黄艾彤刘若男章胤燕山大学省二等刘光冉郭朝江张静李建东燕山大学省二等刘林郝晶田学红宋向东燕山大学省二等杨越于东东丰亚洁管巍燕山大学省二等杨志明杨乐霍肖汗李建东燕山大学省二等周意陈志广牛雅馨鄂成国等燕山大学里仁学院省二等刘甲毅李忠昊庞春楠刘丽芳中国人民武装警察部队学院省二等马萌陈俊光何敏陈广雷中国人民武装警察部队学院省二等齐月罡阮理朱亚杰庞坤中国人民武装警察部队学院省二等昝永健孟敬彬崔博姜春艳中国人民武装警察部队学院省二等张涵黄韬王天玺刘宏中国人民武装警察部队学院省二等。
SummaryLeaf shape plasticity has long been a heated topic in the field of morphology and taxonomy. Although numerous researchers have been involved in the study of how the shape formation is controlled by genes and environmental stress, little has been done to address the interactions between different plant organs. In this paper, we approach this issue in a creative way: starting from isolated parts (leaves), building connections (leaf-leaf, leaf-branch) and drawing the big picture of the entire system (tree).The mathematical model introduced in this paper describes morphological, physiological and partially ecological properties of the vegetations. First and foremost, relative errors of the numerical outputs are limited within 7.5% and all the values predicted are within the right order of magnitude. Moreover, biological intuition is presented in the consistent manner. For instance, the dynamic positive feedback is applied to describe leaf growth pattern and transportation process. It is also worth noticing that a much simple and flexible algorithm is achieved by executing ingenious geometric strategy.Interestingly findings were generated in the procedures of solving the problems. The seemly unrelated bio-phenomena could be explained when morphological, physiological and partially ecological interactions were taken into account. To illustrate, as we conducted the leaf mass estimation, it could give us a rough picture of leaf-leaf, leaf-branch, and leaf-tree relations.Dear editor,The topic of this paper is about mathematical modeling of tree leaves as well as how leaf traits impose influence on the tree system.In this paper, we addressed the morphological, physiological and partially ecological properties of the vegetations by applying a series of modeling process to related issues. The performance of our model in the sensitivity test satisfied our expectation. Different from the previous research, we approached this issue in a creative way: starting from isolated parts (leaves), building connections (leaf-leaf, leaf-branch) and drawing the big picture of the entire system (tree).Interestingly, the seemly unrelated bio-phenomena could be explained when morphological, physiological and partially ecological interactions were taken into account. Properties of the individual leaves are closely related to the characteristics of the entire tree system.We are looking forward to your comments and revision. Hopefully, our paper could be published in this Journal.Your sincerelyIntroductionThe mechanism of plant shape plasticity has long been a topic of numerous researches in the field of morphometrics. And leaves have been always favored as the subject because of its two-dimensionality and relative simplicity. The change of leaf shapes are generally regarded as both a genetically determination (Howell, 1998) and results of structural optimization to environmental stress (Hemsley and Poole, 2004). However, little attention is drawn to the interactions between different plant organs (e.g. leaf, branch) and the influence from the system as an entity. To fill this gap, we construct a mathematical model to interpret such in-leaf communications, and perform our analysis on simple leaves.As is shown in some literatures (Stern et al., 2008), simple leaves are classified into different shape catalogs (Figure 1), such as flabellate leaves (e.g. ginkgo), palmate leaves (e.g. maple), and cordate leaves (e.g. Hibiscus tiliaceus). The major criteria of classification are the shape apex, base, and margin of leaves.Figure 1 Shape of LeavesLeaf venation is also a critical component of leaf types. There are three major patterns of major vein organization: pinnate, palmate, and parallel, as are shown in Figure 2.Figure 2 Leaf VenationBesides the diversification in leaf shapes and venation, arrangement of leaves on a stem (phyllotaxy) are generally in three distinct patterns (Figure 3), which are defined by the number of leaves attached to a single node. In most species, leaves are attached alternately or in a spiral along a stem, with one leaf per node. This is called an alternate arrangement. If two leaves are attached at each node, they provide an opposite arrangement. Leaves are whorled when three or more occur at a node. A special case in opposite arrangement is called decussate, if successive pairs are orientated at 90o to each other.Figure 3 Leaf ArrangementReview of previous researches shows that most models developed are based on statistical results (Greig-Smith, 1983). And so far, no model is built to indicate the effect of plant organ interactions (leaf-leaf, leaf-branch) on leaf shapes. The mathematical model presented by us demonstrates the logic of plant-environment and in-plant communications at physiology, inter-organ, and tree system levels. We first。
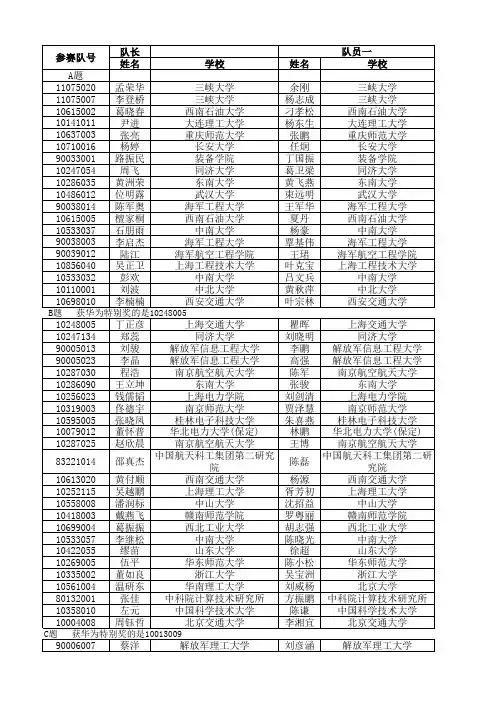
2013年数学建模竞赛获奖名单获奖等姓名(学号)姓名(学号)姓名(学号)所做赛题级特等张珊(03111315) 孙春宇(03111249) 汤敬浩(03111226) A特等刘文康001112 张金剑001113 魏国健021111 B一等牛心怡(03111411)刘思静03101376 严彪03111364 A一等刘洪来03111133 杜啸楠03111135 张国旭03111129 A一等陈超13111209 王程远06113023 汤培梁01115112 A一等狄璠13111265 汪建明02117004 陈彬彬02117006 A一等郭庆13111072 黄华健13111076 王佳唯13111071 A一等陈文康13111332 黄鹂鹏13111329 王英艺13111393 A一等王远远13111108 刘瑞童13111106 刘保君02113076 A一等刘传兴13111058 李津13111082 鲁一鸣13111051 A一等宋嵩焘(07111065)刘俊玮(07111034)王子豪(13111176) A一等何睿杰(07111025)姜思佳(14111085)李恂(13111090) A一等王康烨(07111002)张华斌(07111051)岳明煜(13111232) A一等郭广滨(071141)王亚宁(071141)刘欢(071141) A一等伏臻(07111064)杜景南(07111049)李爽(13111247) A一等连总婷(07111063) 沈强(03111230) 王攀(01119025) A一等孙浩 01111012 潘杰 01111102 宁晨耕 01101396 A一等蔡春磊01111361 薛沨01111410 沈晨阳01111329 A一等郑洋德 04114071 王忠博 04114033 洪礼鑫(04114010) A一等李明郎君021112 王博文021112 徐家辉021112 A一等张诗杰021152 刘明珠061141 葛亚伟021161 A一等鱼婷021113 于泉涌021114 张美021114 B一等张权07116 刘彧千07116 韦红鸽07116 B一等南锋07114 李歌071221 王朝蕊01111 B一等苏春晨021111 谭淼021111 付惠泉021111 B一等谢仁盛021114 冯浩021161 戴涛021051 B一等赵子越021131 费旭明021131 杨铠烨021252 B一等李凯鑫021111 贾徐庆021111 程海021111 B一等张宇涵 01111106 马诗洋 01111082 王凯鹏 01111006 B 一等赵文婷 03111420 潘飞 01114018 金贝贝 03111412 B 一等李鑫01113080 常超舜01113048 李镭01113079 B 一等王雨薇13120040 邓博13121268 尚宁13120038 B 一等王锦锦 01121089 原嘉琦 01115146 郭知君 01121068 B 一等于文辉01121292 刘维斌01121249 曹强01121342 B 一等李海涛01121364 黄星尧01121385 范桂云 07124050 B 一等李璞01111180 严章熙02115013 史思雨07111059 B 一等李华清(01111230)陈人冰01111241)周刘拉(01111225) B 一等刘文东03111086 黄志新03111026 王熙文03101370 B 一等李天霖03111024 马爽03111109 黄辉煌03101283 B 一等张振宇03111121 苏敏章03111139 薄涛03111171 B 一等周培坤13111227 汪波07112039 周晋海00111137 B 一等解晓鹏13111355 张彦芳13111373 吕鑫03111365 B 一等文雪13111099 田朝辉07112029 郭展扩01111170 B 一等陈霏 15101008 冯志燕15101010 柳琳15101004 B 一等程明畅(07111031)张余(07111030)刘栋(00111105) B 一等司萌萌 07111054 徐炜彬 04115058 李豪 07111040 B 一等王薇薇(07112022)王雅欣 13111366 马丁(13111333) B 一等邓成河07121018 刘冲07121037 张瑞02121318 B 一等李忻玮(07111044)赵重微(07113018) 邢明杰(00111115) B 一等聂迎(07111037)林伟红(07112003)张婧昕(04113007) B二等苏伟鑫(14112156)白忠明(14112160)李云(14112171) A 二等张建姣(05114044) 于婷婷(05114046)张海(02111177) A 二等王千郡13111144 张晖13111089 陈云飞13111161 A 二等张淑娥13111203 孙浩02119026 王崇07114087 A 二等郑亚楠13111285 朱立文14111007 刘晓楠07111074 A 二等梁春凤13111259 宋海杰06122028 鲁美玲15111017 A 二等张夏华13111124 孙仁和13111135 张鹤13111138 A 二等朱宇轲13111127 吴强07111021 翟娜13111367 A 二等张添13111216 李信信13111222 吕贺洋13111221 A二等谭浩文13111193 郭倩赟00111114 乔易01115056 A 二等李丹阳13111421 黄凯俊03102011 胡璇08113011 A 二等杨雪维13111370 王静13111422 何倩02111082 A 二等刘江13111107 朱鹏博13111088 王毅旭13111085 A 二等叶红伟(03101247)曾祥哲(03101416)杨亦乐(03101047) A 二等王孝宇03111030贾新禹03111002孙宗豪03111022 A 二等田雷03111007杨亚明03111033苏艳丽06114035 A 二等鲁明捷(03111228) 田雪志(03111246) 宋郝开(07111057) A 二等黄玉辉03111016吴言03111021李烨03111073 A 二等曹跃01119045 孟昱01119054 张容肇01119002 A 二等阎伟豪01111059 王宇轩01111067 田博01111020 A 二等曹茸011015 崔廷立051011 姬佳成071021 A 二等邓堤峡01111372 李晓洁01111404 孙衍超02101059 A 二等王雪松011291 陈磊磊011291 黄蕾011291 A 二等范浩祥 01111288 吴玉奇 01111316 邢碧舟01111304 A 二等吴科永(07111024)彭涛(07111027)白杰(04103135) A 二等张栋(07112034)沈科(13111200)李婷(01111175) A 二等衡通131113 徐猛131113 刘照辉07113 A 二等王亚利07114133 黄代炜07114141 黎南烽07114082 A 二等董春海071141 尤博071142 宗家辉071141 A 二等赵梓旭071141 张乾021114 刘鹏辉071141 A 二等陈香(07112032)赵国旭(07111029)陈学飞(13111298) A 二等陈明明(07112001)戴佳伟(01111360)刑超(02117022) A 二等金喆07114 王力强07114 曾维彬07114 A 二等王思洋07114 武阳07114 赵梦傲07114 A 二等赵鹏宇021151 李朝良021151 宋洋021151 A 二等黄河清021131 张心亮021161 贾岩021131 A 二等程红伟001112 李雁翎021112 沈唱黎021112 A 二等闫冬021111 杨耀凯021111 刘济彰011191 A 二等闫佳男021151 魏雪021151 付腾031013 A 二等张赛捷021151 晁占强031111 安倩楠011152 A 二等郭昱辰021141 李瑞001112 李珂欣001112 B二等林昱溪021191 王耀晖141121 王祖袖001011 B 二等张盛强021114 秦越021114 曹晓燕031014 B 二等吴子琴001112 许天骄001112 宋雪岩001112 B 二等徐畅021241 魏大卫031213 常天元031213 B 二等沈云彬021161 施伟伟021161 陈长灵021161 B 二等吴成龙021114 南智文151111 柳佳雨031111 B 二等蒋进军021114 刘辰宇021114 杨骏锋021114 B 二等徐含02115059 沙志恒02115051 张恺02115076 B 二等李璐021191 于涵021191 B 二等王睿02111081 夏宇哲14112081 胡兴邦02101436 B 二等徐仲元02111063 谢添02111064 徐冠宇02111062 B 二等吴奇021111 杜永志071142 张俊011113 B 二等来阳021041 唐文021151 胡艳艳001112 B 二等申嫱嫱01121294 王菲03121261 李畅14122166 B 二等陈永乐 01113106 何彦宏 01113054 王阳 01113049 B 二等王茹01111390 柏重阳01111353 林燕蓝01111350 B 二等康靖媛01119066 李媛媛03112055 王宇13111192 B 二等仲鸣00111103 袁晓宇00111119 秦杰00111104 B 二等张存01121022 蒋昊01121372 师恺琪01121250 B 二等刘爽00111127 李慧卓07112012 孙媛爽00111118 B 二等孙成越011091 冯健011091 薛潇野011091 B 二等张聪01111331 赵海峰01111382 胡迪坤01119049 B 二等王海锦14121043 王兴文13121120 刘爽14121041 B 二等周柏宇13111119 卫晓倩13121252 李欢13111132 B 二等邢晓波13111164 刘军伟13111165 张宇13111186 B 二等梅涛(03111266) 鲁一凡(03111263) 张楠(03111437) B 二等黄保光03111368周王清03111440张婷03111442 B 二等黄静清03111429马春荣04114014苏佳03101320 B 二等陈柯宇(03111264) 邓书津(03111256) 纪斌(03102066) B 二等朱韦韦03111363孙晓远03111361徐嘉枫03111369 B 二等孙秋旭(03112024) 徐晓涛(03111241) 童晓梦(03112025) B 二等史宽03111385韦金贵03111386柴程03111396 B二等苏亮亮(03121231)刘宇航(03121291)吴欣欣(03121219) B二等魏然(03102020)卢奇(03121275)李东宇(02123028) B二等薛文卓03111220齐晓倩03111211焦文菲03111212 B二等蔡逸(03111269) 周舢(01114011) 刘会(03101367) B二等楼佳珍(00111321) 侯秋侠(00111325) 崔君婷(00111132) B二等孙召昌(03112006)高宏伟(03112033)王兴隆(03112038) B二等张扬扬(00111305) 李磊(00111303) 熊睿(00111319) B二等于莹莹07111076 韩宇欢07111066 王晓东13111189 B二等伍祈应07111009 李佳伟131114 朱家南00111304 B二等张靖灿07111070 冉聃02103095 郭小丁03111305 B二等赵东城07122013 崔元顺07127024 蔡宇杰14120039 B二等谢维(07111045)辛杰(07111010)黄智宇(07111047) B二等姚威071161 郭薇011112 王帅071120 B二等陈新光07114 徐扬021114 腾双131114 B二等唐煜071241 张子恒071241 李润泽011214 B二等陈杰(07111017)雷宇豪(07114127)赵婉彤(07114096) B二等张剑如(07112038)段泽明(01111074)何方良(04115074) B二等王强(071120050 赵成(02111078) 宋超(02111044) B二等王文胜(07112020)王凯月(03112067)林开贤(02111128) B二等周志祥(06113019)夏丽(06113036)韩少菲(06113037) B二等李建苗(06113029) 吴爱萍(06113027) 汪清(06102020) B注:1.请各学院将各参赛队统一编号,院内参赛队不得出现相同编号。
基于统计分析的公共自行车服务系统评价模型研究摘要本文针对温州市鹿城区公共自行车管理中心提供的数据,首先对所给数据进行预处理,建立了相关统计模型,运用SPSS20.0、matlab等软件进行统计分析,最后应用关联度分析法对系统进行评价,并提出改进建议。
针对问题一:在已处理好的数据基础上,建立了频率与频数、用车时长的统计模型,利用SPSS软件分别统计各站点20天中每天及累计的借车及还车频次,得到每天和累计的借车和还车频次(见表五和表六);并对所有站点按累计的借车和还车频次排序(见表七和表八);对每次用车时长的分布情况进行统计分析,画出其分布图(见图一和图二),由图可知:每天用车时长分布形状非常相似且近似服从2 分布。
针对问题二:在已处理好的数据基础上,建立了使用公用自行车的不同借车卡数量的统计模型,利用SPSS统计20天中每天使用不同借车卡数量,其中最大的为第20天的19885;统计了每张借车卡累计借车次数的分布图(见图三),对图形分析可得:借车次数在10次以内的占54.86%,借车次数在10至30次占35.88%,借车次数在30至50次占7.51%,借车次数在50以上占1.75%,最大借车次数高达182次。
针对问题三:根据问题一的分析,已给站点累计所用公共自行车次数最大的一天是第20天。
对于第一小问:利用第20天数据,运用floyd算法求得两站点间最短时间,将站与站间的距离定义为两站间的最短时间与自行车速度之积,同时考虑到了速度和时间的随机误差影响;利用距离的定义,通过matlab计算得两站点最长距离为:675,最短距离为:0.08。
利用问题一中的频数模型,对借还车是同一站点且使用时间在1分钟以上的借还车情况进行统计,得借车频次表(见表十一)和用车时间分布图(见图四)。
对于第二小问:根据问题一的统计,第20天的借车和还车频次最高的站点分别为42(街心公园)和56(五马美食林),利用SPSS统计出两站点借、还车时刻和用车时长的分布图(见图五,图六,图七),由图形分析可知:借还车的高峰期与人们上下班的时间非常吻合,在借还车时间上大体都在一小时以内。
The perfect pan for ovenThe heat transfer in the oven includes heat conduction, heat radiation and heatconvection. We use two-dimensional Fourier heat conduction equation ∂u∂t −α(ð2u∂x2+ð2u∂y2)=f(x, y, t) to make a research on distribution of heat for the pan. Heat source heats the pan by heat radiation. The pan interacts with air in the oven in the way of natural convection, so the pan realizes heat dissipation.We calculate heat radiation based on radiation ability of heat source and heating tube area. We use heat dissipation function to show the pan's different parts' loss of heat caused by natural convection. Both of them consist in heat source function f.The area of the pan is fixed at 0.085m2in this paper. When comparing temperatures at the edges of rectangular pans with different length to width ratios ξ, we can get that the smaller ξ is, the lower the temperature of the edges is. But as long as it is still a rectangle, the amplitude of its drop won't be very big. When we make the pans with fixed area vary from square to round square to round, we find that the bigger the fillet radius is, the lower the temperature of its corners is and the extent of temperature's reducing is large.We fix the bottom area of the oven and area of the pan. Through study, we find that round square's capacity for uniform distribution of heat is far higher than other shape's (except round). The larger the fillet radius of the round square is, the larger the pan’s waste of space is. But heat distribution is more uniform. We work out the optimal solution of pan’s size under different weights p through optimizing the relationship between two conditions. Then we get several oven's width to length ratios of W/L by arranging the pans with the optimal size.I. IntroductionThe temperature of each point in the pan is different. For a rectangular pan, the corners have the highest temperature, so the food is easily overcooked. While the heat is distributed evenly over the entire outer edge and the product is not overcooked at the edges in the round pan.To illustrate the model further, the following information is worth mentioning1.1 Floor space of the panThe floor space of each pan is not the square itself necessarily. In this paper, there are 3 kinds of pans with different shapes, as rectangular pans, round pans and round rectangle pans.For rectangular pan, the floor space is the square itself, and the pans can connect closely without space.For round pans, the diagrammatic sketch of the floor space is as follows:shade stands for the round pan; square stands for the floor spaceFigure 1Round pans have the largest floor space for a certain area. The space between each pan is larger than other two kinds of pans. The coefficient of utilization for the round pans is the lowest.For round rectangle pans, the diagrammatic sketch of the floor space is as follows:shade stands for the round rectangle pan; square stands for the floor spaceFigure 2If the area of the round rectangle is the same as the other two, its floor space is between them. The coefficient of utilization of oven decreases with the radius of expansion.1.2 Introduction of ovenThe oven is usually a cube, no matter it is used in home or for business. A width to length ratio for the oven is not a certain number. There are always two racks in the oven, evenly spaced. There are one or more pans on each rack. To preserve heat for the oven, food is heated by radiation. Heating tube can be made of quartz or metal. The temperature of the tube can reach 800℃ high when the material is quartz. The heating tube is often in the top and bottom of the oven. Heating mode can be heating from top or heating from bottom, and maybe both[1].1.3 Two dimensional equation of conductionTo research the heat distribution of pan, we draw into two dimensional equation[2]of conduction:∂u ∂t −α(ð2u∂x2+ð2u∂y2)=f(x, y, t)In this equation:u- temperature of the pant- time from starting to heatx- the abscissay-ordinateα- thermal diffusivityf- heat source functionThe heat equation is a parabolic partial differential equation which describes the distribution of heat (or variation in temperature) in a given region over time. The heat equation is of fundamental importance in diverse scientific fields. In mathematics, it is the prototypical parabolic partial differential equation. In probability theory, the heat equation is connected with the study of Brownian motion via the Fokker–Planck equation. The diffusion equation, a more general version of the heat equation, arises in connection with the study of chemical diffusion and other related processes.II. The Description of the Problem2.1 The original problemWhen baking in a rectangular pan heat is concentrated in the 4 corners and the product gets overcooked at the corners (and to a lesser extent at the edges). In a round pan the heat is distributed evenly over the entire outer edge and the product is not overcooked at the edges. However, since most ovens are rectangular in shape using round pans is not efficient withrespect to using the space in an oven.Develop a model to show the distribution of heat across the outer edge of a pan for pans of different shapes -rectangular to circular and other shapes in between.Assume1. A width to length ratio of W/L for the oven which is rectangular in shape.2. Each pan must have an area of A.3. Initially two racks in the oven, evenly spaced.Develop a model that can be used to select the best type of pan (shape) under the following conditions:1. Maximize number of pans that can fit in the oven (N)2. Maximize even distribution of heat (H) for the pan3. Optimize a combination of conditions (1) and (2) where weights p and (1- p) are assigned to illustrate how the results vary with different values of W/L and p.In addition to your MCM formatted solution, prepare a one to two page advertising sheet for the new Brownie Gourmet Magazine highlighting your design and results.2.2 Problem analysisWe analyze this problem from 3 aspects, showing as follows:2.2.1 Why the edge of the pan has the highest temperature?The form of heat transfer includes heat radiation, heat conduction and heat convection. Energy of heat radiation comes from heat resource. The further from heat resource, the less energy it gets. Heat conduction happens in the interior of the pan, and heat transfers from part of high temperature to the part of low with the temperature contrast as its motivation. With the two forms of heat transfer above, we find the result is that pan center has the high temperature and the boundary has the low. D epending on that, we can’t explain why the product gets overcooked at the corners while at the edges not. We think that there is natural convection between pan and gas, because the temperature of pan is much higher than that of gas. The convection is connected with the contact area. The point in pan center has a larger contact range with air, so the energy loss from convection is more. While the point in the corners of a rectangular pan has a narrow contact area, the energy loss is less than that in the inner part. Because that above, the energy in the pan center is more than that in corner, and the corners have higher temperature.2.2.2 Analysis of heat distribution in pans in different shapesThe shape of pan includes rectangle, round rectangle and round. When these pans' area is fixed, the rectangles with different shapes can be shown with different length to width ratios. Firstly, we study temperature (maximum temperature) in the corners of rectangles with different length to width ratios. Then we study how temperature in the corners changes when the pans vary from square to round square to round. After that, we select some rectangular panand make it change from rectangle to round rectangle to study changes of temperature in the corners. To calculate distribution of heat for the pan, we would use three main equations. The first one is the Fourier equation, namely heat conduction equation, the second one is the radiation transfer equation of heat source and the third one is the equation of heat dissipation through convection. In the radiation transfer equation of heat source, we take heat source as a point. We get its radiating capacity through its absolute temperature, blackening and Stefan-Boltzmann law. We combine radiating capacity with surface area of quartz heating tube to get quantity of heat emitted by heat source per second, then we can get heat flux at each point of the pan. In the equation of heat loss through convection, Heat dissipating capacity is proportional to area of heat dissipation, its proportional coefficient can be found from the related material. Through the establishment of above three main equations, we can use pdetool in matlab to draw the figure about distribution of heat for the pan.2.2.3 How to determine the shape of the pan?To make heat distribution of the pan uniform, we must make it approach round. But under the circumstances of the pan's fixed area, the closer the pan approaches round, the larger its floor space is. In other words, the closer the pan approaches round, the lower the utilization rate of the oven is.More uniform distribution of heat for the pan is, the lower temperature in the corners of the pan is. Assuming the bottom area of the oven is fixed, the number of most pans which the oven can bear is equal to the quotient of the bottom area of the oven divided by floor space per pan. So in a certain weight P, we can get the best type of pan (shape) by optimizing the relationship between temperature in the corners and the number of most pans which the oven can bear. Then we get the oven's width to length ratio of W/L by arranging the pans with the optimal size.2.3 Practical problem parameterizationu: temperature of each point in the oven;t: heating time;x: the abscissa values;y: the ordinate value;α:thermal diffusivity;ε: degree of blackness of heat resource;E: radiating capacity of heat resource;T: absolute temperature of heat resource;T max: Highest temperature of pans’ edge;ξ: the length to width ratio for a rectangular pan;R: radius for a round pan;L: length for the oven;W: width for the oven;q: heat flux;k: coefficient of the convective heat transfer;Q: heat transfer rate;P: minimum distance from pan to the heat resource;Other definitions will be given in the specific models below2.4 Assumption of all models1. We assume the heat resource as a mass point, and it has the same radiation energy in all directions.2. The absorbtivity of pan on the radiation energy is 100%.3. The rate of heat dissipation is proportional to area of heat dissipation.4. The area of heat dissipation changes in a linear fashion from the centre of the pan to its border.5. Each pan is just a two-dimensional surface and we do not care about its thickness.6. Room temperature is 25 degrees Celsius.7.The area of the pan is a certain number.III. ModelsConsider the pan center as origin, establishing a coordinate system for pan as follows:Figure 33.1 Basic ModelIn order to explain main model better, the process of building following branch models needs to be explained specially, the explanation is as follows:3.1.1 Heat radiation modelFigure 4The proportional of energy received by B accounting for energy from A is4π(x2+y2+P2) The absolute temperature of heat resource A (the heating tube made of quartz) T= 773K when it works. The degree of blackness for quartz ε=0.94.The area of quartz heating tube is 0.0088m2.Depending on Stefan-Boltzmann law[3]E=σεT4 (σ=5.67*10-8)we can get E=18827w/m2.The radiation energy per second is 0.0088E.At last, we can get the heat flux of any point of pan. =0.0088E4π(x2+y2+P2)Synthesizing the formulas above, we can get:=13.24π(x2+y2+P2)(1) 3.1.2 Heat convection model3.1.2.1 Round panheat dissipation area of round panFigure 4When the pan is round, the coordinate of any point in the pan is (x,y). When the point is in the centre of a circle, its area of heat dissipation is dxdy. When the point is in theboundaries of round, its area of heat dissipation is 12dxdy. According to equation of heatPdissipation through convection dQ=kdxdy and assumption that the area of heat dissipation changes in a linear fashion along the radius[4], we can get the pan's equation of heat dissipation:q =k[1-0.5(x2+y2)0.5/R] (2) 3.1.2.2 Rectangular panHeat dissipation area of rectangular pan(length: M width: N)Figure 5When the pan is rectangular, the coordinate of any point in the pan is (x,y). When the point is in the centre of a rectangle, its area of heat dissipation is largest, namely dxdy. Whenthe point is in the center of the rectangular edges, its area of heat dissipation is 1dxdy. When2the point is in rectangular vertices, its area of heat dissipation is minimum, namely According to equation of heat dissipation dQ=kdxdy and assumption that the area of heat dissipation changes in a linear fashion from the centre of a rectangle to the center of the rectangular edges.The area of any other point in the pan can be regarded as the result of superposing two corresponding points' area in two lines.Heat dissipating capacity of any point is:=1−y/N(3)1−x/M3.2 Pan heat distribution Model3.2.1 Heat distribution of rectangular pansAssume that the rectangle's length is M and its width is N,the material of the pan is iron.For rectangular pans, we change its length to width ratio, establishing a model to get thetemperature of the corners (namely the highest temperature of the pan).We assume the area of pan is a certain number 0.085m2,The distance from the pan above to the top of the oven P=0.23m,By checking the data, we can know that the coefficient of the convective heat transfer k is approximately 25 if the temperature contrast between pan and oven is 100~200℃.then get a several kinds rectangular pans following:In the two dimensional equation of conduction,we get the thermal diffusivity of iron is 0.000013m2/s through checking data.Heat source function equals received thermal radiation minus loss of heat caused by heat dissipation through ly equation (1) minus equation (3).In this way, we get a more complicated partial differential equation. For example, through analyzing the NO.1 pan, we can get the following partial differential equation.∂u ∂t −α(ð2u∂x2+ð2u∂y2)=13.24π(x2+y2+0.529)−1−y/0.291551−x/0.29155It is hardly to get the analytic solutions of the partial differential equation. We utilize the method of finite element partition to analyze its numerical solution, and show it in the form of figures directly.Pdetool in matlab can solve the numerical solution to differential equation in the regular form quickly and show distribution of heat by the three-dimensional image[5]. We enter partial differential equation of two-dimensional heat conduction into it, then we get the figures about distribution of heat in different pans.When we use pdetool, we take Neumann condition as boundary condition, and we suppose that the boundary is insulated, In fact, it is not insulated, and the heat dissipation will show in the heat source function.We heat the pan for 8 minutes no matter what kind of shape the pan is. By Pdetool, the heat distribution of each pan shows as follows:Figure 6(heat distribution for NO.1 pan) Figure 7(heat distribution for NO.2 pan) Figure 8(heat distribution for NO.3 pan)This pan is just a square pan, with the lowest length to width ratio. From the figure, we can know that corners have the highest temperature which is 297.7℃.The corners have the highest temperature for the pan, which is 296℃The corners have the highest temperature for the pan, which is 294.8℃The temperature ofcorners for the pan isslightly lower than thehighest temperature, andthe highest temperature is293.7 ℃.Figure 9(heat distribution for NO.4 pan)To get a more accurate relationship between the length to width ratio(ξ) and highest temperature(T max), we make several more figures of heat distribution based on the different length to width ratio. At last, we can get its highest temperature. The specific result is as follows:ξ is the argument and T max is the dependent variable. The points in the chart are scaled out in the coordinate system by mathematical software Origin. Connecting the points by smooth curve, we can get the figure following:Figure 10(the relationship between ξ and T max )From the figure we can find that, with the length to width ratio increases, the temperature of corners will sharply fall at first, and it is namely that the heat distributes evenly . When the length to width ratio increases further, the temperature of corners drops obscurely . When the ratio reaches about 2.125, the length to width ratio of rectangular pans has little effect on the heat distribution. In contrast, the ratio is too big, it is difficult for practical application.In addition, we can also find that as long as the shape of the pan is a rectangle. The highest temperature in the corners of the pan won't change a lot whether its length to width ratio changes, From the figure 10, we can find that maximum range is about 6 degrees Celsius. So in general, it is very difficult to change high temperature in the corners of the rectangular pan.3.2.2 Heat distribution of square pans to round pans 3.2.2.1 Size definition of round squareWe need some sizes to define round square, our definition isas follows:T maxThe size of round square isdecided by l and r (l stands forthe length of the straight flange;r stands for the radius of thefillet).Figure 11We assume that the area of the pan is 0.085m2. The r of round square has its range, which is 【0,0.164488】,When the r reaches the two extremums, round square becomes square and circle.3.2.2.2 ModelWhen we make this kind of pans’ heat distribution figures, we take the heat source function as (1) and (3). When the round square becomes circle, the heat source function is (1) and (2).We get a several round squares with different r and l, and take a circle as an example. The specific examples show in the table below:The pan is still made of iron. Here we also heat the pan for 8 minutes.By Pdetool, we can obtain their heat distribution figures as follows:Figure 11(heat distribution for NO.1 pan) Figure 12(heat distribution for NO.2 pan) Figure 13(heat distribution for NO.3pan)The temperature of the corners about the pan is relatively low, and the highest temperature is 264℃. On the contrary, the heat distributes quite evenly.The highest temperature of the pan is 271.1℃The highest temperature of the pan is 274℃The highest temperatureof the pan is 279.8℃Figure 14(heat distribution for NO.4pan)The highest temperatureof the pan is 283.7℃Figure 15(heat distribution for NO.5pan)To get the different relationship between l/r and T max, we take l/r as argument, and T max as dependent variable. We change l and r of round square, and make several heat distribution figures. In this way, we can get the highest temperature T max, and the results show in the table below:Here, we alsouse the mathematical drawing software origin. We use l/r and T max to express coordinates. We use smooth curve to connect points, then we can get the trend line.Figure 16(the relationship between l/r and T max )From the figures we can know that, the value of l/r is smaller, the temperature of the corners about pan is higher. It is namely that the pan is more closely to circle, and heat distribution is more evenly. With the value of l/r increases, the temperature of corners rise very quickly at first, then the amplitude is getting smaller. When the value of l/r is infinitely great, the highest temperature of the pan go to a certain number.Analyzing in a theoretical way , the shape of pan goes to square when the value of l/r is infinitely great. At the same time, the temperature of the round square’s corners approach to that of square’s. From the figures, we can know that this function has a upper boundary ,T maxwhose value is close to the corner temperature of square. Through this, we can verify the correctness of our models.3.2.3 Heat distribution of round rectangle (except round square)From the model about heat distribution of rectangular pan, we can learn that drop of temperature in the corners of rectangular pans will be very little when its length to width ratio is bigger than 2.125. So we select the rectangle with length to width ratio of 2.125. We let the pan vary from the rectangle to round rectangle. So we can study changes of temperature in the corners of the pan.3.2.3.1 Size definition of round rectangleThe specification of the roundsquare is decided by l and r. Weset its width the same as therectangular pan before, namely0.2m.(l stands for the length ofstraight long side, and r stands forthe radius of the fillet.)Figure 17We assume that the area of the pan is 0.085m2, For round rectangle pans, with r decreases constantly, the pan finally approaches the rectangular pan before .If the r increases constantly, its shape will become that of playground. The range of r is 【0,0.1】3.2.3.2 ModelWhen we draw the figure about heat distribution of this kind of pan, heat source function equals equation (1) minus equation (2).We can get some different round rectangles by changing the value of r and l. Their detailed specifications are shown in the following table:The pan is still made of iron. Here we also heat the pan for 8 minutes.By Pdetool, we can obtain their heat distribution figures as follows:The corner temperaturewhich is 291.7℃andslightly lower than thehighest temperature ofthe pan.Figure 18(heat distribution for NO.1pan)The corner temperaturewhich is 292.54℃andslightly lower than thehighest temperature ofthe pan.Figure 19(heat distribution for NO.2pan)The corner temperaturewhich is 293.5℃andslightly lower than thehighest temperature ofthe pan.Figure 20(heat distribution for NO.3pan)To get the different relationship between l/r and T max, we take l/r as argument, and T max as dependent variable. We change l and r of round square, and make several heat distribution figures. In this way, we can get the highest temperature T max, and the results show in the table below:Here, we also use the mathematical drawing software origin. We use l/r and T max to express coordinates. We use smooth curve to connect points, then we can get the trend line.Figure 21(T max)From the figures we can get that, with l/r increases, the highest temperature of pan goes down. That is to say, the bigger radius of the fillet is, the more evenly heat distributes. In addition, with l/r increases, T max rises quickly at first, then the extent is smaller. When l/r is infinitely great, the round rectangle pans become rectangle pans, and the temperature approaches to that of the rectangle pan before.Secondly, from the figure, we can learn that change of the largest temperature is very little and its largest temperature is all very high when the pan varies from rectangle to round rectangle. compared with round square pan, round rectangle pan has much worse capacity of distributing heat.3.3 Best type of pan selection ModelFrom the model of heat distribution, we can know that the extent of heat distribution for round square pan is more than the extent of other pans with other kinds of shape( except T maxcircle). It is difficult to accept it for people because the food is easily overcook, no matter what the number of pan is. Depending on that, people will choose the round square pan.In the following models, we mainly discuss the advantages and disadvantages of round square pans with different specifications.3.3.1 Local parametersFor study's convenience, we take commercial oven of bottom area 1.21m2as an example. The distance between heating tube on the top and the nearest rack is P=0.23m.The number of pans which the oven can contain is n;The fillet radius of round square is r;The floor space of pan is S;The weight of the number of pans in the oven is P;The area of pan is still 0.085m2, the material is still iron.3.3.2 The relationship between T max and rThrough the models before, we know the relationship between l/r and T max. We transform it as the function of r and T max, and shows in the form of table below:We take r as the argument, and T max is the dependent variable. Making the dots in the coordinate system by the mathematical software Origin[6].The figure is as follows:Figurebetween r and T max )To our surprise, we can find that there is nearlylinear relation between r and T max fromthe figure. We may fit the relation with a linear function, so we can get the function of r and T max .FigureThe function we are getting is: T max =-174.5r+291.5 (4)3.3.3 The relationship between n and rWe have introduced that the floor space is not the area of the pan itself in theT maxT maxIntroduction. So we can get the formula below of the area of round square pan and r:S=r2(4−π)+0.085We have already known the floor space of the oven. So we can know the maximum number of pans that the oven can hold , in which condition the shape of pan is sure. Above all, we can get the function of n and r.n= 1.21r2(4−π)+0.085(5) 3.3.3 The optimum solutionThe weight of the number of pans which the oven can hold is P, while the weight of heat distribution is (1-P). The dimensions of the two are different. The effects are also different with the unit change of r. Depending on the message above, in order to induce the weight P. we need to eliminate their dimensions[7].Through observing the figure 23, we can know that the range of T max is 27℃with the domain of r.Then we change the value of r in its domain of definition, then we can get n's approximate range: 3.05mThen we eliminate their dimension, so they are transformed into value which could be compared.They are T max/27 and n/3.5 respectively.We hope that we can get a smaller T max and a larger n. We let T max/27 multiply by -1, then add them (T max/27 and n/3.5) together, the final result is K. K has no practical significance, and we just want to know its relative value.K=-(1-P)T max/27+P n/3.5After simplification, we can obtain:K=-(1-P)(-6.463r+10.796)+0.345Pr2(4−π)+0.085(6)How to get the pan we want with the idealized shape and its corresponding width to length ratio of the oven by using this formula?We explain it by an exampleIf some one’s ideal weight P is 0.6, the function(6) of K becomes:K=-0.4(-6.463r+10.796)+0.207r2(4−π)+0.085We can get the figure of K within the domain of r, by using the matlab. The figure is presented as follow:Figure 24(the relationship between K and r)We plugged the value of r into the equation (5), then we can get n=13.76Because the number of the pan should be an integer, we round up n, namely n=13.The largest number of pans which the oven can contain is prime number, the oven has only a width to length ratio of 1/13.So at last, we get the following conclusion:When P=0.6, n=13, W/L=1/13, r=0.058m is the best solution.To make the coefficient of oven reaches the top (namely without space), we take the radius of round square into equation (5). We should notice that n must be an integer. We adopt the method of exhaustion, and the result shows in the table below:This table will be used in the following advertizing.3.3.4 Model verificationWe can see the equation (6) , when the P tends to 0, which means the largest number of pans the oven can contain make no sense, the equation becomes: K=- (-6.463r+10.796) ; the optimum solution is r=0.164488m. which means maximize even distribution of heat for the pan is most important.On the contrary, when the P tends to 1, which means the maximize even distribution of heat for the pan make no sense, the equation becomes: K =0.345r 2(4−π)+0.085; the optimum solution is r=0m. which means the largest number of pans the oven can contain is most The value of r for thecorresponding peak valuein the figure is 0.058m。
承诺书我们仔细阅读了《全国大学生数学建模竞赛章程》和《全国大学生数学建模竞赛参赛规则》(以下简称为“竞赛章程和参赛规则”,可从全国大学生数学建模竞赛网站下载)。
我们完全明白,在竞赛开始后参赛队员不能以任何方式(包括电话、电子邮件、网上咨询等)与队外的任何人(包括指导教师)研究、讨论与赛题有关的问题。
我们知道,抄袭别人的成果是违反竞赛章程和参赛规则的,如果引用别人的成果或其他公开的资料(包括网上查到的资料),必须按照规定的参考文献的表述方式在正文引用处和参考文献中明确列出。
我们郑重承诺,严格遵守竞赛章程和参赛规则,以保证竞赛的公正、公平性。
如有违反竞赛章程和参赛规则的行为,我们将受到严肃处理。
我们授权全国大学生数学建模竞赛组委会,可将我们的论文以任何形式进行公开展示(包括进行网上公示,在书籍、期刊和其他媒体进行正式或非正式发表等)。
我们参赛选择的题号是(从A/B/C/D中选择一项填写): A我们的参赛报名号为(如果赛区设置报名号的话):01034所属学校(请填写完整的全名):参赛队员(打印并签名) :1.2.3.指导教师或指导教师组负责人(打印并签名):(论文纸质版与电子版中的以上信息必须一致,只是电子版中无需签名。
以上内容请仔细核对,提交后将不再允许做任何修改。
如填写错误,论文可能被取消评奖资格。
)日期:2013 年 9 月16 日赛区评阅编号(由赛区组委会评阅前进行编号):编号专用页赛区评阅编号(由赛区组委会评阅前进行编号):赛区评阅记录(可供赛区评阅时使用):评阅人评分备注全国统一编号(由赛区组委会送交全国前编号):全国评阅编号(由全国组委会评阅前进行编号):车道被占用对城市道路通行能力的影响摘要车道被占用是研究城市交通的一个重要领域。
本题要求建立合理数学模型,成功解决某个道路被堵后交通情况变化的整个过程,为相关部门解决实际问题提供理论依据。
针对问题一,描述事故发生过程中实际交通能力的变化过程。
我们根据视频的分析得出此段路为二级公路。
按照二级路段的通行能力计算公式,在视频1中采集所需的数据,通过Excel 计算并绘制出图5-2。
实际通行能力呈周期性变化,且随着阻塞车辆的增加而降低,但达到一定程度后递减效果不再明显。
针对问题二,分析所占不同道对该横断面交通能力影响差异。
通过对附件3的分析,首先我们考虑的是不同道承担交通任务不同,进而导致需要换道的车辆数不同,换道会降低通行能力。
通过流体力学理论验证了我们的设想。
因此我们采用拟合的方式确定换道次数与实际交通能力的关系,利用Matlab 拟合结果为:23031025.776.66-+⋅⨯-=x N 仅一道和仅三道换道次数比为1.33,所以仅三道比通行比仅一道通行实际交通能力强,由图5-6也可验证此结论。
针对问题三,确定排队长度与横断面实际交通能力、事故持续时间、路段上游车流量的关系。
我们考虑到车流属于交通波,则有T y ω=,综合路口和交通带来的车流以60s 为一周期规律性变化,由此我们建立的交通波模型为:()()()()()()[]()()11211111t t k h t t t t k h k h t y B s ----+-=其中),()(N q f k h =,用0/=dt dy 便可求出极值点,得到了()()[]()()()1112114/k h t t k h k h y B s s -+-=,即车辆排队距离的表达式。
并利用视频1中的数据进行检验,检验结果相对误差为4.5%,在误差允许范围内,基本符合实际情况,可以推广使用。
针对问题四,事故发生在距离上游路口140m 处,上游车流量为1500h pcu / 来确定经过多久车辆长度达到140m 。
我们利用问题三的结论,把堵车距离作为已知量,堵车达到140m 的时间作为未知量。
综合路口状况和交通灯。
我们建立的模型为()()[]()()[]12112114/t k h t t k h k h t B s s +-+-=。
通过分析视频1,求出所需数据,得出车辆排队距离为140m 的时间为5分51秒。
本题综合了车辆变道的影响、路口状况的影响、交通灯变化规律的影响以及本段路的实况信息,建立了数学模型。
考虑较为全面,可以给交通管理部门正确引导车辆行驶、审批占道施工、设计道路渠化方案、设置路边停车位和设置非港湾式公交车站等提供理论依据。
关键词:换道行为;流体力学;Matlab 拟合;交通波一问题重述车道被占用是指因交通事故、路边停车、占道施工等因素,导致车道或道路横断面通行能力在单位时间内降低的现象。
由于城市道路具有交通流密度大、连续性强等特点,一条车道被占用,也可能降低路段所有车道的通行能力,即使时间短,也可能引起车辆排队,出现交通阻塞。
如处理不当,甚至出现区域性拥堵。
车道被占用的情况种类繁多、复杂,正确估算车道被占用对城市道路通行能力的影响程度,将为交通管理部门正确引导车辆行驶、审批占道施工、设计道路渠化方案、设置路边停车位和设置非港湾式公交车站等提供理论依据。
视频1(附件1)和视频2(附件2)中的两个交通事故处于同一路段的同一横断面,且完全占用两条车道。
请研究以下问题:(1)根据视频1(附件1),描述视频中交通事故发生至撤离期间,事故所处横断面实际通行能力的变化过程。
(2)根据问题1所得结论,结合视频2(附件2),分析说明同一横断面交通事故所占车道不同对该横断面实际通行能力影响的差异。
(3)构建数学模型,分析视频1(附件1)中交通事故所影响的路段车辆排队长度与事故横断面实际通行能力、事故持续时间、路段上游车流量间的关系。
(4)假如视频1(附件1)中的交通事故所处横断面距离上游路口变为140米,路段下游方向需求不变,路段上游车流量为1500pcu/h,事故发生时车辆初始排队长度为零,且事故持续不撤离。
请估算,从事故发生开始,经过多长时间,车辆排队长度将到达上游路口。
二基本假设模型假设(1)附件1、附近2中视频所取时间具有代表性,能反映客观事实;(2)事故发生具有偶然性,车流阻塞过程不存在人为干预;(3)只考虑四轮及以上的机动车、电瓶车的交通流量;(4)事故发生只会占用两个相邻车道;三符号说明N断面实际通行能力f各项修正系数if车道宽度修正系数wf车道硬路肩宽度修正系数hvf方向分布修正系数df路测干扰修正系数fμ临界车速mμ自由流车速jk发生事故前车流密度1k平静点车流密度1sk阻塞密度jk临界密度mt事故持续时间1t最大排对长度时间sy最大排队距离sq上游车流量l行驶车辆最小安全间距N基本通行能力最大四问题的分析本题从道路发生交通事故占用车道入手,要求建立模型解决占用后对通行能力的影响,占用不同车道对通行能力的影响,以及估算事故发生后车辆排队长度与相关参数的关系,并能准确计算车辆排队长度达到最大的时间针对问题一,描述事故发生过程中,实际交通能力的变化过程。
我们根据视频里的路面状况,首先确定公路的级别,进而确定所用的求解实际交通能力公式。
求出任意时间段的交通能力,再建立实际交通能力与时间的关系,得到实际交通能力变化过程。
针对问题二,分析所占不同道对该横断面交通能力影响差异。
通过对附件3的分析,首先我们考虑的是不同道承担交通任务不同,进而导致同一横断面不同车道发生事故对该横断面实际通行能力存在差异,因为需要换道的车辆数不同,换道会降低交通能力。
通过对实际交通能力对换道次数作图,得到仅一道和仅三道通行的差异。
针对问题三,确定排队长度与横断面实际交通能力、事故持续时间、路段上油车流量的关系。
我们考虑到车流属于交通波,应符合交通波模型,再综合路口和交通灯带来的车流规律性变化,求出了堵车距离的表达式。
针对问题四,事故发生在距离上游路口140m处,上游车流量为1500pcu/h 来确定经过多久车辆长度达到140m。
我们利用问题三的结论,把堵车距离作为已知量,堵车达到140m的时间作为未知量。
综合路口状况和交通灯,我们建立的模型为交通波模型。
通过分析附件一的视频,求出所需数据,从而得出结果。
五 模型的建立与求解5.1 问题一本题要求通过对附件一的认真观察及分析事故所处横断面实际通行能力的变化。
分析其作用是为了确定新建道路的等级,性质,主要技术指标和线形几何要求,确定现有道路系统或某一路段所存在的问题,针对问题提出改进方案和措施,为道路的改建和改善提供依据,作为交通枢纽的规划,设计及交通设施配置的依据,为制定交通组织,交通疏导,交通引导,交通量均衡,交通数量控制盒综合治理等交通系统管理方案提供依据,为制定交通管理,交通控制方案以及交通渠化,信号配时优化方案设计及选择等提供依据。
5.1.1 通行能力的计算首先,我们要知道什么是道路的实际通行能力,道路的通行能力是指在一定的时间段内和在通常的道路,交通,管制条件下,能合理的期望人和车辆通过道路某一断面或地点的最大交通数量。
通行能力一共分为三类,基本通行能力,实际通行能力和设计通行能力。
1.基本通行能力是指道路与交通处于理想情况下,每一条车道(或每一条道路) 在单位时间内能够通过的最大交通量。
作为理想的道路条件,主要是车道宽度应不小于3.65 m , 路旁的侧向余宽不小于1.75 m , 纵坡平缓并有开阔的视野、良好的平面线形和路面状况。
作为交通的理想条件, 主要是车辆组成单一的标准车型汽车, 在一条车道上以相同的速度,连续不断的行驶,各车辆之间保持与车速相适应的最小车头间隔, 且无任何方向的干扰。
在这样的情况下建立的车流计算模式所得出的最大交通量,即基本通行能力。
基本通行能力与行驶车辆之间的最小安全间距公式如下:)/(10006.3/36003600N 00h l VV l h t 辆最大===)(辆车安车安制反h l l V t V l l l l l /2546.320++Φ+=+++=安l 一般取用2m ,t 可取1s ,附着系数Φ与轮胎花纹,路面粗糙度,平整度,表面适度,行车速度等因素有关,如表5-1所示:表5-1 纵向附着系数与车速的关系表)/(h km V120 100 80 60 50 30 20 40 值Φ0.290.300.310.330.350.440.440.38对应表中的数据,对小车的安全长度进行计算,小汽车车辆长度一般采用6m 。
本题就把0l 取6m 。
2.计算可能通行能力N 是以基本通行能力为基础考虑到实际的道路和交通状况,确定其修正系数,再以此修正系数乘以前述的基本通行能力,即得实际道路、交通与一定环境条件下的可能通行能力[1]。
影响通行能力不同因素的修正系数为:1)道路条件影响通行能力的因素很多, 一般考虑影响大的因素, 其修正系数有: ①车道宽度修正系数1f ;②侧向净空的修正系数2f ;③纵坡度修正系数3f ;④视距不足修正系数5f ;⑤沿途条件修正系数6f 。