【初中英语】图表类作文写作方法课件
- 格式:docx
- 大小:312.81 KB
- 文档页数:34


1
高考英语基础写作
复习系列
2
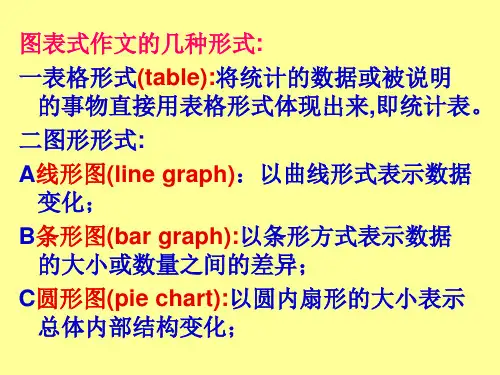
图表类说明文的类型
一是以表格形式,将
统计的数据或被
说明的事物直接
用表格形式体现
出来,即统计表
(table) o
Item 1994 1995 1996 1997 1998
Food 65% 60% 48% 42% 35%
clothing
8% 9% 12%1 15% 17%
Recreation 3% 5% 7% 8% 10%
Others 24% , 26% 33% 35% 38%
Total 100% 100% 100% 100% 100%
矩形的竖行和横行进行排列的表格
3
二是以图形形式
表示两组数的关系■通常为函数关系图
A表示数据变化的曲线图(graph
);
III