Multi-Sensor Image Registration, Fusion and Dimension Reduction
- 格式:pdf
- 大小:622.01 KB
- 文档页数:9
Multi-sensor Data Fusion in Automotive Applications Thomas Herpel1, Christoph Lauer1, Reinhard German1 and Johannes Salzberger2 1Department of Computer Science 7 – Computer Networks and Communication Systems,Friedrich-Alexander University, Erlangen, Germany2Department of Safety Electronics,Audi AG, Ingolstadt, Germany{herpel, uer, german}@informatik.uni-erlangen.de, johannes.salzberger@audi.de AbstractThe application of environment sensor systems in modern – often called “intelligent” – cars is regarded as a promising instrument for increased road traffic safety. Based on a context perception enabled by well-known technologies such as radar, laser or video, these cars are equipped with enhanced abilities in detecting threats on the road, anticipating emerging dangerous driving situations and proactively taking actions in collision avoidance. Besides the combination of sensors towards an automotive multi-sensor system, complex signal processing and sensor data fusion strategies are of remarkable importance for the availability and robustness of the overall system. In this paper, we consider data fusion approaches on near-raw sensor data (low-level) and on pre-processed measuring points (high-level). We model sensor phenomena, road traffic scenarios, data fusion paradigms and signal processing algorithms and investigate the impact of combining sensor data on different levels of abstraction on the performance of the multi-sensor system by means of discrete event simulation. Keywords: multi-sensor data fusion, simulation, intelligent cars, environment perception, automotive1 IntroductionIncreasing road traffic safety and at the same time reducing the number of fatal car accidents is one of the most challenging future tasks for both car manufacturers and research institutions worldwide. Besides intelligent roadside infrastructures, advanced traffic routing and information services considerable effort is spend on enhancing the intelligence of individual vehicles within the traffic flow. Presently, sensor technologies well-known from other application areas like military or civil aviation are employed. Radar, laser, ultrasonic or video devices perceive information about the environment and possible threats around the vehicle either actively or passively. This significantly enhances the car’s ability to anticipate dangerous driving situations and to act early and effectively in order to avoid a collision or at least mitigate the accident severity by proactive activation of adequate protection means. The quality of context perception by a set of environment sensors is of utmost importance for the so-called Advanced Driver Assistance Systems (ADAS) which rely on the sensor data. Important sensor properties that influence the quality of the environment perception include range, field-of-view (FOV), weather robustness, power consumption or placement constraints. Single sensor systems often have undesired weaknesses that suggest the use of multi-sensor systems. However, the sensor signal processing and fusion of sensor data from multiple devices is a sophisticated process including important design decisions regarding system performance and dependability. Various algorithms have been investigated for tasks of clustering measurement points, association of data with real world objects and filtering of sensor information [1]. Depending on the system's fusion paradigm the data integration takes place at a specific level of data abstraction. In a low-level data fusion near-raw data from various devices is combined at a very early stage of signal processing and the algorithms are applied to the conglomerate of measurement points. A high-level data fusion strategy pre-processes the data of the single sensors individually - i.e. each sensor is capable of dedicated clustering, association and filtering - and fuses the edited information, often represented as lists of detected objects. Both approaches are expected to have certain advantages and disadvantages in terms of entropy of information, computational complexity and adaptivity. In this paper, we use the concept of discrete event simulation for the analysis of a model consisting of various multi-sensor systems, sensor phenomena like reflection of radar or laser beams, road traffic scenarios and sensor data fusion strategies. The simulation results allow for a comparison on what data fusion paradigm, low-level or high-level, performs best in which scenario and is preferable with respect to maximum detection performance, robustness and reliability of proactive ADAS applications. The paper is organised as follows: Chapter 2 presents related work, chapter 3 introduces to the design of multi-sensor data fusion architectures and important techniques for context perception. Chapter 4 describes the implemented generic fusion system model. The simulation results are presented in chapter 5. Finally, chapter 6 concludes this paper and presents some areas of future work.2 Related WorkBoth industrial and scientific researchers spent considerable efforts on design and implementation of automotive environment sensor systems. Most work focuses on installation of sensor devices into real test cars and hot testing of various aspects, e.g. radar image acquisition [2], multi-target tracking [3], sensor-based cruise control [4], pedestrian protection [5] and devices for ADAS functions [6]. However, the benefits of modelling and simulating various aspects of sensors and sensor data processing in terms of saving costs, time and manpower are up to now exploited rarely, e.g. in [7] or in this paper.3 Architectural DesignSafety-critical ADAS comprise of devices for context perception, data procession and actuators. This section briefly describes some of the key technologies for environment perception, related techniques for signal processing and approaches for obtaining more valuable information by multi-sensor data fusion. 3.1 Sensor HardwareTechnologies for context perception have been widely used for surveillance tasks in military, aviation and other fields. Some of these technologies (e.g. radar) are now being adopted for automotive applications. Other approaches (e.g. laser-based, vision-based or satellite-supported) extend the repository of available technologies and provide different advantages and disadvantages. The devices currently under investigation can be divided into three classes: active sensors, passive sensors and data dissemination techniques.3.1.1 Active Sensor SystemsSensor devices actively probing the environment, like radar devices (long-range radar (LRR) and short-range radar (SRR) sensors) and laser-based devices (e.g. lidar, laser-scanner (LS), photonic mixer devices (PMD) or closing velocity (CV) sensors), are able to detect targets based on reflections of an emitted signal. The target’s distance can be derived directly by measuring the time-of-flight between pulse emission and pulse response. An intrinsic disadvantage of active sensors is their incapability to distinguish between targets that are relevant for the system and clutter targets that are, by definition, unimportant to the system. Clutter targets can be physically present, but nevertheless uninteresting, targets, like trash cans or rail roads, or ghost objects which are caused by signal interference. Some sensor types, like laser-scanners, produce enough measurements to allow a pattern matching approach to exclude objects with a geometry that suggests them to be clutter. Radar devices suffer particularly from clutter objects but provide the intrinsic possibility to perceive the target’s relative velocity. Laser-based sensors are not able to detect this information directly but have to derive velocity information via the target’s range rate. Moreover, laser-based devices are more vulnerable to bad weather conditions. Acoustic devices (e.g. ultra-sonic sensors), which have been widely used in automotive applications like parking aids, suffer from very short sensing ranges and negative influences of loud driving noise and therefore play a minor role in safety-critical ADAS. 3.1.2 Passive Sensor SystemsContrary to active sensors, passive sensor devices do not emit any probing signal but passively perceive the environment. Especially vision-based devices (e.g. mono, stereo, night-vision and infra-red cameras) receive a large amount of attention from researchers and engineers. Vision-based devices offer excellent means for target classification but provide inaccurate distance information and are also affected negatively by bad weather conditions.3.1.3 Data DisseminationThe third class of context perception devices utilizes the data dissemination via a wireless communication channel (e.g. Car-2-Car, Car-2-Infrastructure) or on non-volatile storage devices (digitally stored maps). It is obvious that such devices can offer a wealth of information for vehicle occupants but are of minor interest due to hard real-time communication constraints of safety-critical ADAS.3.2 Signal ProcessingThe signal processing of fusion systems incorporates the refinement of raw sensor data to an abstract context description as well as the actual fusion step. Depending on the fusion paradigm sensor data can be fused on a low level of abstraction, high level of abstraction or on multiple levels of abstraction (hybrid approach) [8]. Figure 1 illustrates the signal processing chain for low-level and high-level fusion architectures.Figure 1: Low-level and high-level sensor data fusionBefore data integration can take place a common temporal and spatial base of the sensor data needs to be established through data synchronization. Objective of the clustering step is the assembly of groups of data points that are believed to be originating from the same real world entity. The data clusters are now analysed by the feature extractor to derive relevant attributes of the clustered entities, e.g. distance, velocity, acceleration, width, height, length, weight, yaw rate and others. In order to establish a timely correlated record of the objects, the association of objects from the last time step with the currently present objects is necessary. To lessen the effect of sensor inaccuracy and signal noise a filter algorithm is executed which also provides the state predictions for the next iteration’s association step. High-level fusion architectures integrate context data based on associated and filtered sensor data whereas low-level fusion architectures integrate sensor data at an early stage of signal processing. 3.2.1Algorithms for Context PerceptionMost research concerning multi-sensor data fusion for target detection and tracking has been conducted in the fields of track association and signal filtering. However, these topics are still the most controversially discussed. The de-facto standard for automotive filtering applications is the Kalman-filtercalculates a weighted statethe state thelast iteration, based on the actual the Kalman gain matrixk K (equation 1). The Kalman gain is derived fromthe signal covariance values.Other emerging filter approaches include, for example, the particle filter.(1)The association of objects from two different time steps can be done using greedy approaches (Nearest Neighbour (NN) and variants), Joint Probabilistic Data Association (JPDA) or Multiple-Hypothesis Testing (MHT). These algorithms differ in terms of computational load and ability to find local (iterative NN) or global optimal (JPDA, MHT) solutions. Moreover, JPDA and MHT take multiple possible object updates into consideration whereas NN approaches assume that a track can only be associated with exactly one object update. 3.2.2Fusion ParadigmsAs mentioned before, different approaches of fusing data from multiple sources are possible. The level of abstraction on which the data integration takes place is what we call fusion paradigm. Three main fusion paradigms can be observed in current research proceedings:Low-level fusion of raw sensor data, near-raw sensor data or sensor data that has been processed little, high-level fusion of sensor data that was processed independently to a high level of abstraction and hybrid fusion of sensor data on multiple levels of abstraction.Some suspect that the potential benefit that can be obtained by data fusion is higher using low-level approaches [10]. From the perspective of information theory, the information content of the sensor data repository is lower on high levels of abstraction, thus reducing the synergetic opportunities for a sensor data fusion on this higher level. More obvious properties of low-level fusion architectures include higher computational load, higher communicational load, standardisation issues and reduced modularity and scalability compared to high-level architectures. Hybrid architectures promise to provide the advantages of both low-level and high-level paradigms. Note that not every sensor-set can be fused using any of the above mentioned paradigms. For example, a fusion of raw video data and low-level radar data is physically counterproductive. Lately many publications provided insight into various architectures, fusion paradigms and case studies [2-6, 8, 10]. However, analyses of the actual performance of the different systems is difficult as no common test strategy exists and different algorithms, sensor technologies and fusion paradigms have been used. Another problem emerges from the experimental research methodology itself. Although reference systems are under development it is not a trivial task to compare the outcomes of the sensor data fusion with the real world situation (ground truth). 3.2.3Fusion BenefitIn [11] the definition of sensor data fusion includes a definition of ‘greater quality’. In the automotive context there are two major benefits data from multiple sensors is fused for:Enhanced coverage : Data from sensors with (partially) disjoint fields-of-view are fused in order to achieve a larger overall coverage. This co-operative (or complementary) fusion is comparable to a ‘logical-OR’ operation on sensor data and is often necessary to enable sufficient coverage for long and short range applications.Increased confidence : Data from sensors with (partially) joint fields-of-view is used to validate object detections of the other sensor(s). This approach is also called competitive fusion, comparable to a ‘logical-AND’ operation on individual observations. Safety-critical applications require highly dependable system behaviour and therefore themselves rely on dependable subsystems. Attributes of dependable systems include availability, safety and integrity, hence, both of the above mentioned fusion benefits are required to provide dependable system behaviour.4 SimulationAlthough some studies that investigate the performance of separate subsystems (like filter-algorithms) using simulation approaches have been conducted, most of the research in automotive multi-sensor data fusion relies on experimental methods. As authentic and valuable this approach is, it lacks flexibility in investigating fusion paradigms and sensor-sets. In this paper we use discrete event simulation to evaluate the performance of fusion architectures. The simulation model was created using the multi-method simulation tool AnyLogic 5.5.41 enabling real-time UML behavioural descriptions and full Java support.4.1 Simulation ModelThe fusion system model was created in a fashion that allows a thoroughly analysis of the signal processing elements and fusion paradigms (cf. figure 1), different sensor-sets and different traffic situations. The UML- diagram in figure 2 depicts the simulation model design. The central components of the simulation include the scene generator, the signal processing and fusion classes and the evaluation class. The scene generator is responsible for spawning objects 1 /anylogic/ (relevant and clutter) into the context of the ego-vehicle and for the creation of reflection points which are generated taking into account the sensor-set’s individual sensor properties (FOV, range, lateral resolution, sensor variance) and physical measuring principle(s). The signal processing elements and the fusion elements perform environment perception based on these reflection points. Note that different implementation of the data refinement steps as well as different fusion paradigms are available for the analysis. The evaluation of both high-level and low-level fusion architectures is performed simultaneously and relies on ground truth information provided by the scene generator. The complexity and modularity of the model permits diverse simulation scenarios with different sensor-sets, traffic scenarios and fusion paradigms and provides excellent means for performance analyses of the complete fusion architecture.4.2 Simulation SettingsWe conducted several simulation experiments to evaluate the impact of the sensor data fusion paradigm on the multi-sensor system behaviour. Table 1 shows the scenario settings for urban and motorway traffic. Objects are generated uniformly according to the object spawn rate with a specific fraction of ghost or clutter objects. Note that the settings result in a denser and more clutterous scene for urban traffic scenarios.Figure 2: Basic UML-diagram of the simulation modelTable 1: Parameter selection for simulation scenario ParameterUrbanMotorwayObject spawn period uniform (σ = 0.3) uniform (σ = 0.12) Ghost fraction0.45 0.35 Max. objects in scene 5 6 Number of lanes 2 3 Lane width 3 m 3.5 m Scene horizon 50 m 80 m Ego-vehicle speed 40 km/h 110 km/h Lane speed difference10 km/h20 km/hIn table 2, the parameter settings for the sensor devices are summarised. The range denotes the upper limit of longitudinal detection ability and azimuth denotes the angle of the beam. The σ-values refer to the setting of the Gaussian probability distribution with mean zero that models the sensor variance, a higher value results in more inaccurate sensing. Table 2: Parameter selection for sensor devices SensorRangeAzimuthσxσyσvrelLRR 120 m 9°/10° 0.45 0.15 0.3 SRR 40 m 60° 0.5 0.2 0.5 Lidar 120 m 10° 0.15 0.15 -- LS 100 m 100° 0.11 0.11 -- PMD 40 m 55° 0.25 0.25 -- CV20 m45°0.15--Out of these devices, we arranged four multi-sensorsets according to table 3:Table 3: Multi-sensor sets for simulationLong-rangeShort-rangeSensor Set 1 2 x LRR 2LS Sensor Set 2 Lidar SRR Sensor Set 3 LRR PMD Sensor Set 4LRRCVIn order to increase the detection ability, each set consists of devices with different physical measuring principles. Sensor data is processed and fused according to the strategies described in section 3.2, using agglomerative clustering, generic feature extraction, JPDA and Kalman filtering. For both low-level and high-level the enhanced coverage strategy is applied.5 ResultsThe simulation outcomes are presented and discussed in the following. The results were obtained by at least ten independent replications of single simulation experiments, applying a simulation control mechanism according to [12], requiring the stop criterion in equation 2 to be met before the simulation is aborted.εε+≤1)()(k k x mean x CI(2)2The LRR devices are installed with a horizontal displacement in the left and right half of the bumper.CI(x k ) is the 95% confidence interval, i.e. the interval in which 95% of the measurements of the k-th experiment reside. Note that the individual measurements themselves are mean values of a particular variable. mean(x k ) is the mean value of the measurements of the k-th experiment and represents a normalisation of the confidence interval. The right partofequation2describesthedesiredmaximumrelative errorε, which was set to 10%.The performance measures we obtained are the meanoverallerrorin detectedobjectposition(inmetres)andthemeanfalsepositivedetectionratio.Theformeronecharacterizestheaccuracyofthesystem.Itiscomputed accordingtoformula 3as themeanvalue ofallEuclidianDistancesbetweenactualcoordinates(rx,ry)ofobjectsinthesceneandthecorrespondingpositioninginformation(ox,oy) provided by the multi-sensor system, i.e. the instances of the mapping relation ◊.)()()(|,22◊−+−=∑◊∀size r o r o Error ro r o y y x x (3)The mean false positive detection ratio resembles the robustness of the system against misinterpretation of the scene and thus propagation of irrelevant clutter objects, e.g. manhole covers, or creation of ghost objects by inappropriate signal processing.The outcomes are shown as box-whisker plots infigure 3 and 4 and numerically in tables 4 and 5, respectively. Each figure is subdivided into parts for urban traffic (columns 1-4) and motorway traffic (columns 5-8) with each column providing the results of both low-level (LL) and high-level (HL) data fusion for a specific multi-sensor system (SET 1-4). Obviously, the low-level fusion paradigm performs consistently better with regard to both accuracy of positioning and detection reliability. This corroborates the assumption that fusing the sensor data early (at a low-level of abstraction) is preferable to a high-level fusion of individually pre-processed sensor data.Figure 3: Mean overall error in object positionFigure 4: Mean false positive detection ratioTable 4: Mean overall error (in metres)Urban Traffic Motorway TrafficSet 1 2 3 4 1 2 3 4 LL 0.84 0.58 0.79 0.66 0.45 0.32 0.45 0.45 HL 0.95 0.92 0.85 0.78 0.58 0.48 0.56 0.53Table 5: Mean false positive detection ratioUrban Traffic Motorway TrafficSet 1 2 3 4 1 2 3 4 LL 0.19 0.11 0.19 0.11 0.24 0.03 0.09 0.02 HL 0.25 0.23 0.24 0.15 0.28 0.08 0.15 0.04 In most cases, the dense urban traffic leads to increased positioning errors and false detection rates compared to the motorway scenario, which is likely to happen with more objects in the scene and in turn smaller distances and diffuse boundaries in-between.6 Conclusions and Future WorkIn this paper we show that both high-level and low-level fusion paradigms can be used for reliable context perception for ADAS. Using discrete event simulation we analysed various sensor-sets, traffic scenarios and fusion paradigms. The simulation model includes implementation of state-of-the-art techniques for sensor data fusion and implicit knowledge of ground truth information through traffic scene generation to support analyses of different architecture designs. The simulation output analysis shows advantages of the low-level fusion paradigm in both overall tracking accuracy and false positive detections. More clutterous and denser traffic scenarios result in higher tracking inaccuracies for both fusion paradigms, while the false positive detection rate remains almost unaffected.The presented simulation model allows for analyses of fusion paradigms which are difficult to perform using experimental research methods. More sensor-sets, impact of specific algorithms and fusion benefits (extended coverage, increased confidence) can be evaluated using this model. An implementation of context perception algorithms for passive sensor devices would increase the extent to which fusion architectures can be investigated. Progress in ground truth reference measurements could enable experimental validation of the simulated system characteristics. Furthermore, new concepts of low-level and early sensor data fusion could be investigated and help automotive engineers in understanding the opportunities of multi-sensor data fusion and related design decisions.7 References[1] D.L. Hall and J. Llinas. Handbook of multisensordata fusion. Boca Raton, FL: CRC Press, 2001.[2]U. Meis and R. Schneider, “Radar ImageAcquisition and Interpretation for Automotive Applications”, Proc. of the IEEE Intelligent Vehicle Symposium, Columbus, Ohio, USA, 2003, pp. 328-332.[3]R. Mobus and B. Kolbe, “Multi-Target Multi-Object Tracking, Sensor Fusion of Radar and Infrared”, Proc. of IEEE Intelligent Vehicle Symposium, Parma, Italy, 2004, pp.732-737. [4]G. Widmann, M. Daniels, L. Hamilton, L.Humm, B. Riley, J. Schiffmann, D. Schnelker and W. Wishon, “Comparison of Lidar-Based and Radar-Based Adaptive Cruise Control Systems“, Proc. of SAE World Congress, Detroit, Michigan, USA, 2001, pp. 1-14.[5]M. Meinecke, M. A. Obojski, M. Töns, R.Dörfler, P. Marchal, L. Letellier, D. Gavrilla and R. Morris, “Approach for Protection of Vulnerable Road Users Using Sensor Fusion Techniques“, Proc. of International Radar Symposium, Dresden, Germany, 2003.[6]J. Langheim, A. Buchanan, U. Lages and M.Wahl, “CARSENSE – New Environment Sensing for Advanced Driver Assistance Systems“, Proc. of IEEE Intelligent Vehicle Symposium, Tokyo, Japan, 2001, pp. 89-94 [7]M. Bühren and B. Yang, “Simulation ofAutomotive Radar Target Lists Considering Clutter and Limited Resolution”, Proc. of International Radar Symposium, Cologne, Germany, 2007, pp. 195-200.[8] A. Amditis, Ed., PReVENT Fusion Forum e-Journal, vol. 2, 2008.[9] A. Gelb, Applied Optimal Estimation, MIT Press,1974.[10]T. Tatschke, “Early Fusion,” PReVENT FusionForum e-Journal, vol. 1, pp. 6–7, 2006.[11]L. Wald, “Definitions and terms of reference indata fusion,” International Archives of Photogrammetry and Remote Sensing, vol. 32, no. Part 7, pp. 651–654, 1999.[12]A.M. Law and W.D. Kelton, SimulationModeling and Analysis, McGraw-Hill Higher Education, 1997.。
脊柱侧凸是一种脊柱三维结构的畸形疾病,全球有1%~4%的青少年受到此疾病的影响[1]。
该疾病的诊断主要参考患者的脊柱侧凸角度,目前X线成像方式是诊断脊柱侧凸的首选,在X线图像中分割脊柱是后续测量、配准以及三维重建的基础。
近期出现了不少脊柱X线图像分割方法。
Anitha等人[2-3]提出了使用自定义的滤波器自动提取椎体终板以及自动获取轮廓的形态学算子的方法,但这些方法存在一定的观察者间的误差。
Sardjono等人[4]提出基于带电粒子模型的物理方法来提取脊柱轮廓,实现过程复杂且实用性不高。
叶伟等人[5]提出了一种基于模糊C均值聚类分割算法,该方法过程繁琐且实用性欠佳。
以上方法都只对椎体进行了分割,却无法实现对脊柱的整体轮廓分割。
深度学习在图像分割的领域有很多应用。
Long等人提出了全卷积网络[6](Full Convolutional Network,FCN),将卷积神经网络的最后一层全连接层替换为卷积层,得到特征图后再经过反卷积来获得像素级的分类结果。
通过对FCN结构改进,Ronneberger等人提出了一种编码-解码的网络结构U-Net[7]解决图像分割问题。
Wu等人提出了BoostNet[8]来对脊柱X线图像进行目标检测以及一个基于多视角的相关网络[9]来完成对脊柱框架的定位。
上述方法并未直接对脊柱图像进行分割,仅提取了关键点的特征并由定位的特征来获取脊柱的整体轮廓。
Fang等人[10]采用FCN对脊柱的CT切片图像进行分割并进行三维重建,但分割精度相对较低。
Horng等人[11]将脊柱X线图像进行切割后使用残差U-Net 来对单个椎骨进行分割,再合成完整的脊柱图像,从而导致分割过程过于繁琐。
Tan等人[12]和Grigorieva等人[13]采用U-Net来对脊柱X线图像进行分割并实现对Cobb角的测量或三维重建,但存在分割精度不高的问题。
以上研究方法虽然在一定程度上完成脊柱分割,但仍存在两个问题:(1)只涉及椎体的定位和计算脊柱侧凸角度,却没有对图像进行完整的脊柱分割。
第 32 卷第 2 期2024 年 1 月Vol.32 No.2Jan. 2024光学精密工程Optics and Precision Engineering宽光谱多传感器轴一致性检测系统设计邹韵1,朱运东1,2*,王劲松1,2(1.长春理工大学光电工程学院,吉林长春 130012;2.长春理工大学中山研究院,广东中山 528437)摘要:光轴一致性是衡量多传感器光电系统工作性能的重要指标,为了解决多传感器轴一致性检测系统工作波段范围较窄、系统灵活性较低的问题,本文结合光路切换和光热转换的思想,设计了一套宽光谱多传感器轴一致性检测系统。
该系统采用卡塞格林反射式光学系统作为从可见光到长波红外范围内的接收和发射系统;通过步进电机的驱动,带动导轨上方反光镜位置移动,实现系统光路的切换;采用镀有硫化铜的锗玻璃,作为光热转换靶材,将短波长的光斑转换为热斑,采用长波红外探测器实现对各波段激光光斑图像采集。
系统能够实现0.4~14 μm波段光谱范围的检测;对光学系统进行像质评价分析,可以得到系统在不同波段下由像差引起的弥散斑(Root mean square, RMS)直径均在9 μm以下,能量集中度较好;对系统检测精度进行分析,最大测量误差为0.1 mrad;通过导轨往返运动重复精度实验和系统测量准确度实验,对系统可靠性进行验证,结果表明检测系统满足仪表准确度1.5级的要求。
该检测系统结构紧凑,适用波谱范围广,能够实现对多传感器光电设备的轴一致性检测。
关键词:宽光谱;轴一致性;光路切换;光热转换;硫化铜中图分类号:TH741 文献标识码:A doi:10.37188/OPE.20243202.0148Design of wide spectrum multi-sensor axis consistencydetection systemZOU Yun1,ZHU Yundong1,2*,WANG Jinsong1,2(1.College of Optoelectronic Engineering, Changchun University of Science and Technology,Changchun 130012, China;2.Zhongshan Institute of Changchun University of Science and Technology, Zhongshan 528437, China)* Corresponding author, E-mail:865040845@Abstract: Optical axis consistency is an important indicator for measuring the performance of multi-sensor optoelectronic systems. In order to address the issue of narrow working spectral range and limited system flexibility in the multi-sensor axis consistency detection system,this paper designed a board-spectrum multi-sensor axis consistency detection system. The system based on the concepts of optical path switching and opto-thermal conversion.The system used a Cassegrain reflective optical system as the receiving and transmitting system in the range from visible light to long-wave infrared.A stepper motor was used to move the reflective mirror above the guide rail,allowing for the switching of the system's optical path. The copper sulfide-coated germanium glass was used to convert the short-wavelength spot into a hot spot 文章编号1004-924X(2024)02-0148-10收稿日期:2023-06-20;修订日期:2023-08-22.基金项目:吉林省重点科技研发项目(No. 20180201025GX)第 2 期邹韵,等:宽光谱多传感器轴一致性检测系统设计as the photothermal conversion target. The long-wave infrared detector was used to collect the laser spot images of various spectral bands. The system could detect the spectral range of 0.4 - 14 μm. The analysis of the optical system's image quality shows that the root mean square (RMS) diameter caused by aberra⁃tions is consistently below 9 μm across various wavelengths. The system also exhibits strong energy con⁃centration.Detection accuracy of the system is analyzed,and the maximum measurement error is 0.1 mrad. Experiments on repetitive precision involving the guide rail's back-and-forth movement, and accura⁃cy measurement experiments on the system, verify the reliability of the system. The results indicate that the detection system meets the requirement of instrument accuracy level 1.5. The detection system has a compact structure, a wide range of applicable spectral, and the ability to perform axis consistency testing for multi-sensor optoelectronic devices.Key words: wide spectrum;axis consistency;optical switching;photothermal conversion;copper sulfide1 引言随着光学成像技术的不断发展,光电系统的构成也逐步趋于多样化、复杂化[1-2]。

基于GHM多小波变换的非织造布多焦面图像融合陈阳;辛斌杰;邓娜【摘要】针对光学显微镜在单一焦平面下拍摄的织物图像部分区域纤维会模糊的问题,提出基于GHM多小波变换的非织造布多焦面图像融合算法.利用自行搭建的非织造布显微成像系统采集不同焦平面下的织物图像序列,对初始图像序列进行临界采样预滤波处理,使用2种融合方法逐一处理图像的高低频,初始织物融合图像经多小波融合及逆变换后获得,之后按上述方法将初始融合图像与后续单焦面图像融合,叠加循环至融合后所有纤维区域均能清晰显示为止结束收敛.实验结果表明,该融合方法能将不同焦平面下拍摄的图像序列进行数字化图像融合,达到单幅图像内全视野区域的纤维网清晰聚焦融合的效果,为之后的计算机图像处理及测量提供便利.【期刊名称】《纺织学报》【年(卷),期】2019(040)006【总页数】8页(P125-132)【关键词】临界采样预滤波;GHM多小波;多焦面融合;非织造布图像;显微成像【作者】陈阳;辛斌杰;邓娜【作者单位】上海工程技术大学电子电气工程学院,上海 201620;上海工程技术大学服装学院,上海 201620;上海工程技术大学电子电气工程学院,上海 201620【正文语种】中文【中图分类】TP311.1非织造布是由纤维随机或定向排列而成,生产以纺黏法为主。
非织造布的性能与纤维网的孔隙构造紧密相关,而纤维的厚度、宽度、取向度以及纤维网的形成方式等都与其构造有关,因此能够得到这些结构参数进而找到性能间的联系,对生产及用途都具有十分重要的指导意义。
目前主要使用间接法对非织造布孔隙结构进行解析,而其存在的问题集中在费时费力且不能考虑到孔结构的复杂性。
计算机数字图像处理技术的发展为研究非织造布结构和性能提供了有效工具。
图像质量对纤维的形态测量与结构解析至关重要。
非织造布的厚度太大使得一般光学显微镜的景深不足以将所有纤维清晰地显现在一幅图像中。
基于这种不完全聚焦图像的测量,纤维结构将是不准确的,甚至会对后续处理有一定的误导性[1]。
2021⁃01⁃10计算机应用,Journal of Computer Applications 2021,41(1):208-214ISSN 1001⁃9081CODEN JYIIDU http ://基于多级全局信息传递模型的视觉显著性检测温静*,宋建伟(山西大学计算机与信息技术学院,太原030006)(∗通信作者电子邮箱wjing@ )摘要:对神经网络中的卷积特征采用分层处理的思想能明显提升显著目标检测的性能。
然而,在集成分层特征时,如何获得丰富的全局信息以及有效融合较高层特征空间的全局信息和底层细节信息仍是一个没有解决的问题。
为此,提出了一种基于多级全局信息传递模型的显著性检测算法。
为了提取丰富的多尺度全局信息,在较高层级引入了多尺度全局特征聚合模块(MGFAM ),并且将多层级提取出的全局信息进行特征融合操作;此外,为了同时获得高层特征空间的全局信息和丰富的底层细节信息,将提取到的有判别力的高级全局语义信息以特征传递的方式和较低层次特征进行融合。
这些操作可以最大限度提取到高级全局语义信息,同时避免了这些信息在逐步传递到较低层时产生的损失。
在ECSSD 、PASCAL -S 、SOD 、HKU -IS 等4个数据集上进行实验,实验结果表明,所提算法相较于较先进的NLDF 模型,其F -measure (F )值分别提高了0.028、0.05、0.035和0.013,平均绝对误差(MAE )分别降低了0.023、0.03、0.023和0.007。
同时,所提算法在准确率、召回率、F -measure 值及MAE 等指标上也优于几种经典的图像显著性检测方法。
关键词:显著性检测;全局信息;神经网络;信息传递;多尺度池化中图分类号:TP391.413文献标志码:AVisual saliency detection based on multi -level global information propagation modelWEN Jing *,SONG Jianwei(School of Computer and Information Technology ,Shanxi University ,Taiyuan Shanxi 030600,China )Abstract:The idea of hierarchical processing of convolution features in neural networks has a significant effect onsaliency object detection.However ,when integrating hierarchical features ,it is still an open problem how to obtain rich global information ,as well as effectively integrate the global information and of the higher -level feature space and low -leveldetail information.Therefore ,a saliency detection algorithm based on a multi -level global information propagation model was proposed.In order to extract rich multi -scale global information ,a Multi -scale Global Feature Aggregation Module(MGFAM )was introduced to the higher -level ,and feature fusion operation was performed to the global information extracted from multiple levels.In addition ,in order to obtain the global information of the high -level feature space and the rich low -level detail information at the same time ,the extracted discriminative high -level global semantic information was fused with the lower -level features by means of feature propagation.These operations were able to extract the high -level global semantic information to the greatest extent ,and avoid the loss of this information when it was gradually propagated to the lower -level.Experimental results on four datasets including ECSSD ,PASCAL -S ,SOD ,HKU -IS show that compared with the advanced NLDF (Non -Local Deep Features for salient object detection )model ,the proposed algorithm has the F -measure (F )valueincreased by 0.028、0.05、0.035and 0.013respectively ,the Mean Absolute Error (MAE )decreased by 0.023、0.03、0.023and 0.007respectively ,and the proposed algorithm was superior to several classical image saliency detection methods in terms of precision ,recall ,F -measure and MAE.Key words:saliency detection;global information;neural network;information propagation;multi -scale pooling引言视觉显著性源于认知学中的视觉注意模型,旨在模拟人类视觉系统自动检测出图片中最与众不同和吸引人眼球的目标区域。
普通相机受限于焦距与传感器,采集的图像有时无法满足人们对于高分辨率与宽视角的图像的需求,为了利用普通相机获得此类特定需求的图像,图像拼接技术应运而生。
图像拼接技术是指通过对输入的、具有重叠部分的图像序列进行图像预处理、图像配准、图像融合等操作,将其拼接成一幅具有高分辨率、宽视角图像的技术。
目前该技术广泛地应用在无人驾驶[1]、虚拟现实[2]、遥感图像处理[3]、医学成像[4]、视频编辑[5]等领域。
图像拼接算法通常可分为图像配准与图像融合两个步骤。
其中,图像配准是核心,也是解决视差问题的关键。
图像配准的难点在于如何构建一个更加精准、合适的模型,以减少配准误差且不破坏图像内容的结构。
根据相机的运动状况,图像配准算法主要可分为单视点配准算法和多视点配准算法两种。
图像视差产生于多视点情况下,具有视差的图像的配准是长期以来图像配准技术中的一个挑战,也是当前的研究热点。
近年来,针对视差图像配准的研究工作多数采用基于特征的空域变换方法。
根据生成变形模型的方式不同,可主要将其分为基于多平面对齐的图像配准、基于网格变形的图像配准以及缝合线驱动的图像配准三类。
本文对三类方法近年的一些相关工作进行了分析并讨论了其优缺点。
1视差问题概述与图像配准流程1.1视差形成原因视差是指从具有一定间隔的两个点上观察同一目标时产生的方向上的差异。
在拍摄时,如果相机的位置视差图像配准技术研究综述夏丹,周睿华中师范大学教育信息技术学院,武汉430079摘要:传统图像配准技术受限于严苛的初始输入已难以满足人们的需求,近年来,视差图像的配准逐渐成为图像拼接技术中的研究热点。
基于视差形成原理介绍了视差图像配准的难点与一般流程。
主要研究了基于特征的视差图像配准技术,对近年来视差图像配准的研究成果进行了归纳梳理,并从基于多平面对齐的图像配准、基于网格变形的图像配准以及缝合线驱动的图像配准三个方面进行阐述。
通过对各种典型的视差图像配准算法的算法思想、特点以及局限性进行描述和比较,提供该领域研究现状的系统综述,并对视差图像配准技术的研究趋势进行了展望。
image registration workflow原理The core principle of the image registration workflow lies in the alignment of two or more images of the same object or scene, ensuring that corresponding features in each image occupy the same spatial coordinates. This process involves multiple steps, from preprocessing to optimization, aiming to maximize the overlap and minimize the differences between the images.图像配准工作流程的核心原理在于对同一对象或场景的两张或多张图像进行对齐,确保每张图像中对应的特征占据相同的空间坐标。
这一流程涉及多个步骤,从预处理到优化,旨在最大化图像的重叠并最小化图像之间的差异。
Initially, preprocessing steps are essential to enhance the quality of the images and prepare them for registration. This includes noise reduction, contrast enhancement, and sometimes even geometric transformations to correct for distortions or distortions caused by different acquisition conditions.首先,预处理步骤至关重要,它们可以提升图像质量,为配准工作做好准备。
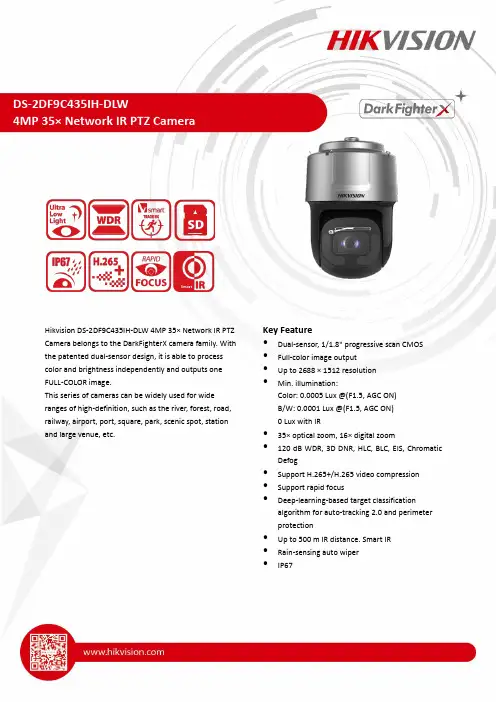
Hikvision DS-2DF9C435IH-DLW 4MP 35× Network IR PTZ Camera belongs to the DarkFighterX camera family. With the patented dual-sensor design, it is able to process color and brightness independently and outputs one FULL-COLOR image.This series of cameras can be widely used for wide ranges of high-definition, such as the river, forest, road, railway, airport, port, square, park, scenic spot, station and large venue, etc.Key Feature•Dual-sensor, 1/1.8" progressive scan CMOS •Full-color image output•Up to 2688 × 1512 resolution•Min. illumination:Color: 0.0005 Lux @(F1.5, AGC ON)B/W: 0.0001 Lux @(F1.5, AGC ON)0 Lux with IR•35× optical zoom, 16× digital zoom•120 dB WDR, 3D DNR, HLC, BLC, EIS, Chromatic Defog•Support H.265+/H.265 video compression •Support rapid focus•Deep-learning-based target classification algorithm for auto-tracking 2.0 and perimeterprotection•Up to 500 m IR distance. Smart IR•Rain-sensing auto wiper•IP67Camera ModuleImage Sensor Dual-sensor, 1/1.8" progressive scan CMOSMin. Illumination Color: 0.0005 Lux @(F1.5, AGC ON) B/W: 0.0001 Lux @(F1.5, AGC ON) 0 lux with IRWhite Balance Auto/Manual/ATW (Auto-tracking White Balance)/Indoor/Outdoor/FluorescentLamp/Sodium LampGain Auto/ManualShutter Time 50Hz: 1/1 s to 1/30,000 s60Hz: 1/1 s to 1/30,000 sDay & Night Controlled by dual-sensorDigital Zoom 16×Privacy Mask 24 programmable polygon privacy masks, mask color or mosaic configurable Focus Mode Auto/Semi-automatic/ManualWDR 120 dBRapid Focus YesLensFocal Length 5.9 mm to 206.5 mm, 35× OpticalZoom Speed Approx. 4.4 s (optical lens, wide-tele)Field of View Horizontal field of view: 58.9° to 2.2° (wide-tele) Vertical field of view: 35.3° to 1.2° (wide-tele) Diagonal field of view: 65.9° to 2.5°(wide-tele)Working Distance 10 mm to 1500 mm (wide-tele)Aperture Range F1.6 to F4.4IRIR Distance Up to 500 mSmart IR YesPTZMovement Range (Pan) 360° endlessPan Speed Configurable, from 0.1°/s to 210°/s,Preset Speed: 280°/sMovement Range (Tilt) From -25° to 90°Tilt Speed Configurable, from 0.1°/s to 150°/sPreset Speed: 250°/sProportional Zoom YesPresets 300Patrol Scan 8 patrols, up to 32 presets for each patrolPattern Scan 4 pattern scans, record time over 10 minutes for each scanPower-off Memory YesPark Action Preset/Pattern Scan/Patrol Scan/Auto Scan/Tilt Scan/Random Scan/FrameScan/Panorama Scan3D Positioning YesPTZ Status Display On/offPreset Freezing YesScheduled Task Preset/Pattern Scan/Patrol Scan/Auto Scan/Tilt Scan/Random Scan/FrameScan/Panorama Scan/Dome Reboot/Dome Adjust/Aux Output Compression StandardVideo Compression Main Stream: H.265+/H.265/H.264+/H.264 Sub-Stream: H.265/H.264/MJPEGThird Stream: H.265/H.264/MJPEGH.264 Type Baseline Profile/Main Profile/High Profile H.264+ YesH.265 Type Main Profile H.265+YesVideo Bitrate32 Kbps to 16384 KbpsAudio Compression G.711alaw/G.711ulaw/G.722.1/G.726/MP2L2/PCMAudio Bitrate 64 Kbps (G.711)/16 Kbps (G.722.1)/16 Kbps (G.726)/32 Kbps to 192 Kbps(MP2L2) SVCYesSmart Feature Perimeter ProtectionIntrusion, Line Crossing, Region Entrance, Region ExitingSupport alarm triggering by specified target types (human and vehicle)Filtering out mistaken alarm caused by target types such as leaf, light, animal, and flag, etc.Event Detection Unattended Baggage Detection, Object Removal Detection, Face Detection, Audio Exception DetectionMotion Detection, Video Tempering Alarm, Exception (HDD Full, HDD Error, Illegal Login, IP Address Conflict, Network Disconnected)Smart Tracking Manual Tracking, Auto Tracking (support tracking specified target types such as human and vehicle), Event TrackingSmart Record ANR (Automatic Network Replenishment), Dual-VCAROI Main stream, sub-stream and third stream respectively support eight fixed areas. ImageMax. Resolution 2688 × 1512Main Stream 50Hz: 25fps (2688 × 1512, 2560 × 1440, 2048 × 1536,1920 × 1080, 1280 × 960, 1280 × 720)60Hz: 30fps (2688 × 1512, 2560 × 1440, 2048 × 1536,1920 × 1080, 1280 × 960, 1280 × 720)Sub-Stream 50Hz: 25fps (704 × 576, 640 × 480, 352 × 288) 60Hz: 30fps (704 × 480, 640 × 480, 352 × 240)Third Stream 50Hz: 25fps (1920 × 1080, 1280 × 960, 1280 × 720, 704 × 576, 640 × 480, 352 × 288) 60Hz: 30fps (1920 × 1080, 1280 × 960, 1280 × 720, 704 × 480, 640 × 480, 352 × 240) Image Enhancement HLC/BLC/3D DNR/Chromatic Defog/EIS/Regional Exposure/Regional FocusNetwork Network Storage Built-in memory card slot, support Micro SD/SDHC/SDXC, up to 256 GB; NAS (NFS, SMB/ CIFS), ANRAlarm Linkage Alarm actions, such as Preset, Patrol Scan, Pattern Scan, Memory Card Video Record, Trigger Recording, Alarm Output, Notify Surveillance Center, Upload to FTP/Memory Card/NAS, Send Email, etc.ProtocolsIPv4/IPv6, HTTP, HTTPS, 802.1x, Qos, FTP, SMTP, UPnP, SNMP, DNS, DDNS, NTP, RTSP, RTCP, RTP, TCP/IP, UDP, IGMP, ICMP, DHCP, PPPoE, Bonjour APIONVIF (Profile S, Profile G, Profile T), ISAPI, SDK Simultaneous Live View Up to 20 channels User/Host Up to 32 users.3 levels: Administrator, Operator and UserSecurity Measures User authentication (ID and PW), Host authentication (MAC address); HTTPS encryption; IEEE 802.1x port-based network access control; IP address filtering ClientiVMS-4200, iVMS-4500, iVMS-5200, Hik-Connect, Hik-CentralWeb Browser IE 8 to 11, Chrome 31.0+, Firefox 30.0+, Edge 16.16299+, Safari 11+ Interface Alarm 7-ch alarm input/2-ch alarm outputAudio1-ch Audio Input, 2.0 to 2.4Vp-p, 1k Ohm±10% 1-ch Audio output Line level, impedance: 600ΩNetwork Interface 1 RJ45 self-adaptive 10 M/100 M Ethernet Interface RS-485 HIKVISION, Pelco-P, Pelco-D, self-adaptiveBNC 1.0V [p-p]/75 Ω, NTSC (or PAL) composite, BNCGeneralLanguage (Web Browser Access ) 32 languages.English, Russian, Estonian, Bulgarian, Hungarian, Greek, German, Italian, Czech, Slovak, French, Polish, Dutch, Portuguese, Spanish, Romanian, Danish, Swedish, Norwegian, Finnish, Croatian, Slovenian, Serbian, Turkish, Korean, Traditional Chinese, Thai, Vietnamese, Japanese, Latvian, Lithuanian, Portuguese (Brazil) Power36 V, 4.17 A, DC (max. 105 W, including max. 18 W for IR) Working Environment Temperature: Outdoor: -40°C to 70°C (-40°F to 158°F) Humidity: ≤ 95%Protection Level IP67 Standard. Lightning protection, surge protection and voltage transient protection meets IEC61000-4-2-2/3/4/5/6 Wiper Yes. Rain-sensing auto control Material ADC12Dimensions Φ 293 mm × 422 mm (Φ 11.5" × 16.6") WeightApprox. 13 kg (28.7 lb.)DORIThe DORI (detect, observe, recognize, identify) distance gives the general idea of the camera ability to distinguish persons or objects within its field of view.DORI Detect Observe Recognize Identify Definition 25 px/m63 px/m125 px/m 250 px/m Distance (Tele)2606.9 m (8552.8 ft)1034.5 m (3394.0 ft)521.4 m (1710.6 ft)260.7 m (854.3 ft)Order ModelDS-2DF9C435IH-DLW, 36 VDCDimension422 m m [16.6"]AccessoryIncluded:EUV-150S036ST-KW02Power adapterInstallation Adapter Optional:DS-1603ZJ-P Wall mountDS-1603ZJ-Pole-PVertical pole mountDS-1668ZJ(20)-PPendant mountDS-1668ZJ-PPendant mountDS-1619ZJ-HP2 Gooseneck mount DS-1603ZJ-Corner-P Corner mount05060020200923。
Deformable Medical Image Registration:A Survey Aristeidis Sotiras*,Member,IEEE,Christos Davatzikos,Senior Member,IEEE,and Nikos Paragios,Fellow,IEEE(Invited Paper)Abstract—Deformable image registration is a fundamental task in medical image processing.Among its most important applica-tions,one may cite:1)multi-modality fusion,where information acquired by different imaging devices or protocols is fused to fa-cilitate diagnosis and treatment planning;2)longitudinal studies, where temporal structural or anatomical changes are investigated; and3)population modeling and statistical atlases used to study normal anatomical variability.In this paper,we attempt to give an overview of deformable registration methods,putting emphasis on the most recent advances in the domain.Additional emphasis has been given to techniques applied to medical images.In order to study image registration methods in depth,their main compo-nents are identified and studied independently.The most recent techniques are presented in a systematic fashion.The contribution of this paper is to provide an extensive account of registration tech-niques in a systematic manner.Index Terms—Bibliographical review,deformable registration, medical image analysis.I.I NTRODUCTIOND EFORMABLE registration[1]–[10]has been,alongwith organ segmentation,one of the main challenges in modern medical image analysis.The process consists of establishing spatial correspondences between different image acquisitions.The term deformable(as opposed to linear or global)is used to denote the fact that the observed signals are associated through a nonlinear dense transformation,or a spatially varying deformation model.In general,registration can be performed on two or more im-ages.In this paper,we focus on registration methods that involve two images.One is usually referred to as the source or moving image,while the other is referred to as the target orfixed image. In this paper,the source image is denoted by,while the targetManuscript received March02,2013;revised May17,2013;accepted May 21,2013.Date of publication May31,2013;date of current version June26, 2013.Asterisk indicates corresponding author.*A.Sotiras is with the Section of Biomedical Image Analysis,Center for Biomedical Image Computing and Analytics,Department of Radi-ology,University of Pennsylvania,Philadelphia,PA19104USA(e-mail: aristieidis.sotiras@).C.Davatzikos is with the Section of Biomedical Image Analysis,Center for Biomedical Image Computing and Analytics,Department of Radi-ology,University of Pennsylvania,Philadelphia,PA19104USA(e-mail: christos.davatzikos@).N.Paragios is with the Center for Visual Computing,Department of Applied Mathematics,Ecole Centrale de Paris,92295Chatenay-Malabry,France,and with the Equipe Galen,INRIA Saclay-Ile-de-France,91893Orsay,France,and also with the Universite Paris-Est,LIGM(UMR CNRS),Center for Visual Com-puting,Ecole des Ponts ParisTech,77455Champs-sur-Marne,France. Digital Object Identifier10.1109/TMI.2013.2265603image is denoted by.The two images are defined in the image domain and are related by a transformation.The goal of registration is to estimate the optimal transforma-tion that optimizes an energy of the form(1) The previous objective function(1)comprises two terms.The first term,,quantifies the level of alignment between a target image and a source image.Throughout this paper,we in-terchangeably refer to this term as matching criterion,(dis)sim-ilarity criterion or distance measure.The optimization problem consists of either maximizing or minimizing the objective func-tion depending on how the matching term is chosen.The images get aligned under the influence of transformation .The transformation is a mapping function of the domain to itself,that maps point locations to other locations.In gen-eral,the transformation is assumed to map homologous loca-tions from the target physiology to the source physiology.The transformation at every position is given as the addition of an identity transformation with the displacementfield,or.The second term,,regularizes the trans-formation aiming to favor any specific properties in the solution that the user requires,and seeks to tackle the difficulty associ-ated with the ill-posedness of the problem.Regularization and deformation models are closely related. Two main aspects of this relation may be distinguished.First, in the case that the transformation is parametrized by a small number of variables and is inherently smooth,regularization may serve to introduce prior knowledge regarding the solution that we seek by imposing task-specific constraints on the trans-formation.Second,in the case that we seek the displacement of every image element(i.e.,nonparametric deformation model), regularization dictates the nature of the transformation. Thus,an image registration algorithm involves three main components:1)a deformation model,2)an objective function, and3)an optimization method.The result of the registration algorithm naturally depends on the deformation model and the objective function.The dependency of the registration result on the optimization strategy follows from the fact that image regis-tration is inherently ill-posed.Devising each component so that the requirements of the registration algorithm are met is a de-manding process.Depending on the deformation model and the input data,the problem may be ill-posed according to Hadamard’s definition of well-posed problems[11].In probably all realistic scenarios, registration is ill-posed.To further elaborate,let us consider some specific cases.In a deformable registration scenario,one0278-0062/$31.00©2013IEEEseeks to estimate a vector for every position given,in general, scalar information conveyed by image intensity.In this case,the number of unknowns is greater than the number of constraints. In a rigid setting,let us consider a consider a scenario where two images of a disk(white background,gray foreground)are registered.Despite the fact that the number of parameters is only 6,the problem is ill-posed.The problem has no unique solution since a translation that aligns the centers of the disks followed by any rotation results in a meaningful solution.Given nonlinear and nonconvex objective functions,in gen-eral,no closed-form solutions exist to estimate the registration parameters.In this setting,the search methods reach only a local minimum in the parameter space.Moreover,the problem itself has an enormous number of different facets.The approach that one should take depends on the anatomical properties of the organ(for example,the heart and liver do not adhere to the same degree of deformation),the nature of observations to be regis-tered(same modality versus multi-modal fusion),the clinical setting in which registration is to be used(e.g.,offline interpre-tation versus computer assisted surgery).An enormous amount of research has been dedicated to de-formable registration towards tackling these challenges due to its potential clinical impact.During the past few decades,many innovative ideas regarding the three main algorithmic registra-tion aspects have been proposed.General reviews of thefield may be found in[1]–[7],[9].However due to the rapid progress of thefield such reviews are to a certain extent outdated.The aim of this paper is to provide a thorough overview of the advances of the past decade in deformable registration.Never-theless,some classic papers that have greatly advanced the ideas in thefield are mentioned.Even though our primary interest is deformable registration,for the completeness of the presenta-tion,references to linear methods are included as many prob-lems have been treated in this low-degree-of-freedom setting before being extended to the deformable case.The main scope of this paper is focused on applications that seek to establish spatial correspondences between medical im-ages.Nonetheless,we have extended the scope to cover appli-cations where the interest is to recover the apparent motion of objects between sequences of successive images(opticalflow estimation)[12],[13].Deformable registration and opticalflow estimation are closely related problems.Both problems aim to establish correspondences between images.In the deformable registration case,spatial correspondences are sought,while in the opticalflow case,spatial correspondences,that are associ-ated with different time points,are looked for.Given data with a good temporal resolution,one may assume that the magnitude of the motion is limited and that image intensity is preserved in time,opticalflow estimation can be regarded as a small defor-mation mono-modal deformable registration problem.The remainder of the paper is organized by loosely following the structural separation of registration algorithms to three com-ponents:1)deformation model,2)matching criteria,and3)op-timization method.In Section II,different approaches regarding the deformation model are presented.Moreover,we also chose to cover in this section the second term of the objective function, the regularization term.This choice was motivated by the close relation between the two parts.In Section III,thefirst term of the objective function,the matching term,is discussed.The opti-mization methods are presented in Section IV.In every section, particular emphasis was put on further deepening the taxonomy of registration method by grouping the presented methods in a systematic manner.Section V concludes the paper.II.D EFORMATION M ODELSThe choice of deformation model is of great importance for the registration process as it entails an important compromise between computational efficiency and richness of description. It also reflects the class of transformations that are desirable or acceptable,and therefore limits the solution to a large ex-tent.The parameters that registration estimates through the op-timization strategy correspond to the degrees of freedom of the deformation model1.Their number varies greatly,from six in the case of global rigid transformations,to millions when non-parametric dense transformations are considered.Increasing the dimensionality of the state space results in enriching the de-scriptive power of the model.This model enrichment may be accompanied by an increase in the model’s complexity which, in turns,results in a more challenging and computationally de-manding inference.Furthermore,the choice of the deformation model implies an assumption regarding the nature of the defor-mation to be recovered.Before continuing,let us clarify an important,from imple-mentation point of view,aspect related to the transformation mapping and the deformation of the source image.In the in-troduction,we stated that the transformation is assumed to map homologous locations from the target physiology to the source physiology(backward mapping).While from a theoretical point of view,the mapping from the source physiology to the target physiology is possible(forward mapping),from an implemen-tation point of view,this mapping is less advantageous.In order to better understand the previous statement,let us consider how the direction of the mapping influences the esti-mation of the deformed image.In both cases,the source image is warped to the target domain through interpolation resulting to a deformed image.When the forward mapping is estimated, every voxel of the source image is pushed forward to its esti-mated position in the deformed image.On the other hand,when the backward mapping is estimated,the pixel value of a voxel in the deformed image is pulled from the source image.The difference between the two schemes is in the difficulty of the interpolation problem that has to be solved.In thefirst case,a scattered data interpolation problem needs to be solved because the voxel locations of the source image are usually mapped to nonvoxel locations,and the intensity values of the voxels of the deformed image have to be calculated.In the second case,when voxel locations of the deformed image are mapped to nonvoxel locations in the source image,their intensities can be easily cal-culated by interpolating the intensity values of the neighboring voxels.The rest of the section is organized by following coarsely and extending the classification of deformation models given 1Variational approaches in general attempt to determine a function,not just a set of parameters.SOTIRAS et al.:DEFORMABLE MEDICAL IMAGE REGISTRATION:A SURVEY1155Fig.1.Classi fication of deformation models.Models that satisfy task-speci fic constraints are not shown as a branch of the tree because they are,in general,used in conjunction with physics-based and interpolation-based models.by Holden [14].More emphasis is put on aspects that were not covered by that review.Geometric transformations can be classi fied into three main categories (see Fig.1):1)those that are inspired by physical models,2)those inspired by interpolation and ap-proximation theory,3)knowledge-based deformation models that opt to introduce speci fic prior information regarding the sought deformation,and 4)models that satisfy a task-speci fic constraint.Of great importance for biomedical applications are the con-straints that may be applied to the transformation such that it exhibits special properties.Such properties include,but are not limited to,inverse consistency,symmetry,topology preserva-tion,diffeomorphism.The value of these properties was made apparent to the research community and were gradually intro-duced as extra constraints.Despite common intuition,the majority of the existing regis-tration algorithms are asymmetric.As a consequence,when in-terchanging the order of input images,the registration algorithm does not estimate the inverse transformation.As a consequence,the statistical analysis that follows registration is biased on the choice of the target domain.Inverse Consistency:Inverse consistent methods aim to tackle this shortcoming by simultaneously estimating both the forward and the backward transformation.The data matching term quanti fies how well the images are aligned when one image is deformed by the forward transformation,and the other image by the backward transformation.Additionally,inverse consistent algorithms constrain the forward and backward transformations to be inverse mappings of one another.This is achieved by introducing terms that penalize the difference between the forward and backward transformations from the respective inverse mappings.Inverse consistent methods can preserve topology but are only asymptotically symmetric.Inverse-consistency can be violated if another term of the objective function is weighted more importantly.Symmetry:Symmetric algorithms also aim to cope with asymmetry.These methods do not explicitly penalize asym-metry,but instead employ one of the following two strategies.In the first case,they employ objective functions that are by construction symmetric to estimate the transformation from one image to another.In the second case,two transformation functions are estimated by optimizing a standard objective function.Each transformation function map an image to a common domain.The final mapping from one image to another is calculated by inverting one transformation function and composing it with the other.Topology Preservation:The transformation that is estimated by registration algorithms is not always one-to-one and cross-ings may appear in the deformation field.Topology preserving/homeomorphic algorithms produce a mapping that is contin-uous,onto,and locally one-to-one and has a continuous inverse.The Jacobian determinant contains information regarding the injectivity of the mapping and is greater than zero for topology preserving mappings.The differentiability of the transformation needs to be ensured in order to calculate the Jacobian determi-nant.Let us note that Jacobian determinant and Jacobian are in-terchangeably used in this paper and should not be confounded with the Jacobian matrix.Diffeomorphism:Diffeomoprhic transformations also pre-serve topology.A transformation function is a diffeomorphism,if it is invertible and both the function and its inverse are differ-entiable.A diffeomorphism maps a differentiable manifold to another.1156IEEE TRANSACTIONS ON MEDICAL IMAGING,VOL.32,NO.7,JULY2013In the following four subsections,the most important methods of the four classes are presented with emphasis on the approaches that endow the model under consideration with the above desirable properties.A.Geometric Transformations Derived From Physical Models Following[5],currently employed physical models can be further separated infive categories(see Fig.1):1)elastic body models,2)viscousfluidflow models,3)diffusion models,4) curvature registration,and5)flows of diffeomorphisms.1)Elastic Body Models:a)Linear Models:In this case,the image under deforma-tion is modeled as an elastic body.The Navier-Cauchy Partial Differential Equation(PDE)describes the deformation,or(2) where is the forcefield that drives the registration based on an image matching criterion,refers to the rigidity that quanti-fies the stiffness of the material and is Lamésfirst coefficient. Broit[15]first proposed to model an image grid as an elastic membrane that is deformed under the influence of two forces that compete until equilibrium is reached.An external force tries to deform the image such that matching is achieved while an internal one enforces the elastic properties of the material. Bajcsy and Kovacic[16]extended this approach in a hierar-chical fashion where the solution of the coarsest scale is up-sam-pled and used to initialize thefiner one.Linear registration was used at the lowest resolution.Gee and Bajscy[17]formulated the elastostatic problem in a variational setting.The problem was solved under the Bayesian paradigm allowing for the computation of the uncertainty of the solution as well as for confidence intervals.Thefinite element method(FEM)was used to infer the displacements for the ele-ment nodes,while an interpolation strategy was employed to es-timate displacements elsewhere.The order of the interpolating or shape functions,determines the smoothness of the obtained result.Linear elastic models have also been used when registering brain images based on sparse correspondences.Davatzikos[18]first used geometric characteristics to establish a mapping be-tween the cortical surfaces.Then,a global transformation was estimated by modeling the images as inhomogeneous elastic ob-jects.Spatially-varying elasticity parameters were used to com-pensate for the fact that certain structures tend to deform more than others.In addition,a nonzero initial strain was considered so that some structures expand or contract naturally.In general,an important drawback of registration is that when source and target volumes are interchanged,the obtained trans-formation is not the inverse of the previous solution.In order to tackle this shortcoming,Christensen and Johnson[19]pro-posed to simultaneously estimate both forward and backward transformations,while penalizing inconsistent transformations by adding a constraint to the objective function.Linear elasticity was used as regularization constraint and Fourier series were used to parametrize the transformation.Leow et al.[20]took a different approach to tackle the incon-sistency problem.Instead of adding a constraint that penalizes the inconsistency error,they proposed a unidirectional approach that couples the forward and backward transformation and pro-vides inverse consistent transformations by construction.The coupling was performed by modeling the backward transforma-tion as the inverse of the forward.This fact was also exploited during the optimization of the symmetric energy by only fol-lowing the gradient direction of the forward mapping.He and Christensen[21]proposed to tackle large deforma-tions in an inverse consistent framework by considering a se-quence of small deformation transformations,each modeled by a linear elastic model.The problem was symmetrized by consid-ering a periodic sequence of images where thefirst(or last)and middle image are the source and target respectively.The sym-metric objective function thus comprised terms that quantify the difference between any two successive pairs of images.The in-ferred incremental transformation maps were concatenated to map one input image to another.b)Nonlinear Models:An important limitation of linear elastic models lies in their inability to cope with large defor-mations.In order to account for large deformations,nonlinear elastic models have been proposed.These models also guar-antee the preservation of topology.Rabbitt et al.[22]modeled the deformable image based on hyperelastic material properties.The solution of the nonlinear equations was achieved by local linearization and the use of the Finite Element method.Pennec et al.[23]dropped the linearity assumption by mod-eling the deformation process through the St Venant-Kirchoff elasticity energy that extends the linear elastic model to the non-linear regime.Moreover,the use of log-Euclidean metrics in-stead of Euclidean ones resulted in a Riemannian elasticity en-ergy which is inverse consistent.Yanovsky et al.[24]proposed a symmetric registration framework based on the St Venant-Kir-choff elasticity.An auxiliary variable was added to decouple the regularization and the matching term.Symmetry was im-posed by assuming that the Jacobian determinants of the defor-mation follow a zero mean,after log-transformation,log-normal distribution[25].Droske and Rumpf[26]used an hyperelastic,polyconvex regularization term that takes into account the length,area and volume deformations.Le Guyader and Vese[27]presented an approach that combines segmentation and registration that is based on nonlinear elasticity.The authors used a polyconvex regularization energy based on the modeling of the images under deformation as Ciarlet-Geymonat materials[28].Burger et al.[29]also used a polyconvex regularization term.The au-thors focused on the numerical implementation of the registra-tion framework.They employed a discretize-then-optimize ap-proach[9]that involved the partitioning voxels to24tetrahedra.2)Viscous Fluid Flow Models:In this case,the image under deformation is modeled as a viscousfluid.The transformation is governed by the Navier-Stokes equation that is simplified by assuming a very low Reynold’s numberflow(3) These models do not assume small deformations,and thus are able to recover large deformations[30].Thefirst term of theSOTIRAS et al.:DEFORMABLE MEDICAL IMAGE REGISTRATION:A SURVEY1157Navier-Stokes equation(3),constrains neighboring points to de-form similarly by spatially smoothing the velocityfield.The velocityfield is related to the displacementfield as.The velocityfield is integrated in order to estimate the displacementfield.The second term al-lows structures to change in mass while and are the vis-cosity coefficients.Christensen et al.[30]modeled the image under deformation as a viscousfluid allowing for large magnitude nonlinear defor-mations.The PDE was solved for small time intervals and the complete solution was given by an integration over time.For each time interval a successive over-relaxation(SOR)scheme was used.To guarantee the preservation of topology,the Jaco-bian was monitored and each time its value fell under0.5,the deformed image was regridded and a new one was generated to estimate a transformation.Thefinal solution was the con-catenation of all successive transformations occurring for each regridding step.In a subsequent work,Christensen et al.[31] presented a hierarchical way to recover the transformations for brain anatomy.Initially,global affine transformation was per-formed followed by a landmark transformation model.The re-sult was refined byfluid transformation preceded by an elastic registration step.An important drawback of the earliest implementations of the viscousfluid models,that employed SOR to solve the equa-tions,was computational inefficiency.To circumvent this short-coming,Christensen et al.employed a massive parallel com-puter implementation in[30].Bro-Nielsen and Gramkow[32] proposed a technique based on a convolutionfilter in scale-space.Thefilter was designed as the impulse response of the linear operator defined in its eigen-function basis.Crun et al.[33]proposed a multi-grid approach towards handling anisotropic data along with a multi-resolution scheme opting forfirst recovering coarse velocity es-timations and refining them in a subsequent step.Cahill et al.[34]showed how to use Fourier methods to efficiently solve the linear PDE system that arises from(3)for any boundary condi-tion.Furthermore,Cahill et al.extended their analysis to show how these methods can be applied in the case of other regu-larizers(diffusion,curvature and elastic)under Dirichlet,Neu-mann,or periodic boundary conditions.Wang and Staib[35]usedfluid deformation models in an atlas-enhanced registration setting while D’Agostino et al. tackled multi-modal registration with the use of such models in[36].More recently,Chiang et al.[37]proposed an inverse consistent variant offluid registration to register Diffusion Tensor images.Symmetrized Kullback-Leibler(KL)diver-gence was used as the matching criterion.Inverse consistency was achieved by evaluating the matching and regularization criteria towards both directions.3)Diffusion Models:In this case,the deformation is mod-eled by the diffusion equation(4) Let us note that most of the algorithms,based on this transforma-tion model and described in this section,do not explicitly state the(4)in their objective function.Nonetheless,they exploit the fact that the Gaussian kernel is the Green’s function of the diffu-sion equation(4)(under appropriate initial and boundary condi-tions)to provide an efficient regularization step.Regularization is efficiently performed through convolutions with a Gaussian kernel.Thirion,inspired by Maxwell’s Demons,proposed to perform image matching as a diffusion process[38].The proposed algo-rithm iterated between two steps:1)estimation of the demon forces for every demon(more precisely,the result of the appli-cation of a force during one iteration step,that is a displace-ment),and2)update of the transformation based on the cal-culated forces.Depending on the way the demon positions are selected,the way the space of deformations is defined,the in-terpolation method that is used,and the way the demon forces are calculated,different variants can be obtained.The most suit-able version for medical image analysis involved1)selecting all image elements as demons,2)calculating demon forces by considering the opticalflow constraint,3)assuming a nonpara-metric deformation model that was regularized by applying a Gaussianfilter after each iteration,and4)a trilinear interpo-lation scheme.The Gaussianfilter can be applied either to the displacementfield estimated at an iteration or the updated total displacementfield.The bijectivity of the transformation was en-sured by calculating for every point the difference between its initial position and the one that is reached after composing the forward with the backward deformationfield,and redistributing the difference to eachfield.The bijectivity of the transformation can also be enforced by limiting the maximum length of the up-date displacement to half the voxel size and using composition to update the transformation.Variants for the contour-based reg-istration and the registration between segmented images were also described in[38].Most of the algorithms described in this section were inspired by the work of Thirion[38]and thus could alternatively be clas-sified as“Demons approaches.”These methods share the iter-ative approach that was presented in[38]that is,iterating be-tween estimating the displacements and regularizing to obtain the transformation.This iterative approach results in increased computational efficiency.As it will be discussed later in this section,this feature led researchers to explore such strategies for different PDEs.The use of Demons,as initially introduced,was an efficient algorithm able to provide dense correspondences but lacked a sound theoretical justification.Due to the success of the algo-rithm,a number of papers tried to give theoretical insight into its workings.Fischer and Modersitzki[39]provided a fast algo-rithm for image registration.The result was given as the solution of linear system that results from the linearization of the diffu-sion PDE.An efficient scheme for its solution was proposed while a connection to the Thirion’s Demons algorithm[38]was drawn.Pennec et al.[40]studied image registration as an energy minimization problem and drew the connection of the Demons algorithm with gradient descent schemes.Thirion’s image force based on opticalflow was shown to be equivalent with a second order gradient descent on the Sum of Square Differences(SSD) matching criterion.As for the regularization,it was shown that the convolution of the global transformation with a Gaussian。
专利名称:SENSOR EMULATION 申请号:US2021/049207申请日:20210907公开号:WO2022/066400A1公开日:20220331专利内容由知识产权出版社提供专利附图:摘要:Various implementations disclosed herein include devices, systems, and methods that are capable of executing an application on a head-mounted device (HMD) having a first image sensor in a first image sensor configuration. In some implementations, the application is configured for execution on a device including a second image sensor in a second image sensor configuration different than the firstimage sensor configuration. In some implementations, a request is received from the executing application for image data from the second image sensor. Responsive to the request at the HMD, a pose of a virtual image sensor is determined, image data is generated based on the pose of the virtual image sensor, and the generated image data is provided to the executing application.申请人:STERLING LABS LLC地址:1600 Broadway, Suite 1600 Denver, CO 80202国籍:US代理人:JOSWICK, Eugene, B. et al.更多信息请下载全文后查看。
Image Sensor Edition Quick Start GuideVersion 7©2009, Imatest, LLCImage Sensor Edition Quick Start Guide Instructions for Installation and StartupTable of Contents Introduction (2)Setup (2)Download Software (2)Install Software (2)Purchase Image Sensor Edition (3)Software Startup Procedure (4)Using Image Sensor Edition with Aptina DevWare (4)Using Image Sensor Edition with Omnivision OVTATool2009 (5)Using Image Sensor Edition with Toshiba ImaTuning (6)Support (7)Contact (7)Matlab Component Runtime (7)Known Issues (7)Appendix A: Requirements (9)Hardware Requirements (9)Software Requirements (9)Page 1IntroductionImatest is the digital imaging industry’s leading software package for measuring key imagequality factors such as sharpness, color quality, noise, lens distortion, and much more.Along with all the features of Imatest Master, the Image Sensor Edition also offers the ability to load images directly from image sensor configuration and control software. Including DevWare from Aptina Imaging, OVTATool2009 from Omnivision, and ImaTuning from Toshiba. Thiseliminates the need to capture images separately and load them individually into ImatestMaster, dramatically improving productivity.SetupFollowing is a series of steps required to download, install, configure and prepare the ImageSensor Edition for operation on your computer.Download SoftwareTo download Imatest software, go to /devwareCreate an account, or use your current login.Download the self-extracting executable. It will install the Image Sensor Edition, and theMatlab Component Runtime (MCR), required for the Image Sensor Edition to run. Even if theMCR is already installed check “Matlab Libraries” to ensure you have the version of MCR (7.7) corresponding to the Imatest build (Matlab 7.5). When it installs, check “Modify”. This willensure a complete installation.Follow the directions for registration.For additional Image Sensor software, please refer to the appropriate support and quick start guides for Image Sensor Edition supported software. For example, to install Aptina's DevSuite software, including DevWare, go to /support/Devsuite.jspFollow the directions for registratering Aptina's DevSuite. The registration process will take 1business day, after which you receive an Email with login instructions. Again, additional sensor interface software is available through each company's website or representative.Install SoftwareFollow the directions included in both the Imatest and proprietary image sensor softwareinstallation downloads.Purchase Image Sensor EditionTo purchase, visit: /devware/purchaseTo upgrade Imatest Master to Image Sensor Edition, go to:/devware/upgradeSoftware Startup ProcedureThe Image Sensor Edition is designed to work with multiple proprietary software and hardware image sensor interfaces. This section will provide a detailed walk through for setting up theImage Sensor Edition to work with your specific sensor hardware.Using Image Sensor Edition with Aptina DevWareImatest invites Aptina DevSuite users to take advantage of theImage Sensor Edition, which supports Aptina DevWare in theRescharts and Multicharts analysis modules.1.Start DevWare. For Imatest to acquire an image, it must connect to an existing instance ofDevWare.2.Start the Image Sensor Edition. IS will install Desktop and Start Menu shortcuts if thecorresponding check boxes are selected during installation.3.Imatest defaults to file processing, not image acquisition. To configure it to acquire imagesfrom DevWare, go to either the Rescharts or Multicharts analysis modules.4.In either the Rescharts or Multicharts analysis modules, go to the Settings menu, there willbe an expandable menu labeled Image from Device, expand this menu and select Aptina DevWare.5.This sets the specific source for image data acquisition, in this case Aptina DevSuite's DevWareImage Sensor program.6.This will also automatically select the checkbox Acquire from Device located next to theChart type drop-down box in the main Rescharts or Multicharts window.7.When your imaging system is ready, Click Acquire image, and perform useful analysis rightway.8.Image acquisition is currently available in Rescharts and Multicharts only; this functionality willbe supported in other Imatest modules in a future release.Please refer to both the Imatest and Aptina DevWare Help files and associated usage guides for additional information.Aptina Imaging reserves the right to change products or specifications without notice. ©2008 Micron Technology, Inc. All rightsreserved.Using Image Sensor Edition with Omnivision OVTATool2009Imatest invites Omnivision users to take advantage of the Image Sensor Edition, whichsupports Omnivision's OVTATool2009 in the Rescharts and Multicharts analysis modules.1.Start OVTATool2009. For Imatest to acquire an image, it must connect to an existing instanceof OVTA.2.Start the Image Sensor Edition. IS will install Desktop and Start Menu shortcuts if thecorresponding check boxes are selected during installation.3.Imatest defaults to file processing, not image acquisition. To configure it to acquire imagesfrom OVTATool2009, go to either the Rescharts or Multicharts analysis modules.4.In either the Rescharts or Multicharts analysis modules, go to the Settings menu, there willbe an expandable menu labeled Image from Device, expand this menu and selectOmnivision OVTATool.5.This sets the specific source for image data acquisition, in this case Omnivision's OVTATool2009Image Sensor program.6.This will also automatically select the checkbox Acquire from Device located next to theChart type drop-down box in the main Rescharts or Multicharts window.7.When your imaging system is ready, Click Acquire image, and perform useful analysis rightway.8.Image acquisition is currently available in Rescharts and Multicharts only; this functionality willbe supported in other Imatest modules in a future release.Please refer to both the Imatest and Omnivision OVTATool2009 Help files and associated usage guides for additional information.Omnivision reserves the right to change products or specifications without notice. ©2008 Omnivision, Inc. All rights reserved.Using Image Sensor Edition with Toshiba ImaTuningSoon, Imatest invites Toshiba ImaTuning users to take advantage of the Image Sensor Edition, which will support ImaTuning in the Rescharts and Multicharts analysis modules. Stand by as we complete this integration milestone.Toshiba reserves the right to change products or specifications without notice. ©2009 Toshiba, Inc. All rights reserved.SupportThis section outlines support issues and considerations for the Image Sensor Edition. Forspecific support related questions concerning any of the hardware interface software including Aptina's DevWare, Omnivision OVTATool2009, or Toshiba ImaTuning, please see their helpfiles, guides, and contact the proprietary software vendors for additional support.ContactSupport for the Image Sensor Edition is available at support@imatest. Please report problems using this mailbox, with complete text of error messages. For additional contact regardingproduct questions, features, or purchasing issues please also write support@imatest. Matlab Component RuntimeImatest and image Sensor Edition are Matlab r2007b compiled applications. To operate, itrequires that the corresponding Matlab Component Runtime Library, MCR Version 7.7 beinstalled on your system.If another version of Matlab or the MCR is installed on your system, you may see an error:The procedure entry point svDoubleSclarRemW could not be located in the dynamic link library libmwservices.dllTo correct this, give MCR 7.7 paths priority in the System path variable. Guidance is availableat:/docs/api_exe_instructions.htmlKnown IssuesVery occasionally, an error-out may occur that closes the DOS window. In this case, run Imatest from a new DOS window in the executable directory with the following syntax:imatest > err.txtThis will stop the window from closing, allowing you to read, mark, and copy the exact text of the error message, which may include the location of relevant log files. Please provide this text when reporting problems.Some systems require configuration of the Java VM and report an error to a log file that isidentified easily using the method above. The text of the message is:Error occurred during initialization of VMCould not reserve enough space for object heapMathworks provides a solution to this problem at:/support/solutions/data/1-18I2C.html?solution=1-18I2C and more guidance at: /support/bugreports/details.html? rp=398525Appendix A: RequirementsHardware and Software requirements for Image Sensor Edition. Additional hardware andsoftware requirements may be necessary for any of the Image Sensor Edition supportedhardware interface programs, such as Aptina DevWare, Omnivision OVTATool2009, or Toshiba ImaTuning.Hardware Requirements•Pentium III 450 MHz or higher (a faster processor will improve the displayed frame rate on the PC).•512MB RAM minimum.•USB 2.0 host controller with an available USB 2.0 port.Software Requirements•Windows XP with a minimum of Service Pack 2.•Latest USB 2.0 host controller drivers.。
Multi-Sensor Image Registration, Fusion and Dimension ReductionJacqueline Le MoigneWith the development of future spacecraft formations comes a number of complex challenges such as maintaining precise relative position and specified attitudes, as well as being able to communicate with each other. More generally, with the advent of spacecraft formations, issues related to performing on-board and automatic data computing and analysis as well as decision planning and scheduling will figure among the most important requirements. Among those, automatic image registration, image fusion and dimension reduction represent intelligent technologies that would reduce mission costs, would enable autonomous decisions to be taken on-board, and would make formation flying adaptive, self-reliant, and cooperative. For both on-board and on-the-ground applications, the particular need for dimension reduction is two-fold, first to reduce the communication bandwidth, second as a pre-processing to make computations feasible, simpler and faster.At the same time, continuity of the data as well as extrapolation among several scales, temporal, spatial, and spectral, are key components of many remote sensing applications, and these properties are provided by integration and seamless mosaicking of multiple sensor data, via image registration and image fusion.Image RegistrationIn this work, “image registration” is defined as a feature-based “precision correction,” in opposition to a model-based “systematic correction.” In our experiments, we assume that the data has already been systematically corrected according to a navigation model. The goal of a precision-correction algorithm is to utilize selected image features or control points to refine the geo-location accuracy given by the systematic model within one pixel or a sub-pixel. Currently, there is a large quantity of potential image registration methods that have been developed for aerial or medical images and that are applicable to remote sensing images[1,2]. But there is no consolidated approach to select the most appropriate method for a remote sensing application, given the type of data, the desired accuracy and the type of computational power available with respect to timing requirements. The intent of our work is to survey, design, and develop different components of the registration process and to evaluate their performance on well-chosen multi-sensor data.As a general definition, automatic image registration of satellite image data is the process that aligns one image to a second image of the same scene that was acquired at the same or at different times by different or identical sensors. One set of data is taken as the reference data, and all other data, called input data (or sensed data), is matched relative to the reference data. The general process of image registration includes three main steps:•Extraction of features to be used in the matching process.•Feature matching strategy and metrics.•Data re-sampling based on the computed deformation (sometimes replaced by indexing or fusion.Many choices are available for each of the previous steps[1,2]. Our work[3-12]has mainly been dealing with features such as gray levels, edges, and wavelet coefficients, and matching them using either cross-correlation, Mutual Information or a Hausdorff distance as a similarity metrics, and exhaustive search or optimization techniques as search strategies.Our earlier work utilized cross-correlation as a similarity metrics to compare features such as gray levels, edges, and Daubechies wavelet coefficients using mono-sensor data [4]. Results showed that, as expected, edges or edge-like features like wavelets were more robust to noise, local intensity variations or time-of-the day conditions than original gray level values. At the same time, orthogonal wavelet-based registration was usually faster although not always as accurate than a full-resolution edge-based registration. This lack of consistent accuracy of orthogonal wavelets seemed to be due to their lack of translation-invariance. To study the effects of translation and rotation-invariance of wavelets, we conducted two studies:(1) The first study[11] quantitatively assessed the use of orthogonal wavelet sub-bands asa function of features’ sizes. The results showed that:• Low-pass sub-bands are relatively insensitive to translation, provided that the features of interest have an extent at least twice the size of the wavelet filters (this result is in accordance with the Nyquist's criterion).• High-pass sub-bands, although still useable for registration, are more sensitive to translation.(2) The second study[6] investigated the use of an over complete frame representation, the “Steerable Pyramid” [13]. It was shown that, as expected and due to their translation-and rotation- invariance, Simoncelli’s steerable filters performed better than Daubechies’filters. Rotation errors obtained with steerable filters were minimum, independent of rotation size. Noise studies also reinforced the results that steerable filters showed a better robustness to larger amounts of noise than orthogonal filters.All previous work focused on correlation-based methods used with an exhaustive search. One of the main drawbacks of this method is the prohibitive computation times when the number of transformation parameters increases (e.g., affine transformation vs. shift-only), or when the size of the data increases (full size scenes vs. small portions, multi-band processing vs. mono-band). To answer some of these concerns, we investigated different types of similarity metrics and different types of feature matching strategies. In this study, five different algorithms were developed and compared. The features that were utilized were original gray levels and wavelet features. The different metrics were correlation, mutual information [14] and a Partial Hausdorff distance [15]. The strategies were exhaustive search, optimization and robust feature matching.The multi-sensor dataset used for this study was acquired by four different sensors over one of the MODIS Validation Core Sites, the Konza Prairie in Kansas, United States, and included:•IKONOS Bands 3 (Red) and 4 (Near-Infrared), spatial resolution of 4 meters per pixel.•Landsat-7/ETM+ Bands 3 (Red) and 4 (Near-Infrared), spatial resolution of 30 meters per pixel.•MODIS Bands 1 (Red) and 2 (Near Infrared), spatial resolution of 500 meters, per pixel.•SeaWiFS Bands 6 (Red) and 8 (Near Infrared), spatial resolution of 1000 meters per pixel.Compatible spatial resolutions were obtained by performing recursive decimation by 2 of the wavelet transform. Overall, all results obtained by the 5 algorithms were similar within 0.5 degrees in rotation and within 1 pixel in translation.Then, subpixel registration capabilities of some of the previous algorithm components were assessed by registering a coarse image to a fine image at the resolution of the fine image. For this purpose, we utilized a multiphase filtering technique, in which all possible phases of the fine image are registered with respect to the coarse image. Each different phase is filtered and down-sampled to the coarse resolution. The phase that gives the best registration metric gives the registration to the resolution of the fine image. We registered this data using two different criteria, normalized correlation and mutual information. The results showed that both correlation and mutual information have an overall accuracy of about 0.5 pixels with a 0.25 pixel accuracy for same-band data. Another way to look at the data is to analyze the self-consistency of the measurements. For this analysis, we considered 3 images and computed the (x,y)offset of one of the images from the other two in two different ways (i.e., [Image1to Image 2] and [Image1 to Image3 to Image 2]). If the registrations are self-consistent, the answers should be the same. In this experiment, we showed that correlation and mutual information exhibited self-consistency within 1/8 pixel.Image FusionAfter an accurate multi-sensor registration, the complementary information provided by different sensors with multiple spatial and spectral resolutions can be integrated through image fusion. This is the focus of the following investigation, characterization and mapping of land cover/land use of forest areas, such as the Central African rainforest. This task is very complex, mainly because of the extent of such areas and, as a consequence, because of the lack of full and continuous cloud-free coverage of those large regions by one single remote sensing instrument. In order to provide improved vegetation maps of Central Africa and to develop forest-monitoring techniques for applications at the local and regional scales, we are studying the possibility of utilizing multi-sensor remote sensing observations coupled with in-situ data. Fusion and clustering of multi-sensor data are the first steps towards the development of such a forest monitoring system. Our first experiments involve the fusion of SAR and Landsat image data of the Lopé Reserve in Gabon [18].Wavelet-Based FusionDecompositionReconstructionResolution ...High SpatialResolutionData Low SpatialResolutionDataSimilarly to previous fusion studies [16,17], our fusion method is wavelet-based. Figure 1illustrates the wavelet-based fusion idea, where high- and low-resolution data are independently decomposed using a multi-resolution wavelet. Then, components from both decompositions are combined during the reconstruction phase to create the new fused data. In this scheme, low-frequency information of the lowest spatial resolution data (e.g., Landsat or MODIS data) are combined with high-frequency information of the highest resolution data (resp., SAR or JERS data) in order to take simultaneous advantage of the higher spatial and spectral resolutions. In this study, the same Daubechies filter size 4 was used for both decomposition and reconstruction phases and for both types of data. But we are now investigating the use of different filters for decomposition and reconstruction as well as for high- and low-resolution data that would better preserve the spatial, spectral and textural properties of the data. The fusion stage is followed by unsupervised classification, first to validate our fusion method, and then to obtain avegetation map of the area of interest. The classification obtained after fusion of SAR and Landsat is then compared to the classification obtained from Landsat data alone. Results are shown in Figures 2 and 3, where dark green, light green, orange, light blue, pink, and dark blue represent respectively Mountain Forest, Mixed Forest, Okoume Forest,Savanna, Fern Savanna, and Burnt Savanna. Qualitatively, we can see that the results are similar, but that the fused clustering shows more localized details with differentiation of the different types of savannas in the right side of the image and a different clustering of Mountain Forest versus Mixed Forest in the left side of the image. These results will beevaluated quantitatively, once in-situ data become available.Figure 2 - Landsat Classification Figure3 - Fused Data Classification Dimension ReductionThe introduction of hyperspectral instruments results in a large increase of remotesensing data volumes. Dimension reduction of such data, by filtering out redundant information, can reduce data volumes and speed up further processing, such as supervisedor unsupervised classification. Considering such data increases, and anticipating the ultraspectral instruments of the future, we investigated existing methods such as the Principal Component Analysis (PCA) and its implementation on a parallel architecturelike the COTS-based Beowulf architecture. We also looked at a parallel adaptive PCA [19], and we developed a new wavelet-based dimension reduction method [20].Adaptive and Parallel Principal Component AnalysisDue to its conceptual simplicity, Principal Component Analysis (PCA) is the most widely used among dimension reduction techniques. The general idea of this process is to project the data in a different coordinate system and to obtain a lower dimension that provides a compact and uncorrelated representation of the data. The first principal component (PC1) has the largest percentage of the overall data variance, also representing the "information content." The following principal components, from component number 2 to n, contain a decreasing percentage of total data variation.Because of the high computational demands of PCA, its implementation on a parallel processor needs to be addressed. Two basic methods for performing the PCA computations are considered: the power method and the Jacobi method. The power method computes the eigenvalues one by one starting with the largest one (which is associated with the PC that contains most of the information), then moving to the next largest and so on. The power method, therefore, offers the opportunity to only computethe eigenvalues and the PCs that correspond to a desired level of information content.The Jacobi method computes all eigenvalues at once, and therefore may require a higher execution time. But, in a parallel implemention, the Jacobi method scales better than the power method when a larger number of the PCs are computed. Thus, for cases where a relatively small level of information content is needed, the power method could work faster, while, when a higher level of information content is needed, the Jacobi method should be used instead.As a consequence, we developed an adaptive algorithm that quickly reduces the dimensionality of hyperspectral data by adaptively selecting which of the two methods to use, depending on the number of PC’s needed or equivalently depending on the desired level of information content. Experimental results not only show scalability, but also demonstrate that the execution time of this application has been brought to feasible levels using a cost-efficient high performance computer, a Pentium-based Beowulf System.Both algorithms and the adaptive method were tested on hyperspectral data obtained from the AVIRIS imaging spectrometer, with a spatial resolution of 17m x 17m and a spectral resolution of 224 channels. As a parallel architecture, we used a Beowulf machinedeveloped at NASA/Goddard, the HIVE (Highly-parallel Integrated Virtual Environment), which consists of four sub-clusters containing a total of 332 processors. In this work, we use a sub-cluster with 2 dual-Pentium Pro host nodes, and 66 dual-Pentium Pro PCs (132 processors) working as compute nodes.As an illustration, Figure 4 shows the timing and specific crossing point (in terms of information content) at which one or the other of the algorithms, Jacobi or Power, needsPCs IC (%)Power-based Jacobi-based2099.8512787.08 sec92.05 sec2199.8563896.74 sec94.71 secFigure 4 - Timing and Switching Decision for the AVIRIS Data (SequentialImplementation)In implementing the parallel algorithms, special attention was given to the fact that communication bandwidth and latency in clusters do not compare favorably with processing speed. For example, computing the mean in the master node and broadcasting it is more efficient than computing the mean in parallel. Table 1 shows the execution time for 2, 4, 8, and 16 processors. For the same underlying hardware, the specific crossing point differs based on the data set. The general implication for the adaptive algorithm is that a threshold of 99 percent information content can be used, and will ensure that the adaptive algorithm is performing at or around the optimal execution time for computing the desired PCs.Table 1 –Number of Principal Components;IC = Information Content (in percent)A Wavelet-Based Dimension Reduction TechniqueThe principle of this wavelet-based method is to apply a discrete one-dimensional wavelet transform to hyperspectral data in the spectral domain and at each pixel. Figure 5 shows an example of the actual signature of one class (Corn-notill) for 192 bands of an AVIRIS dataset, and different levels of wavelet decomposition of this spectral signature. When the number of bands is reduced, the structure of the spectral signature becomes smoother than the structure of the original signature, but the signal still shows the most important features for several levels. Once the 1-D wavelet decomposition is applied to each pixel signature, the wavelet coefficients yield a reduced-dimensional data set that can be used for applications such as supervised classification.Figure 5 - An example of the Corn-notill spectral signature and different levelsof wavelet decompositionFrom a complexity point of a view, the wavelet-based reduction method yields the order of O(MN), where N is the number of bands and M is the number of pixels inthe spatial domain. On the other hand, the total estimated complexity of PCA isO(MN2+N3), which shows that the computation efficiency of a wavelet reduction technique is superior to the efficiency of the PCA method.Validation of the wavelet-based reduction is performed using supervised classification with 1992 AVIRIS data of the northern part of Indiana (US). Theresults (Table 2) show that our new wavelet-based reduction technique provides a greater computational efficiency as well as a better overall classification accuracythan the widely used PCA method. For this dataset and the Maximum Likelihood (ML) classification, it is shown that the Wavelet Reduction gives 79% overall accuracy for the third level of decomposition, while PCA only gives 77.5% for an equivalent 24 PCs for the ML classification or 81% versus 79% for an equivalent48PC's. The same trend was seen with another AVIRIS dataset. The two other classification methods, Minimum Distance and Parallelepiped, used for comparison purpose, are sometimes chosen over the Maximum Likelihood classificationbecause of their speed, but are known to be much less accurate than the ML classification.Table 2Different types of classifications of PCA vs. wavelet, different levels ofdecomposition (IndianPines’92)In summary, both analytical assessment of time complexity and experimental results of classification accuracy have proven that the 1-D wavelet-based dimension reduction technique is an efficient method in reducing dimensionality of hyperspectral data. Its performance, assessed through classification accuracy, is comparable and often superior to the PCA method performance.References1. A. Goshtasby, J. Le Moigne, “Special Issue Image Registration,” PatternRecognition, V.32, N.1, 1999.2.L. Brown, “A Survey of Image Registration Techniques,” ACM ComputingSurveys, vol. 24, no.4, 1992.3.J. Le Moigne, W.J. Campbell, and R.F. Cromp, “An Automated Parallel ImageRegistration Technique of Multiple Source Remote Sensing Data,” IEEETransactions on Geoscience and Remote Sensing, Vol. 40, No. 8, pp. 1849-1864, August 2002.4.J. Le Moigne, W. Xia, J. Tilton, T. El-Ghazawi, M. Mareboyana, N.Netanyahu, W. Campbell, R. Cromp, “First Evaluation of Automatic Image Registation Methods,” IGARSS’98, July 19985.J. Le Moigne, “Parallel Registration of Multi-Sensor Remotely Sensed ImageryUsing Wavelet Coefficients,” SPIE Aerospace Sensing, Wavelet Applications, Orlando, 1994.6.J. Le Moigne, and I. Zavorin, “Use of Wavelets for Image Registration,” SPIEAerosense 2000, "Wavelet Applications VI", Orlando, FL, April 24-28, 2000. 7. D. Mount, N. Netanyahu, J. Le Moigne, “Efficient Algorithms for RobustFeature Matching,” Pattern Recognition on Image Registration, Vol. 32, No. 1, January 1999.8.J. Le Moigne, N. Netanyahu, J. Masek, D. Mount, S. Goward, “RobustMatching of Wavelet Features for Sub-Pixel Registration of Landsat Data,”IGARSS'01, Sydney, Australia, July 9-13, 20019.J. Le Moigne, A. Cole-Rhodes, R. Eastman, K. Johnson, J. Morisette, N.Netanyahu, H. Stone, and I. Zavorin, “ Multi-Sensor Registration of EarthRemotely Sensed Imagery,” 8-th SPIE Int. Symp. Remote Sensing, Image andSignal Processing for Remote Sensing VII, Vol. #4541, France, September2001.10.R. Eastman and J. Le Moigne, "Gradient-Descent Techniques for Multi-Temporal and Multi-Sensor Image Registration of Remotely Sensed Imagery,"FUSION'2001, 4-th International Conference on Information Fusion, Montreal, Canada, August 7-10, 2001.11.H. Stone, J. Le Moigne, and M. McGuire, “Image Registration Using WaveletTechniques,” IEEE-PAMI, 21, 10,1999.12.K. Johnson, A. Rhodes, J. Le Moigne I. Zavorin, ”Multi-resolution ImageRegistration of Remotely Sensed Imagery using Mutual Information,” SPIE Aerosense "Wavelet Applications VII", April 2001.13.E. Simoncelli, W. Freeman, “The Steerable Pyramid: A Flexible Architecturefor Multi-Scale Derivative Computation,” 2-nd IEEE ICIP, 1995.14.F. Maes, A. Collignon, D. Vandermeulen, G. Marchal, P. Suetens,“Multimodality Image Registration by Maximization of Mutual Information,”IEEE Trans. on Medical Imaging, Vol. 16, No.2, April 1997.15.D.P. Huttenlocher, G.A. Klanderman, and W.J. Rucklidge, “Comparing ImagesUsing the Hausdorff Distance,” IEEE Transactions on Pattern AnalysisMachine Intelligence, Vol. 15, 1993, pp. 850--863.16.C. Pohl, and J.L. Van Genderen, “Multisensor Image Fusion in RemoteSensing: Concepts, Methods and Applications,” International Journal ofRemote Sensing, vol. 19, No. 5, pps. 823-854, 1998.17.T. Ranchin, and L. Wald, “Data Fusion of Remotely Sensed Images Using theWavelet Transform: the ARSIS Solution,” Proceedings SPIE WaveletApplications in Signal and Image Processing IV, 1997.18.J. Le Moigne, N. Netanyahu, and N. Laporte, “Enhancement of Tropical LandCover Mapping with Wavelet-Based Fusion and Unsupervised Clustering of SAR and Landsat Image Data,” Proceedings of the 8-th SPIE InternationalSymposium on Remote Sensing, Image and Signal Processing for RemoteSensing VII, Vol. #4541, Toulouse, France, September 17-21, 2001.19.T. El-Ghazawi, S. Kaewpijit, J. Le Moigne, “Parallel and Adaptive Reductionof Hyperspectral Data to Intrinsic Dimensionality,” CLUSTER’01, IEEE Intern.Conf. on Cluster Computing, CA., Oct. 2001.20.S. Kaewpijit, J. Le Moigne, and T. El-Ghazawi. “Spectral Data Reduction viaWavelet Decomposition,” Proc. of SPIE, Wavelet Applications IX, 4-5 April 2002, Orlando, Florida.。