曼昆宏观经济学最新英文版参考答案第25章
- 格式:docx
- 大小:16.77 KB
- 文档页数:3

Chapter 28Problems and Applications1. The labor force consists of the number of employed (142,076,000) plus the number of unemployed(7,497,000), which equals 149,573,000.To find the labor-force participation rate, we need to know the size of the adult population. Adding the labor force (149,573,000) to the number of people not in the labor force (76,580,000) gives the adult population of 226,153,000. The labor-force participation rate is the labor force (149,573,000) divided by the adult population (226,153,000) times 100%, which equals 66%.The unemployment rate is the number of unemployed (7,497,000) divided by the labor force(149,573,000) times 100%, which equals 5.0%.2. Many answers are possible.3. Men age 55 and over experienced the greatest decline in labor-force participation. This wasbecause of increased Social Security benefits and retirement income, encouraging retirement at an earlier age.4. Younger women experienced a bigger increase in labor-force participation than older womenbecause more of them have entered the labor force (in part because of social changes), so there are more two-career families. In addition, women have delayed having children until later in life and have reduced the number of children they have, so they are in the labor force for a greater proportion of their lives than was the case previously.5. The fact that employment increased 1.5 million while unemployment declined 0.6 million isconsistent with growth in the labor force of 0.9 million workers. The labor force constantlyincreases as the population grows and as labor-force participation increases, so the increase in the number of people employed may always exceed the reduction in the number unemployed.6. a. A construction worker who is laid off because of bad weather is likely to experienceshort-term unemployment, because the worker will be back to work as soon as theweather clears up.b. A manufacturing worker who loses her job at a plant in an isolated area is likely toexperience long-term unemployment, because there are probably few other employmentopportunities in the area. She may need to move somewhere else to find a suitable job,which means she will be out of work for some time.c. A worker in the stagecoach industry who was laid off because of the growth of railroads islikely to be unemployed for a long time. The worker will have a lot of trouble findinganother job because his entire industry is shrinking. He will probably need to gainadditional training or skills to get a job in a different industry.d. A short-order cook who loses his job when a new restaurant opens is likely to find anotherjob fairly quickly, perhaps even at the new restaurant, and thus will probably have only ashort spell of unemployment.e. An expert welder with little education who loses her job when the company installsautomatic welding machinery is likely to be without a job for a long time, because she lacksthe technological skills to keep up with the latest equipment. To remain in the weldingindustry, she may need to go back to school and learn the newest techniques.12 Chapter 28/Unemployment7. Figure 2 shows a diagram of the labor market with a binding minimum wage. At the initial minimumwage (m1), the quantity of labor supplied L1S is greater than the quantity of labor demanded L1D, and unemployment is equal to L1S−L1D. An increase in the minimum wage to m2 leads to anincrease in the quantity of labor supplied to L2S and a decrease in the quantity of labor demanded to L2D. As a result, unemployment increases as the minimum wage rises.Figure 28. a. Figure 3 illustrates the effect of a union being established in the manufacturing labormarket. In the figure on the left, the wage rises from w1U to w2U and the quantity of labordemanded declines from U1 to U2D. Because the wage is higher, the quantity supplied oflabor increases to U2S, so there are U2S−U2D unemployed workers in the unionizedmanufacturing sector.b. When those workers who become unemployed in the manufacturing sector seekemployment in the service labor market, shown in the figure on the right, the supply oflabor shifts to the right from S1 to S2. The result is a decline in the wage in thenonunionized service sector from w1N to w2N and an increase in employment in thenonunionized service sector from N1 to N2.Chapter 28/Unemployment 3Figure 39. a. When the Japanese developed a strong auto industry, U.S. auto demand became moreelastic as a result of increased competition. With more elastic demand for autos, theelasticity of demand for American autoworkers increased.b. Because the rise in auto imports made the demand for autoworkers more elastic, tomaintain a higher-than-competitive wage rate requires a greater reduction in the quantityof labor demanded. So the union had to choose between allowing the union wage todecline or facing the loss of many jobs.c. Given the trade-off faced by the union, the growth of the Japanese auto industry forcedthe union wage to move closer to the competitive wage.10. a. If a firm was not providing such benefits prior to the legislation, the curve showing thedemand for labor would shift down by exactly $4 at each quantity of labor, because thefirm would not be willing to pay as high a wage given the increased cost of the benefits.b. If employees value the benefit by exactly $4 per hour, they would be willing to work thesame amount for a wage that's $4 less per hour, so the supply curve of labor shifts downby exactly $4.Figure 4c. Figure 4 shows the equilibrium in the labor market. Because the demand and supply curvesof labor both shift down by $4, the equilibrium quantity of labor is unchanged and thewage rate declines by $4. Both employees and employers are just as well off as before.d. If the minimum wage prevents the wage from falling, the result will be increasedunemployment, as Figure 5 shows. Initially, the equilibrium quantity of labor is L1 and theequilibrium wage is w1, which is $3 lower than the minimum wage w m. After the law ispassed, demand falls to D2 and supply rises to S2. Because of the minimum wage, thequantity of labor demanded (L2D) will be smaller than the quantity supplied (L2S). Thus,there will be unemployment equal to L2S–L2D.4 Chapter 28/UnemploymentFigure 5Figure 6e. If the workers do not value the mandated benefit at all, the supply curve of labor does notshift down. As a result, the wage rate will decline by less than $4 and the equilibriumquantity of labor will decline, as shown in Figure 6. Employers are worse off, because they now pay a greater total wage plus benefits for fewer workers. Employees are worse off,because they get a lower wage and fewer are employed.。
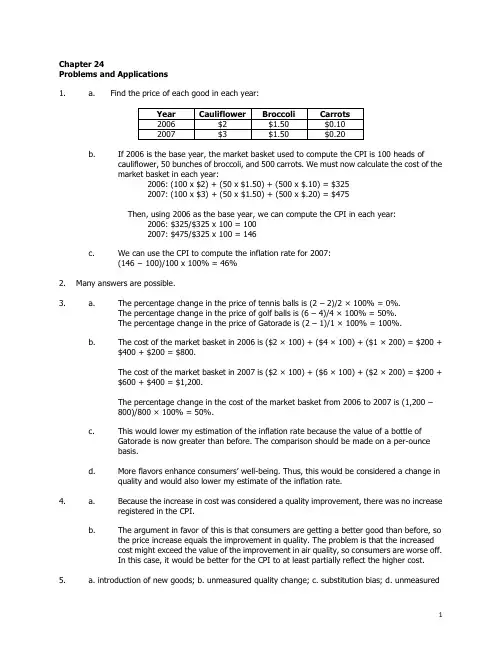
Chapter 24Problems and Applicat ions1. a. Find the price of each good in each year:b. If 2006 is the base year, the market basket used to compute the CPI is 100 heads ofcauliflower, 50 bunches of broccoli, and 500 carrots. We must now calculate the cost of themarket basket in each year:2006: (100 x $2) + (50 x $1.50) + (500 x $.10) = $3252007: (100 x $3) + (50 x $1.50) + (500 x $.20) = $475Then, using 2006 as the base year, we can compute the CPI in each year:2006: $325/$325 x 100 = 1002007: $475/$325 x 100 = 146c. We can use the CPI to compute the inflation rate for 2007:(146 − 100)/100 x 100% = 46%2. Many answers are possible.3. a. The percentage change in the price of tennis balls is (2 – 2)/2 × 100% = 0%.The percentage change in the price of golf balls is (6 – 4)/4 × 100% = 50%.The percentage change in the price of Gatorade is (2 – 1)/1 × 100% = 100%.b. The cost of the market basket in 2006 is ($2 × 100) + ($4 × 100) + ($1 × 200) = $200 +$400 + $200 = $800.The cost of the market basket in 2007 is ($2 × 100) + ($6 × 100) + ($2 × 200) = $200 +$600 + $400 = $1,200.The percentage change in the cost of the market basket from 2006 to 2007 is (1,200 –800)/800 × 100% = 50%.c. This would lower my estimation of the inflation rate because the value of a bottle ofGatorade is now greater than before. The comparison should be made o n a per-ouncebasis.d. More flavors enhance consumers’ well-being. Thus, this would be considered a change inquality and would also lower my estimate of the inflation rate.4. a. Because the increase in cost was considered a quality improvement, there was no increaseregistered in the CPI.b. The argument in favor of this is that consumers are getting a better good than before, sothe price increase equals the improvement in quality. The problem is that the increasedcost might exceed the value of the improvement in air quality, so consumers are worse off.In this case, it would be better for the CPI to at least partially reflect the higher cost.5. a. introduction of new goods; b. unmeasured quality change; c. substitution bias; d. unmeasured1Chapter 24/Measuring the Cost of Living 2quality change; e. substitution bias6. a. ($0.75 − $0.15)/$0.15 x 100% = 400%.b. ($14.32 − $3.23)/$3.23 x 100% = 343%.c. In 1970: $0.15/($3.23/60) = 2.8 minutes. In 2000: $0.75/($14.32/60) = 3.1 minutes.d. Workers' purchasing power fell in terms of newspa pers.7. a. If the elderly consume the same market basket as other people, Social Security wouldprovide the elderly with an improvement in their standard of living each year because theCPI overstates inflation and Social Security payments are tied to the CPI.b. Because the elderly consume more health care than younger people do, and becausehealth care costs have risen faster than overall inflation, it is possible that the elderly areworse off. To investigate this, you would need to put together a mar ket basket for theelderly, which would have a higher weight on health care. You would then compare the risein the cost of the "elderly" basket with that of the general basket for CPI.8. When bracket creep occurred, inflation increased people's nominal incomes, pushing them intohigher tax brackets, so they had to pay a higher proportion of their incomes in taxes, even though they were not getting higher real incomes. As a result, real tax revenue rose.9. In deciding how much income to save for retirement, workers should consider the real interest rate,because they care about their purchasing power in the future, not the number of dollars they will have.10. a. When inflation is higher than was expected, the real interest rate is lower than expected.For example, suppose the market equilibrium has an expected real interest rate of 3% andpeople expect inflation to be 4%, so the nominal interest rate is 7%. If inflation turns outto be 5%, the real interest rate is 7% minus 5% equals 2%, which is less than the 3% thatwas expected.b. Because the real interest rate is lower than was expected, the lender loses and theborrower gains. The borrower is repaying the loan with dollars that are worth less than wasexpected.c. Homeowners in the 1970s who had fixed-rate mortgages from the 1960s benefited fromthe unexpected inflation, while the banks that made the mortgage loans were harmed.。
第一篇导言复习题第一章宏观经济学的科学1、解释宏观经济学和微观经济学之间的差距,这两个领域如何相互关联?【答案】微观经济学研究家庭和企业如何作出决策以及这些决策在市场上的相互作用。
微观经济学的中心原理是家庭和企业的最优化——他们在目的和所面临的约束条件下可以让自己的境况更好。
而相对的,宏观经济学研究经济的整体情况,它主要关心总产出、总就业、一般物价水平和国际贸易等问题,以及这些宏观指标的波动趋势与规律。
应该看到,宏观经济学研究的这些宏观经济变量是以经济体系中千千万万个体家庭和企业之间的相互作用所构成的。
因此,微观经济决策总是构成宏观经济模型的基础,宏观经济学必然依靠微观经济基础。
2、为什么经济学家建立模型?【答案】一般来说,模型是对某些具体事物的抽象,经济模型也是如此。
经济模型可以简洁、直接地描述所要研究的经济对象的各种关系。
这样,经济学家可以依赖模型对特定的经济问题进行研究;并且,由于经济实际不可控,而模型是可控的,经济学家可以根据研究需要,合理、科学的调整模型来研究各种经济情况。
另外,经济模型一般是数学模型,而数学是全世界通用的科学语言,使用规范、标准的经济模型也有利于经济学家正确表达自己的研究意图,便于学术交流。
3、什么是市场出清模型?什么时候市场出清的假设是适用的?【答案】市场出清模型就是供给与需求可以在价格机制调整下很快达到均衡的模型。
市场出清模型的前提条件是价格是具有伸缩性的(或弹性)。
但是,我们知道价格具有伸缩性是一个很强的假设,在很多实际情况下,这个假设都是不现实的。
比如:劳动合同会使劳动力价格在一段时期内具有刚性。
因此,我们必须考虑什么情况下价格具有伸缩性是合适的。
现在一般认为,在研究长期问题时,假设价格具有伸缩性是合理的;而在研究短期问题时,最好假设价格具有刚性。
因为,从长期看,价格机制终将发挥作用,使市场供需平衡,即市场出清,而在短期,价格机制因其他因素制约,难以很快使市场出清。
第七篇高深的论题第二十一章消费者选择理论复习题1.某消费者收人为3 000美元。
红酒1杯3美元,奶酪1磅6美元。
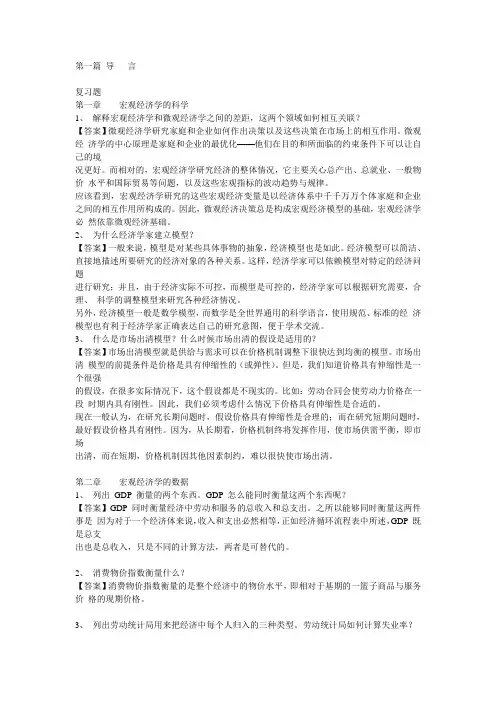
画出该消费者的预算约束线。
这条预算约束线的斜率是多少?答:因为预算约束线的斜率等于两种物品的相对价格,因此这条预算约束线的斜率为1/2。
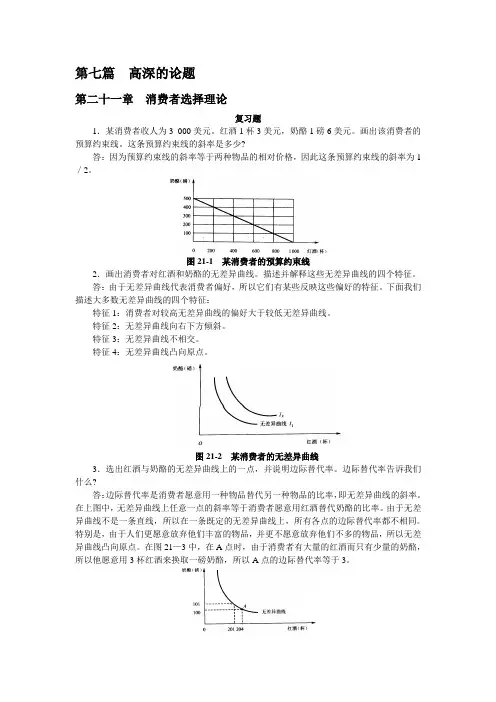
图21-1 某消费者的预算约束线2.画出消费者对红酒和奶酪的无差异曲线。
描述并解释这些无差异曲线的四个特征。
答:由于无差异曲线代表消费者偏好,所以它们有某些反映这些偏好的特征。
下面我们描述大多数无差异曲线的四个特征:特征1:消费者对较高无差异曲线的偏好大于较低无差异曲线。
特征2:无差异曲线向右下方倾斜。
特征3:无差异曲线不相交。
特征4:无差异曲线凸向原点。
图21-2 某消费者的无差异曲线3.选出红酒与奶酪的无差异曲线上的一点,并说明边际替代率。
边际替代率告诉我们什么?答:边际替代率是消费者愿意用一种物品替代另一种物品的比率,即无差异曲线的斜率。
在上图中,无差异曲线上任意一点的斜率等于消费者愿意用红酒替代奶酪的比率。
由于无差异曲线不是一条直线,所以在一条既定的无差异曲线上,所有各点的边际替代率都不相同。
特别是,由于人们更愿意放弃他们丰富的物品,并更不愿意放弃他们不多的物品,所以无差异曲线凸向原点。
在图21—3中,在A点时,由于消费者有大量的红酒而只有少量的奶酪,所以他愿意用3杯红酒来换取一磅奶酪,所以A点的边际替代率等于3。
图21-3 凸向原点的无差异曲线4.说明消费者的预算约束线和红酒与奶酪的无差异曲线。
说明最优消费选择。
如果1杯红酒的价格是3美元,而1磅奶酪的价格是6美元,在这种最优时边际替代率是多少?答:在最优消费选择时,无差异曲线的斜率等于预算约束线的斜率,也就是无差异曲线与预算约束线相切的那一点。
本题中无差异曲线的斜率是奶酪和红酒之间的替代率,而预算约束线的斜率是奶酪和红酒的相对价格,因此,消费者在作出自己的消费选择时把红酒和奶酪的相对价格作为既定的,然后选择使他的边际替代率等于红酒和奶酪相对价格的那一点。
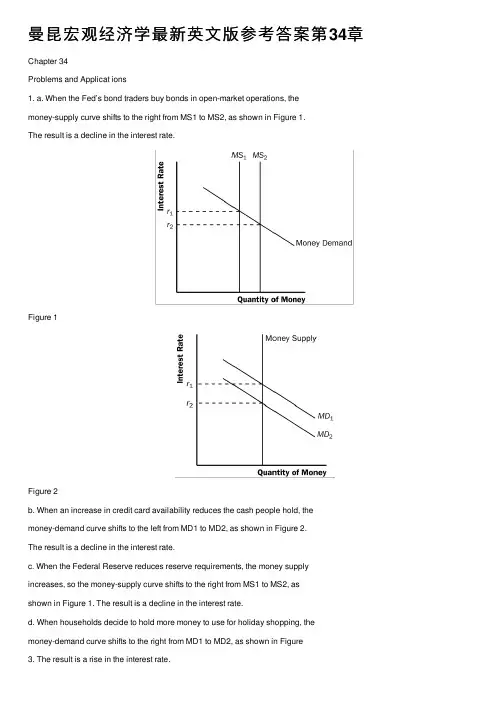
曼昆宏观经济学最新英⽂版参考答案第34章Chapter 34Problems and Applicat ions1. a. When the Fed’s bond traders buy bonds in open-market operations, themoney-supply curve shifts to the right from MS1 to MS2, as shown in Figure 1.The result is a decline in the interest rate.Figure 1Figure 2b. When an increase in credit card availability reduces the cash people hold, themoney-demand curve shifts to the left from MD1 to MD2, as shown in Figure 2.The result is a decline in the interest rate.c. When the Federal Reserve reduces reserve requirements, the money supply increases, so the money-supply curve shifts to the right from MS1 to MS2, asshown in Figure 1. The result is a decline in the interest rate.d. When households decide to hold more money to use for holiday shopping, themoney-demand curve shifts to the right from MD1 to MD2, as shown in Figure3. The result is a rise in the interest rate.Figure 3e. When a wave of optimism boosts business investment and expands aggregatedemand, money demand increases from MD1 to MD2 in Figure 3. The increase in money demand increases the interest rate.Figure 42. a. The increase in the money supply will cause the equilibrium interest rate todecline, as shown in Figure 4. Households will increase spending and willinvest in more new housing. Firms too will increase investment spending. Thiswill cause the aggregate demand curve to shift to the right as shown in Figure5.Figure 5b. As shown in Figure 5, the increase in aggregate demand will cause an increase in both output and the price level in the short run.c. When the economy makes the transition from its short-run equilibrium to its long-run equilibrium, short-run aggregate supply will decline, causing the price level to rise even further.d. The increase in the price level will cause an increase in the demand for money, raising the equilibrium interest rate.e. Yes. While output initially rises because of the increase in aggregate demand, it will fall once short-run aggregate supply declines. Thus, there is no long-run effect of the increase in the money supply on real output.Figure 63. a. When more ATMs are available, money demand is reduced and themoney-demand curve shifts to the left from MD1 to MD2, as shown in Figure 6.If the Fed does not change the money supply, which is at MS1, the interest rate will decline from r1 to r2. The decline in the interest rate shifts theaggregate-demand curve to the right, as consumption and investment increase.b. If the Fed wants to stabilize aggregate demand, it should reduce the money supply to MS2, so the interest rate will remain at r1 and aggregate demand will not change.4. A tax cut that is permanent will have a bigger impact on consumer spending and aggregate demand. If the tax cut is permanent, consumers will view it as addingsubstantially to their financial resources, and they will increase their spendingsubstantially. If the tax cut is temporary, consumers will view it as adding just a little to their financial resources, so they will not increase spending as much.5. a. The current situation is shown in Figure 7.Figure 7b. The Fed will want to stimulate aggregate demand. Thus, it will need to lowerthe interest rate by increasing the money supply. This could be achieved if the Fed purchases government bonds from the public.Figure 8c. As shown in Figure 8, the Fed's purchase of government bonds shifts thesupply of money to the right, lowering the interest rate.d. The Fed's purchase of government bonds will increase aggregate demand asconsumers and firms respond to lower interest rates. Output and the pricelevel will rise as shown in Figure 9.Figure 96. a. Legislation allowing banks to pay interest on checking deposits increases the return to money relative to other financial assets, thus increasing money demand.b. If the money supply remained constant (at MS1), the increase in the demand for money would have raised the interest rate, as shown in Figure 10. The risein the interest rate would have reduced consumption and investment, thus reducing aggregate demand and output.c. To maintain a constant interest rate, the Fed would need to increase the money supply from MS1 to MS2. Then aggregate demand and output would be unaffected.Figure 107. a. If there is no crowding out, then the multiplier equals 1/(1 –MPC). Because the multiplier is 3, then MPC = 2/3.b. If there is crowding out, then the MPC would be larger than 2/3. An MPC that is larger than 2/3 would lead to a larger multiplier than 3, which is then reduced down to 3 by the crowding-out effect.8. a. The initial effect of the tax reduction of $20 billion is to increase aggregatedemand by $20 billion x 3/4 (the MPC) = $15 billion.b. Additional effects follow this initial effect as the added incomes are spent. Thesecond round leads to increased consumption spending of $15 billion x 3/4 =$11.25 billion. The third round gives an increase in consumption of $11.25billion x 3/4 = $8.44 billion. The effects continue indefinitely. Adding them allup gives a total effect that depends on the multiplier. With an MPC of 3/4, themultiplier is 1/(1 – 3/4) = 4. So the total effect is $15 billion x 4 = $60 billion.c. Government purchases have an initial effect of the full $20 billion, becausethey increase aggregate demand directly by that amount. The to tal effect of anincrease in government purchases is thus $20 billion x 4 = $80 billion. Sogovernment purchases lead to a bigger effect on output than a tax cut does.The difference arises because government purchases affect aggregatedemand by the full amount, but a tax cut is partly saved by consumers, andtherefore does not lead to as much of an increase in aggregate demand.9. If government spending increases, aggregate demand rises, so money demand rises.The increase in money demand leads to a rise in the interest rate and thus a decline in aggregate demand if the Fed does not respond. But if the Fed maintains a fixed interest rate, it will increase money supply, so aggregate demand will not decline. Thus, theeffect on aggregate demand from an increase in government spending will be larger if the Fed maintains a fixed interest rate.10. a. Expansionary fiscal policy is more likely to lead to a short-run increase ininvestment if the investment accelerator is large. A large investmentaccelerator means that the increase in output caused by expansionary fiscalpolicy will induce a large increase in investment. Without a large accelerator,investment might decline because the increase in aggregate demand will raisethe interest rate.b. Expansionary fiscal policy is more likely to lead to a short-run increase ininvestment if the interest sensitivity of investment is small. Because fiscalpolicy increases aggregate demand, thus increasing money demand and theinterest rate, the greater the sensitivity of investment to the interest rate thegreater the decline in investment will be, which will offset the positiveaccelerator effect.11. a. Tax revenue declines when the economy goes into a recession because taxesare closely related to economic activity. In a recession, people's incomes andwages fall, as do firms' profits, so taxes on these things decline.b. Government spending rises when the economy goes into a recession becausemore people get unemployment-insurance benefits, welfare benefits, andother forms of income support.c. If the government were to operate under a strict balanced-budget rule, it would have to raise tax rates or cut government spending in a recession. Both would reduce aggregate demand, making the recession more severe.12. a. If there were a contraction in aggregate demand, the Fed would need to increase the money supply to increase aggregate demand and stabilize the price level, as shown in Figure 11. By increasing the money supply, the Fed is able to shift the aggregate-demand curve back to AD1 from AD2. This policy stabilizes output and the price level.Figure 11b. If there were an adverse shift in short-run aggregate supply, the Fed would need to decrease the money supply to stabilize the price level, shifting the aggregate-demand curve to the left from AD1 to AD2, as shown in Figure 12. This worsens the recession caused by the shift in aggregate supply. To stabilize output, the Fed would need to increase the money supply, shifting the aggregate-demand curve from AD1 to AD3. However, this action would raise the price level.。
宏观经济学课后习题答案(共9篇)宏观经济学课后习题答案(一): 这是曼昆的宏观经济学的24章的课后习题,求高手解答,我要详细的计算过程!答案我已经知道,是变动0.4美元在长期中,糖果的价格从0.10美元上升到0.60美元。
在同一时期中,消费物价指数从150上升到300。
根据整体通货膨胀进行调整后,糖果的价格变动了多少我要详细的解答过程,怎么算的就行了!由CPI可知,通货膨胀率=(300-150)/150*100%=100%糖果的原始价格P=0.1在这段时间通过通货膨胀变为0.1*(1+通货膨胀率)=0.2实际上糖果在后来卖到了0.6,所以糖果实际价格变动了0.6-0.2=0.4美元宏观经济学课后习题答案(二): 曼昆宏观经济学26章课后题答案是不是错了假设政府明年借债比今年多了200亿美元,对于可贷资金市场的利率和投资,供给和需求曲线的变动,答案是不是有错答案说是供给曲线不变,需求曲线右移,我认为是需求曲线不动,供给曲线左移……财政政策当然变动的是需求,供给怎么可能变动,你可能是总供给和总需求有些混淆,我开始的时候也不是很清楚,多看几遍就明白了,供给曲线可能因为劳动力变动,而合财政货币政策无关.这些政策变动的都是需求.另外右移就是借钱多了,就是投资需求多了,就是G多了,那就是需求曲线右移了宏观经济学课后习题答案(三): 谁有高鸿业版《西方经济学》宏观部分——第十七章课后题答案第十七章总需求——总供给模型1、(1)总需求是经济社会对产品和劳务的需求总量,这一需求总量通常以产出水平来表示.一个经济社会的总需求包括消费需求、投资需求、.政府购买和国外需求.总需求量受多种因素的影响,其中价格水平是一个重要的因素.在宏观经济学中,为了说明价格对总需求量的影响,引入了总需求曲线的概念,即总需求量与价格水平之间关系的几何表示.在凯恩斯主义的总需求理论中,总需求曲线的理论来源主要由产品市场均衡理论和货币市场均衡理论来反映.(2)在IS—LM模型中,一般价格水平被假定为一个常数(参数).在价格水平固定不变且货币供给为已知的情况下,IS曲线和LM曲线的交点决定均衡的收入水平.现用图1—62来说明怎样根据IS—LM图形推导总需求曲线.图1—62分上下两部.上图为IS—LM图.下图表示价格水平和需求总量之间的关系,即总需求曲线.当价格P的数值为时,此时的LM曲线与IS曲线相交于点 , 点所表示的国民收入和利率顺次为和 .将和标在下图中便得到总需求曲线上的一点 .现在假设P由下降到 .由于P的下降,LM曲线移动到的位置,它与IS曲线的交点为点. 点所表示的国民收入和利率顺次为和 .对应于上图的点 ,又可在下图中找到 .按照同样的程序,随着P的变化,LM曲线和IS曲线可以有许多交点,每一个交点都代表着一个特定的y和p.于是有许多P与的组合,从而构成了下图中一系列的点.把这些点连在一起所得到的曲线AD便是总需求曲线.从以上关于总需求曲线的推导中看到,总需求曲线表示社会中的需求总量和价格水平之间的相反方向的关系.即总需求曲线是向下方倾斜的.向右下方倾斜的总需求曲线表示,价格水平越高,需求总量越小;价格水平越低,需求总量越大.2、财政政策是政府变动税收和支出,以便影响总需求,进而影响就业和国民收入的政策.货币政策是指货币当局即中央银行通过银行体系变动货币供应量来调节总需求的政策.无论财政政策还是货币政策,都是通过影响利率、消费和投资进而影响总需求,使就业和国民收入得到调节的,通过对总需求的调节来调控宏观经济,所以称为需求管理政策.3、总供给曲线描述国民收入与一般价格水平之间的依存关系.根据生产函数和劳动力市场的均衡推导而得到.资本存量一定时,国民收入水平碎就业量的增加而增加,就业量取决于劳动力市场的均衡.所以总供给曲线的理论来源于生产函数和劳动力市场均衡的理论.4、总供给曲线的理论主要由总量生产函数和劳动力市场理论来反映的.在劳动力市场理论中,经济学家对工资和价格的变化和调整速度的看法是分歧的.古典总供给理论认为,劳动力市场运行没有阻力,在工资和价格可以灵活变动的情况下,劳动力市场得以出清,使经济的就业总能维持充分就业状态,从而在其他因素不变的情况下,经济的产量总能保持在充分就业的产量或潜在产量水平上.因此,在以价格为纵坐标,总产量为横坐标的坐标系中,古典供给曲线是一条位于充分就业产量水平的垂直线.凯恩斯的总供给理论认为,在短期,一些价格是粘性的,从而不能根据需求的变动而调整.由于工资和价格粘性,短期总供给曲线不是垂直的,凯恩斯总供给曲线在以价格为纵坐标,收入为横坐标的坐标系中是一条水平线,表明经济中的厂商在现有价格水平上,愿意供给所需的任何数量的商品.作为凯恩斯总供给曲线基础的思想是,作为工资和价格粘性的结果,劳动力市场不能总维持在充分就业状态,由于存在失业,厂商可以在现行工资下获得所需劳动.因而他们的平均生产成本被认为是不随产出水平变化而变化.一些经济学家认为,古典的和凯恩斯的总供给曲线分别代表着劳动力市场的两种极端的说法.在现实中工资和价格的调整经常介于两者之间.在这种情况下以价格为纵坐标,产量为横坐标的坐标系中,总供给曲线是向右上方延伸的,这即为常规的总需求曲线.总之,针对总量劳动市场关于工资和价格的不同假设,宏观经济学中存在着三种类型的总供给曲线.5、解答:宏观经济学在用总需求—总供给说明经济中的萧条,高涨和滞涨时,主要是通过说明短期的收入和价格水平的决定来完成的.如图1—63所示. 从图1—63可以看到,短期的收入和价格水平的决定有两种情况.第一种情况是,AD是总需求曲线, 使短期供给曲线,总需求曲线和短期供给曲线的交点E决定的产量或收入为y,价格水平为P,二者都处于很低的水平,第一种情况表示经济处于萧条状态.第二种情况是,当总需求增加,总需求曲线从AD向右移动到时,短期总供给曲线和新的总需求曲线的交点决定的产量或收入为 ,价格水平为 ,二者都处于很高的水平,第二种情况表示经济处于高涨状态.现在假定短期供给曲线由于供给冲击(如石油价格和工资等提高)而向左移动,但总需求曲线不发生变化.在这种情况下,短期收入和价格水平的决定可以用图1—64表示.在图1—64中,AD是总需求曲线,是短期总供给曲线,两者的交点E决定的产量或收入为,价格水平为P.现在由于出现供给冲击,短期总供给曲线向左移动到,总需求曲线和新的短期总供给曲线的交点决定的产量或收入为,价格水平为,这个产量低于原来的产量,而价格水平却高于原来的价格水平,这种情况表示经济处于滞涨状态,即经济停滞和通货膨胀结合在一起的状态.6、二者在“形式”上有一定的相似之处.微观经济学的供求模型主要说明单个商品的价格和数量的决定.宏观经济中的AD—AS模型主要说明总体经济的价格水平和国民收入的决定.二者在图形上都用两条曲线来表示,在价格为纵坐标,数量为横坐标的坐标系中,向右下方倾斜的为需求曲线,向右上方延伸的为供给曲线.但二者在内容上有很大的不同:其一,两模型涉及的对象不同.微观经济学的供求模型是微观领域的事物,而宏观经济中的AD—AS模型是宏观领域的事物.其二,各自的理论基础不同.微观经济学中的供求模型中的需求曲线的理论基础是消费者行为理论,而供给曲线的理论基础主要是成本理论和市场理论,它们均属于微观经济学的内容.宏观经济学中的总需求曲线的理论基础主要是产品市场均衡和货币市场均衡理论,而供给曲线的理论基础主要是劳动市场理论和总量生产函数,它们均属于宏观经济学的内容.其三,各自的功能不同.微观经济学中的供求模型在说明商品的价格和数量的决定的同时,还可以来说明需求曲线和供给曲线移动对价格和商品数量的影响,充其量这一模型只解释微观市场的一些现象和结果.宏观经济中的AD—AS模型在说明价格和产出决定的同时,可以用来解释宏观经济的波动现象,还可以用来说明政府运用宏观经济政策干预经济的结果.7、(1)由得;2023 + P = 2400 - P于是 P=200, =2200即得供求均衡点.(2)向左平移10%后的总需求方程为:于是,由有:2023 + P = 2160 – PP=80 , =2080与(1)相比,新的均衡表现出经济处于萧条状态.(3)向右平移10%后的总需求方程为:于是,由有:2023 + P = 2640 – PP=320 , =2320与(1)相比,新的均衡表现出经济处于高涨状态.(4)向左平移10%后的总供给方程为:于是,由有:1800 + P = 2400 – PP=300 , =2100与(1)相比,新的均衡表现出经济处于滞涨状态.(5)总供给曲线向右上方倾斜的直线,属于常规型.宏观经济学课后习题答案(四): 宏观经济学问题题号:11 题型:单选题(请在以下几个选项中选择唯一正确答案)本题分数:5内容:一般把经济周期分为四个阶段,这四个阶段为().选项:a、兴旺,停滞,萧条和复苏b、繁荣,停滞,萧条和恢复c、繁荣,衰退,萧条和复苏d、兴旺,衰退,萧条和恢复题号:12 题型:单选题(请在以下几个选项中选择唯一正确答案)本题分数:5内容:“面粉是中间产品”这一命题()选项:a、一定是对的b、一定是不对的c、可能是对的也可能是不对的d、以上三种说法全对.题号:13 题型:单选题(请在以下几个选项中选择唯一正确答案)本题分数:5内容:下列哪种情况下执行财政政策的效果较好(选项:a、LM陡峭而IS平缓b、LM平缓而IS陡峭c、LM和IS一样平缓d、LM和IS一样陡峭题号:14 题型:单选题(请在以下几个选项中选择唯一正确答案)本题分数:5内容:政府财政政策通过哪一个变量对国民收入产生影响().选项:a、进口b、消费支出c、出口d、政府购买.题号:15 题型:单选题(请在以下几个选项中选择唯一正确答案)本题分数:5内容:在国民收入核算体系中,计入GDP的政府支出是指().选项:a、政府购买物品的支出b、政府购买物品和劳务的支出c、政府购买物品和劳务的支出加上政府的转移支出之和d、政府工作人员的薪金和政府转移支出题号:16 题型:是非题本题分数:5内容:长期总供给曲线所表示的总产出是经济中的潜在产出水平选项:1、错2、对题号:17 题型:是非题本题分数:5内容:GDP中扣除资本折旧,就可以得到NNP选项:1、错2、对题号:18 题型:是非题本题分数:5内容:在长期总供给水平,由于生产要素等得到了充分利用,因此经济中不存在失业选项:1、错2、对题号:19 题型:是非题本题分数:5内容:个人收入即为个人可支配收入,是人们可随意用来消费或储蓄的收入选项:1、错2、对题号:20 题型:是非题本题分数:5内容:GNP折算指数是实际GDP与名义GDP的比率选项:1、错2、对C,C,A,D,B对,对(NNP国民生产净值),错(可能还有摩擦失业),错,错宏观经济学课后习题答案(五): 一道宏观经济学的习题,求答案及解析7、将一国经济中所有市场交易的货币价值进行加总a、会得到生产过程中所使用的全部资源的市场价值b、所获得的数值可能大于、小于或等于GDP的值c、会得到经济中的新增价值总和d、会得到国内生产总值`b 正确市场交易的可能有中间产品,如此中间产品加上最终产品,则重复计算的结果大于GDP;不在国内市场交易,出口销往国外的漏算,则计算结果会小于gdp;如果重复的和漏算的正好相等,则结果可能等于gdp。
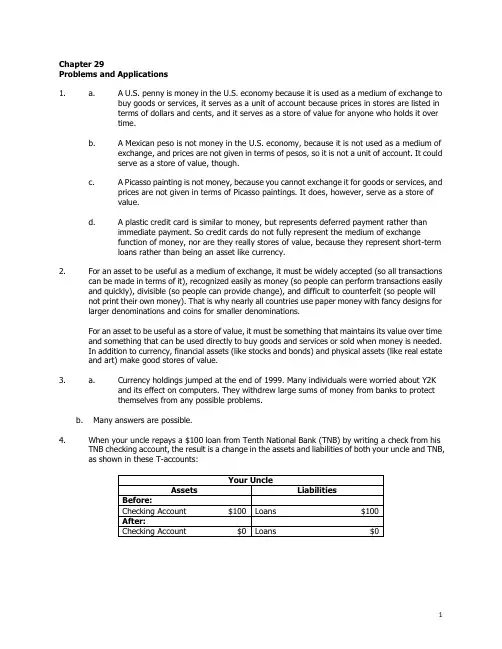
Chapter 29Problems and Applications1. a. A U.S. penny is money in the U.S. economy because it is used as a medium of exchange tobuy goods or services, it serves as a unit of account because prices in stores are listed interms of dollars and cents, and it serves as a store of value for anyone who holds it overtime.b. A Mexican peso is not money in the U.S. economy, because it is not used as a medium ofexchange, and prices are not given in terms of pesos, so it is not a unit of account. It couldserve as a store of value, though.c. A Picasso painting is not money, because you cannot exchange it for goods or services, andprices are not given in terms of Picasso paintings. It does, however, serve as a store ofvalue.d. A plastic credit card is similar to money, but represents deferred payment rather thanimmediate payment. So credit cards do not fully represent the medium of exchangefunction of money, nor are they really stores of value, because they represent short-termloans rather than being an asset like currency.2. For an asset to be useful as a medium of exchange, it must be widely accepted (so all transactionscan be made in terms of it), recognized easily as money (so people can perform transactions easily and quickly), divisible (so people can provide change), and difficult to counterfeit (so people will not print their own money). That is why nearly all countries use paper money with fancy designs for larger denominations and coins for smaller denominations.For an asset to be useful as a store of value, it must be something that maintains its value over time and something that can be used directly to buy goods and services or sold when money is needed.In addition to currency, financial assets (like stocks and bonds) and physical assets (like real estate and art) make good stores of value.3. a. Currency holdings jumped at the end of 1999. Many individuals were worried about Y2Kand its effect on computers. They withdrew large sums of money from banks to protectthemselves from any possible problems.b. Many answers are possible.4. When your uncle repays a $100 loan from Tenth National Bank (TNB) by writing a check from hisTNB checking account, the result is a change in the assets and liabilities of both your uncle and TNB, as shown in these T-accounts:1Chapter 29/The Monetary System 2By paying off the loan, your uncle simply eliminated the outstanding loan using the assets in his checking account. Your uncle's wealth has not changed; he simply has fewer assets and fewerliabilities.5. a. Here is BSB's T-account:b. When BSB's largest depositor withdraws $10 million in cash and BSB reduces its loansoutstanding to maintain the same reserve ratio, its T-account is now:c. Because BSB is cutting back on its loans, other banks will find themselves short of reservesand they may also cut back on their loans as well.d. BSB may find it difficult to cut back on its loans immediately, because it cannot forcepeople to pay off loans. Instead, it can stop making new loans. But for a time it might finditself with more loans than it wants. It could try to attract additional deposits to getadditional reserves, or borrow from another bank or from the Fed.6. If you take $100 that you held as currency and put it into the banking system, then the totalamount of deposits in the banking system increases by $1,000, because a reserve ratio of 10%means the money multiplier is 1/.10 = 10. Thus, the money supply increases by $900, becausedeposits increase by $1,000 but currency declines by $100.7. With a required reserve ratio of 10%, the money multiplier could be as high as 1/.10 = 10, if bankshold no excess reserves and people do not keep some additional currency. So the maximumincrease in the money supply from a $10 million open-market purchase is $100 million. Thesmallest possible increase is $10 million if all of the money is held by banks as excess reserves.8. a. If the required reserve ratio is 5%, then First National Bank's required reserves are$500,000 x .05 = $25,000. Because the bank’s total reserves are $100,000, it has excessreserves of $75,000.b. With a required reserve ratio of 5%, the money multiplier is 1/.05 = 20. If First Nationallends out its excess reserves of $75,000, the money supply will eventually increase by$75,000 x 20 = $1,500,000.Chapter 29/The Monetary System 39. a. With a required reserve ratio of 10% and no excess reserves, the money multiplier is 1/.10= 10. If the Fed sells $1 million of bonds, reserves will decline by $1 million and the moneysupply will contract by 10 x $1 million = $10 million.b. Banks might wish to hold excess reserves if they need to hold the reserves for theirday-to-day operations, such as paying other banks for customers' transactions, makingchange, cashing paychecks, and so on. If banks increase excess reserves such that there isno overall change in the total reserve ratio, then the money multiplier does not change andthere is no effect on the money supply.10. a. With banks holding only required reserves of 10%, the money multiplier is 1/.10 = 10.Because reserves are $100 billion, the money supply is 10 x $100 billion = $1,000 billion.b. If the required reserve ratio is raised to 20%, the money multiplier declines to 1/.20 = 5.With reserves of $100 billion, the money supply would decline to $500 billion, a decline of$500 billion. Reserves would be unchanged.11. a. If people hold all money as currency, the quantity of money is $2,000.b. If people hold all money as demand deposits at banks with 100% reserves, the quantity ofmoney is $2,000.c. If people have $1,000 in currency and $1,000 in demand deposits, the quantity of money is$2,000.d. If banks have a reserve ratio of 10%, the money multiplier is 1/.10 = 10. So if people holdall money as demand deposits, the quantity of money is 10 x $2,000 = $20,000.e. If people hold equal amounts of currency (C) and demand deposits (D) and the moneymultiplier for reserves is 10, then two equations must be satisfied:(1) C = D, so that people have equal amounts of currency and demand deposits; and (2)10 x ($2,000 –C) = D, so that the money multiplier (10) times the number of dollar billsthat are not being held by people ($2,000 –C) equals the amount of demand deposits (D).Using the first equation in the second gives 10 x ($2,000 –D) = D, or $20,000 – 10D = D,or $20,000 = 11 D, so D = $1,818.18. Then C = $1,818.18. The quantity of money is C +D = $3,636.36.。
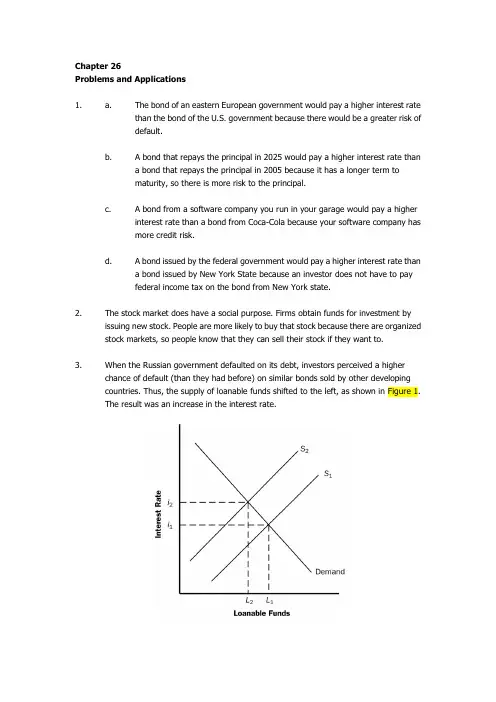
Chapter 26Problems and Applicat ions1. a. The bond of an eastern European government would pay a higher interest ratethan the bond of the U.S. government because there would be a greater risk ofdefault.b. A bond that repays the principal in 2025 would pay a higher interest rate thana bond that repays the principal in 2005 because it has a longer term tomaturity, so there is more risk to the principal.c. A bond from a software compa ny you run in your garage would pay a higherinterest rate than a bond from Coca-Cola because your software company hasmore credit risk.d. A bond issued by the federal government would pay a higher interest rate thana bond issued by New York State because an investor does not have to payfederal income tax on the bond from New York state.2. The stock market does have a social purpose. Firms obtain funds for investment byissuing new stock. People are more likely to buy that stock because there are organized stock markets, so people know that they can sell their stock if they want to.3. When the Russian government defaulted on its debt, investors perceived a higherchance of default (than they had before) on similar bonds sold by other developingcountries. Thus, the supply of loanable funds shifted to the left, as shown in Figure 1.The result was an increase in the interest rate.Figure 14. Companies encourage their employees to hold stock in the company because it givesthe employees the incentive to care about the firm’s profits, not just their own salary.Then, if employees see waste or see areas in which the firm can improve, they will take actions that benefit the company because they know the value of their stock will rise asa result. It also gives employees an additional incentive to work hard, knowing that ifthe firm does well, they will profit.But from an employee’s point of view, owning stock in the company for which she or he works can be risky. The emp loyee’s wages or salary is already tied to how well the firm performs. If the firm has trouble, the employee could be laid off or have her or hissalary reduced. If the employee owns stock in the firm, then there is a doublewhammy−the employee is unemployed or gets a lower salary and the value of thestock falls as well. So owning stock in your own company is a very risky proposition.Most employees would be better off diversifying−owning stock or bonds in othercompanies−so their fortunes would not depend so much on the firm for which theywork.5. To a macroeconomist, saving occurs when a person’s income exceeds his consumption,while investment occurs when a person or firm purchases new capital, such as a house or business equipment.a. When your family takes out a mortgage and buys a new house, that isinvestment because it is a purchase of new capital.b. When you use your $200 paycheck to buy stock in AT&T, that is savingbecause your income of $200 is not being spent on consumption goods.c. When your roommate earns $100 and deposits it in her account at a bank, thatis saving because the money is not spent on consumption goods.d. When you borrow $1,000 from a bank to buy a car to use in your pizza-deliverybusiness, that is investment because the car is a capital good.6. Given that Y = 8, T = 1.5, S priv ate = 0.5 = Y −T − C, S public = 0.2 = T − G.Because S private = Y − T − C, then rearranging gives C = Y − T −S private= 8 − 1.5 − 0.5 = 6.Because S public = T − G, then rearranging gives G = T − S public= 1.5 − 0.2 = 1.3.Because S = national saving = S priv ate + S public = 0.5 + 0.2 = 0.7.Finally, because I = investment = S, I = 0.7.7. a. If interest rates increase, the costs of borrowing money to build the factorybecome higher, so the returns from building the new plant may not besufficient to cover the costs. Thus, higher interest rates make it less likely thatIntel will build the new factory.b. Even if Intel uses its own funds to finance the factory, the rise in interest ratesstill matters. There is an opportunity cost on the use of the funds. Instead ofinvesting in the factory, Intel could invest the money in the bond market toearn the higher interest rate available there. Intel will compare its potentialreturns from building the factory to the potential returns from the bond market.If interest rates rise, so that bond market returns rise, Intel is again less likelyto invest in the factory.Figure 28. a. Figure 2 illustrates the effect of the $20 billion increase in governmentborrowing. Initially, the supply of loanable funds is curve S1, the equilibriumreal interest rate is i1, and the quantity of loanable funds is L1. The increase ingovernment borrowing by $20 billion reduces the supply of loanable funds ateach interest rate by $20 billion, so the new supply curve, S2, is shown by ashift to the left of S1 by exactly $20 billion. As a result of the shift, the newequilibrium real interest rate is i2. The interest rate has increased as a result ofthe increase in government borrowing.b. Because the interest rate has increased, investment and national savingdecline and private saving increases. The increase in government borrowingreduces public saving. From the figure you can see that total loanable funds(and thus both investment and national saving) decline by less than $20 billion,while public saving declines by $20 billion and private saving rises by less than$20 billion.c. The more elastic is the supply of loanable funds, the flatter the supply curvewould be, so the interest rate would rise by less and thus national saving would fall by less, as Figure 3 shows.Figure 3Figure 4d. The more elastic the demand for loanable funds, the flatter the demand curvewould be, so the interest rate would rise by less and thus national saving would fall by more, as Figure 4 shows.e. If households believe that greater government borrowing today implies highertaxes to pay off the government debt in the future, then people will save more so they can pay the higher future taxes. Thus, private saving will increase, aswill the supply of loanable funds. This will offset the reduction in public saving, thus reducing the amount by which the equilibrium quantity of investment andnational saving decline, and reducing the amount that the interest rate rises.If the rise in private saving was exactly equal to the increase in governmentborrowing, there would be no shift in the national saving curve, so investment,national saving, and the interest rate would all be unchanged. This is the caseof Ricardian equivalence.9. Because new computer technology enables firms to reduce inventory investment, thedemand curve for loanable funds shifts to the left, as shown in Figure 5. As a result, the equilibrium quantity of loanable funds declines, as does the interest rate. The decline in the interest rate then increases investment in factories and equipment, but overallinvestment still declines.Figure 510. If world savings declines at the same time world investment rises, the supply curve ofloanable funds shifts to the le ft and the demand curve shifts to the right. Figure 6illustrates the result. The world interest rate will rise, while the overall effect on theequilibrium quantity of loanable funds is ambiguous it depends on the relative sizes of the shifts of the two curves and on their elasticities.Figure 611. a. Investment can be increased by reducing taxes on private saving or byreducing the government budget deficit. But reducing taxes on private savinghas the effect of increasing the government budget deficit, unless some othertaxes are increased or government spending is reduced. So it is difficult toengage in both policies at the same time.b. To know which of these policies would be a more effective way to raiseinvestment, you would need to know: (1) what the elasticity of private savingis with respect to the after-tax real interest rate, because that would determinehow much private saving would increase if you reduced taxes on saving; (2)how private saving responds to changes in the government budget deficit,because, for example, if Ricardian equivalence holds, the decline in thegovernment budget deficit would be matched by an equal decline in privatesaving, so national saving would not increase at all; and (3) how elasticinvestment is with respect to the interest rate, because if investment is quiteinelastic, neither policy will have much of an impact on investment.。
曼昆经济学原理第六版英文答案【篇一:曼昆《经济学原理(微观经济学分册)》第6版课后习题详解(1~2章)】class=txt>课后习题详解第一篇导言第1章经济学十大原理一、概念题1. 稀缺性稀缺性是指在给定的时间内,相对于人的需求而言,经济资源的供给总是不足的,也就是资源的有限性与人类的欲望无限性之间的矛盾。
2. 经济学经济学是研究如何将稀缺的资源有效地配置给相互竞争的用途,以使人类的欲望得到最大限度满足的科学。
其中微观经济学是以单个经济主体为研究对象,研究单个经济主体面对既定资源约束时如何进行选择的科学;宏观经济学则以整个国民经济为研究对象,主要着眼于经济总量的研究。
3. 效率效率是指人们在实践活动中的产出与投入比值或者是效益与成本比值,比值大效率高,比值小效率低。
它与产出或收益大小成正比,与投入或成本成反比。
4. 平等平等是指人与人的利益关系及利益关系的原则、制度、做法、行为等都合乎社会发展的需要,即经济成果在社会成员中公平分配的特性。
它是一个历史范畴,按其所产生的社会历史条件和社会性质的不同而不同,不存在永恒的公平;它也是一个客观范畴,尽管在不同的社会形态中内涵不同对其的理解不同,但都是社会存在的反映,具有客观性。
5. 机会成本机会成本是指将一种资源用于某种用途,而未用于其他用途所放弃的最大预期收益。
其存在的前提条件是:①资源是稀缺的;②资源具有多种用途;③资源的投向不受限制。
6. 理性人理性人是指系统而有目的地尽最大努力去实现其目标的人,是经济研究中所假设的、在一定条件下具有典型理性行为的经济活动主体。
7. 边际变动边际变动是指对行动计划的微小增量调整。
8. 激励激励是指引起一个人做出某种行为的某种东西。
9. 市场经济市场经济是指由家庭和企业在市场上的相互交易决定资源配置的经济,而资源配置实际上就是决定社会生产什么、生产多少、如何生产以及为谁生产的过程。
10. 产权产权是指个人拥有并控制稀缺资源的能力,也可以理解为人们对其所交易东西的所有权,即人们在交易活动中使自己或他人在经济利益上受益或受损的权力。
曼昆宏观经济经济学第九版英文原版答案完整版曼昆宏观经济经济学第九版英文原版答案集团标准化办公室:[VV986T-J682P28-JP266L8-68PNN]A n s w e r s t o T e x t b o o k Q u e s t i o n s a n d P r o b l e m sCHAPTER 7Unemployment and the Labor MarketQuestions for Review1. The rates of job separation and job finding determine the naturalrate of unemployment. The rate of job separation is the fraction of people who lose their job each month. The higher the rate of jobseparation, the higher the natural rate of unemployment. The rate of job finding is the fraction of unemployed people who find a job each month. The higher the rate of job finding, the lower the natural rate of unemployment.2. Frictional unemployment is the unemployment caused by the time ittakes to match workers and jobs. Finding an appropriate job takes time because the flow of information about job candidates and job vacancies is not instantaneous. Because different jobs requiredifferent skills and pay different wages, unemployed workers may not accept the first job offer they receive.In contrast, structural unemployment is the unemployment resulting from wage rigidity and job rationing. These workers are unemployed not because they are actively searching for a job that best suits their skills (as in the case of frictional unemployment), but because at the prevailing real wage thequantity of labor supplied exceeds the quantity of labor demanded. If the wage does not adjust to clear the labor market, then these workers must wait for jobs to become available. Structural unemployment thus arises because firms fail to reduce wages despite an excess supply of labor.3. The real wage may remain above the level that equilibrates laborsupply and labor demand because of minimum wage laws, the monopoly power of unions, and efficiency wages.Minimum-wage laws cause wage rigidity when they prevent wages from falling to equilibrium levels. Although most workers are paid a wage above the minimum level, for some workers, especially the unskilled and inexperienced, the minimum wage raises their wage above theequilibrium level. It therefore reduces the quantity of their labor that firms demand, and creates an excess supply of workers, which increases unemployment.The monopoly power of unions causes wage rigidity because the wages of unionized workers are determined not by the equilibrium of supply and demand but by collective bargaining between union leaders and firm management. The wage agreement often raises the wage abovethe equilibrium level and allows the firm to decide how many workers to employ. These high wages cause firms to hire fewer workers than at the market-clearing wage, so structural unemployment increases.Efficiency-wage theories suggest that high wages make workers more productive. The influence of wages on worker efficiency may explain why firms do not cut wages despite an excess supply of labor. Even though a wage reduction decreasesthe firm’s wage bill, it may also lower worker productivity and therefore the firm’s profits.4. Depending on how one looks at the data, most unemployment can appearto be either short term or long term. Most spells of unemployment are short; that is, most of those who became unemployed find jobs quickly.On the other hand, most weeks of unemployment are attributable to the small number of long-term unemployed. By definition, the long-term unemployed do not find jobs quickly, so they appear on unemployment rolls for many weeks or months.5. Europeans work fewer hours than Americans. One explanation is thatthe higher income tax rates in Europe reduce the incentive to work. A second explanation is a larger underground economy in Europe as aresult of more people attempting to evade the high tax rates.A third explanation is the greater importance of unions in Europe and their ability to bargain for reduced work hours. A final explanation isbased on preferences, whereby Europeans value leisure more thanAmericans do, and therefore elect to work fewer hours.Problems and Applications1. a. In the example that follows, we assume that during the school yearyou look for a part-time job, and that, on average, it takes 2 weeks to find one. We also assume that the typical job lasts 1semester, or 12 weeks.b. If it takes 2 weeks to find a job, then the rate of job finding in weeks isf = (1 job/2 weeks) = 0.5 jobs/week.If the job lasts for 12 weeks, then the rate of job separation in weeks iss = (1 job/12 weeks) = 0.083 jobs/week.c. From the text, we know that the formula for the natural rate of unemployment is(U/L) = [s/(s + f )],where U is the number of people unemployed, and L is the number of people in the labor force.Plugging in the values for f and s that were calculated in part (b), we find(U/L) = [0.083/(0.083 + 0.5)] = 0.14.Thus, if on average it takes 2 weeks to find a job that lasts 12 weeks, the natural rate of unemployment for this population ofcollege students seeking part-time employment is 14 percent.2. Call the number of residents of the dorm who are involved I, thenumber who are uninvolved U, and the total number of students T = I + U. In steady state the total number of involved students is constant.For this to happen we need the number of newly uninvolved students,(0.10)I, to be equal to the number of students who just becameinvolved, (0.05)U. Following a few substitutions:(0.05)U = (0.10)I= (0.10)(T – U),soWe find that two-thirds of the students are uninvolved.3. To show that the unemployment rate evolves over time to thesteady-state rate, let’s begin by defining how the number of people unemployed changes over time. The change in the number of unemployed equals the number of people losing jobs (sE) minus the number finding jobs (fU). In equation form, we can express this as:U–U t= ΔU t + 1 = sE t–fU t.t + 1Recall from the text that L = E t + U t, or E t = L –U t, where L is the total labor force (we will assume that L is constant). Substituting for E t in the above equation, we findΔU t + 1 = s(L –U t) –fU t.Dividing by L, we get an expression for the change in the unemployment rate from t to t + 1:ΔU t + 1/L = (U t + 1/L) –(U t/L) = Δ[U/L]t + 1 = s(1 –U t/L) –fU t/L.Rearranging terms on the right side of the equation above, we end up with line 1 below. Now take line 1 below, multiply the right side by (s + f)/(s + f) and rearrange terms to end up with line 2 below:Δ[U/L]t + 1= s – (s + f)U t/L= (s + f)[s/(s + f) – U/L].tThe first point to note about this equation is that in steady state, when the unemployment rate equals its natural rate, the left-handside of this expression equals zero. This tells us that, as we found in the text, the natural rate of unemployment (U/L)n equals s/(s + f).We can now rewrite the above expression, substituting (U/L)n for s/(s + f), to get an equation that is easier to interpret: Δ[U/L]t + 1 = (s + f)[(U/L)n–U t/L].This expression shows the following:If U t/L > (U/L)n (that is, the unemployment rate is above its natural rate), then Δ[U/L]t + 1 is negative: the unemployment rate falls.If U t/L < (U/L)n (that is, the unemployment rate is below its natural rate), then Δ[U/L]t + 1 is positive: the unemployment raterises.This process continues until the unemployment rate U/L reaches the steady-state rate (U/L)n.4. Consider the formula for the natural rate of unemployment,If the new law lowers the chance of separation s, but has no effect on the rate of job finding f, then the natural rate of unemployment falls.For several reasons, however, the new law might tend to reduce f.First, raising the cost of firing might make firms more careful about hiring workers, since firms have a harder time firing workers who turn out to be a poor match. Second, if job searchers think that the new legislation will lead them to spend a longer period of time on a particular job, then they might weigh morecarefully whether or not to take that job. If the reduction in f is large enough, then the new policy may even increase the natural rate of unemployment.5. a. The demand for labor is determined by the amount of labor that aprofit-maximizing firm wants to hire at a given real wage. The profit-maximizing condition is that the firm hire labor until the marginal product of labor equals the real wage,The marginal product of labor is found by differentiating the production function with respect to labor (see Chapter 3 for more discussion),In order to solve for labor demand, we set the MPL equal to the real wage and solve for L:Notice that this expression has the intuitively desirable feature that increases in the real wage reduce the demand for labor.b. We assume that the 27,000 units of capital and the 1,000 units oflabor are supplied inelastically (i.e., they will work at anyprice). In this case we know that all 1,000 units of labor and 27,000 units of capital will be used in equilibrium, so we can substitute these values into the above labor demand function and.solve for WPIn equilibrium, employment will be 1,000, and multiplying this by10 we find that the workers earn 10,000 units of output. The totaloutput is given by the production function:Y=5Y13Y23Y=5(27,00013)(1,00023)Y=15,000.Notice that workers get two-thirds of output, which is consistent with what we know about the Cobb–Douglas production function from Chapter 3.c. The real wage is now equal to 11 (10% above the equilibrium levelof 10).Firms will use their labor demand function to decide how manyworkers to hire at the given real wage of 11 and capital stock of 27,000:So 751 workers will be hired for a total compensation of 8,261units of output. To find the new level of output, plug the new value for labor and the value for capital into the production function and you will find Y = 12,393.d. The policy redistributes output from the 249 workers who becomeinvoluntarily unemployed to the 751 workers who get paid more than before. The lucky workers benefit less than the losers lose as the total compensation to the working class falls from 10,000 to 8,261 units of output.e. This problem does focus on the analysis of two effects of theminimum-wage laws: they raise the wage for some workers whiledownward-sloping labor demand reduces the total numberof jobs.Note, however, that if labor demand is less elastic than in this example, then the loss of employment may be smaller, and thechange in worker income might be positive.6. a. The labor demand curve is given by the marginal product of laborschedule faced by firms. If a country experiences a reduction inproductivity, then the labor demand curve shifts to the left as in Figure 7-1. If labor becomes less productive, then at any givenreal wage, firms demand less labor.b. If the labor market is always in equilibrium, then, assuming afixed labor supply, an adverse productivity shock causes adecrease in the real wage but has no effect on employment orunemployment, as in Figure 7-2.c. If unions constrain real wages to remain unaltered, then asillustrated in Figure 7-3, employmentfalls to L1 and unemployment equals L –L1.This example shows that the effect of a productivity shock on aneconomy depends on the role of unions and the response of collective bargaining to such a change.7. a. If workers are free to move between sectors, then the wage in each sector will be equal. If thewages were not equal then workers would have an incentive to move to the sector with the higherwage and this would cause the higher wage to fall, and the lower wage to rise until they wereequal.b. Since there are 100 workers in total, L S = 100 – L M. We cansubstitute this expression into the labor demand for services equation, and call the wage w since it is the same in bothsectors:L S = 100 – LM= 100 – 4wLM= 4w.Now set this equal to the labor demand for manufacturing equation and solve for w:4w = 200 – 6ww = $20.Substitute the wage into the two labor demand equations to find L M is 80 and L S is 20.c. If the wage in manufacturing is equal to $25 then L M is equal to 50.d. There are now 50 workers employed in the service sector and the wage w S is equal to $12.50.e. The wage in manufacturing will remain at $25 and employment will remain at 50. If thereservation wage for the service sector is $15 then employment in the service sector will be 40. Therefore, 10 people are unemployed and the unemployment rate is 10 percent.8. Real wages have risen over time in both the United Statesand Europe,increasing the reward for working (the substitution effect) but also making people richer, so they want to “buy” more leisure (theincome effect). If the income effect dominates, then people want to work less as real wages go up. This could explain the Europeanexperience, in which hours worked per employed person have fallen over time. If the income and substitution effects approximatelycancel, then this could explain the U.S. experience, in which hours worked per person have stayed about constant. Economists do not have good theories for why tastes might differ, so they disagree onwhether it is reasonable to think that Europeans have a larger income effect than do Americans.9. The vacant office space problem is similar to the unemploymentproblem; we can apply the same concepts we used in analyzingunemployed labor to analyze why vacant office space exists. There isa rate of office separation: firms that occupy offices leave, eitherto move to different offices or because they go out of business.There is a rate of office finding: firms that need office space (either to start up or expand) find empty offices. It takes time to match firms with available space. Different types of firms require spaces with different attributes depending on what theirspecific needs are. Also, because demand for different goods fluctuates, there are “sectoral shifts”—changes in the composition of demand among industries and regions that affect the profitability and office needs of different firms.。
第一篇导言复习题第一章宏观经济学的科学1、解释宏观经济学和微观经济学之间的差距,这两个领域如何相互关联?【答案】微观经济学研究家庭和企业如何作出决策以及这些决策在市场上的相互作用。
微观经济学的中心原理是家庭和企业的最优化——他们在目的和所面临的约束条件下可以让自己的境况更好。
而相对的,宏观经济学研究经济的整体情况,它主要关心总产出、总就业、一般物价水平和国际贸易等问题,以及这些宏观指标的波动趋势与规律。
应该看到,宏观经济学研究的这些宏观经济变量是以经济体系中千千万万个体家庭和企业之间的相互作用所构成的。
因此,微观经济决策总是构成宏观经济模型的基础,宏观经济学必然依靠微观经济基础。
2、为什么经济学家建立模型?【答案】一般来说,模型是对某些具体事物的抽象,经济模型也是如此。
经济模型可以简洁、直接地描述所要研究的经济对象的各种关系。
这样,经济学家可以依赖模型对特定的经济问题进行研究;并且,由于经济实际不可控,而模型是可控的,经济学家可以根据研究需要,合理、科学的调整模型来研究各种经济情况。
另外,经济模型一般是数学模型,而数学是全世界通用的科学语言,使用规范、标准的经济模型也有利于经济学家正确表达自己的研究意图,便于学术交流。
3、什么是市场出清模型?什么时候市场出清的假设是适用的?【答案】市场出清模型就是供给与需求可以在价格机制调整下很快达到均衡的模型。
市场出清模型的前提条件是价格是具有伸缩性的(或弹性)。
但是,我们知道价格具有伸缩性是一个很强的假设,在很多实际情况下,这个假设都是不现实的。
比如:劳动合同会使劳动力价格在一段时期内具有刚性。
因此,我们必须考虑什么情况下价格具有伸缩性是合适的。
现在一般认为,在研究长期问题时,假设价格具有伸缩性是合理的;而在研究短期问题时,最好假设价格具有刚性。
因为,从长期看,价格机制终将发挥作用,使市场供需平衡,即市场出清,而在短期,价格机制因其他因素制约,难以很快使市场出清。
曼昆经济学原理答案英文版一、选择题1、在经济学中,什么是GDP?A.国内生产总值B.国民生产总值C.国内总收入D.国民总收入答案:A.国内生产总值(Gross Domestic Product,GDP)是指一个国家在一定时期内所有常住单位的生产活动的最终成果。
2、GDP的计算方法是什么?A.收入法B.支出法C.生产法D.混合法答案:B.支出法。
GDP可以通过对一国所有常住单位的商品和服务的最终消费支出、资本形成总额和货物与服务净出口进行计算,这种计算方法被称为支出法。
3、在经济学中,什么是通货膨胀?A.货币贬值B.物价上涨C.货币供应增加D.以上都不是答案:A.通货膨胀是指商品和服务的总体价格水平上升,导致货币购买力下降。
4、什么是货币政策?A.政府调节货币供应量的政策B.政府调节利率的政策C.政府调节汇率的政策D.以上都不是答案:A.货币政策是指中央银行通过控制货币供应量来调节利率和影响经济活动的政策。
二、简答题1、请简述GDP的概念及作用。
答案:GDP是指一个国家在一定时期内所有常住单位的生产活动的最终成果。
GDP是国民经济核算的核心指标,也是衡量一个国家经济状况和发展水平的重要指标。
它反映了整个国家经济运行的有效性,以及国民收入分配的公平性。
2、请简述通货膨胀的原因及影响。
答案:通货膨胀的原因有多种,包括货币供应量增加、需求拉动、成本推动等。
其中,货币供应量增加是最主要的原因。
当货币供应量增加时,物价上涨,导致货币购买力下降。
通货膨胀会对经济产生负面影响,包括降低消费者购买力、增加企业成本、扭曲价格信号等。
通货膨胀还会导致社会不稳定和政治风险。
曼昆的经济学原理课件是经济学教育中的重要资源,它以深入浅出的方式解释了经济学的基本原理和概念。
本文将对这些原理进行概述,并解释它们在现实生活中的应用。
曼昆的经济学原理主要包括微观经济学和宏观经济学两个部分。
微观经济学主要研究个体经济单位的行为和决策,如消费者、企业和政府。
Chapter 25Problems and Applications1. The facts that countries import many goods and services yet must produce a large quantity ofgoods and services themselves to enjoy a high standard of living are reconciled by noting that there are substantial gains from trade. In order to be able to afford to purchase goods from othercountries, an economy must generate income. By producing many goods and services, then trading them for goods and services produced in other countries, a nation maximizes its standard of living.2. a. More investment would lead to faster economic growth in the short run.b. The change would benefit many people in society who would have higher incomes as theresult of faster economic growth. However, there might be a transition period in whichworkers and owners in consumption-good industries would get lower incomes, andworkers and owners in investment-good industries would get higher incomes. In addition,some group would have to reduce their spending for some time so that investment couldrise.3. a. Private consumption spending includes buying food and buying clothes; private investmentspending includes people buying houses and firms buying computers. Many otherexamples are possible. Education can be considered as both consumption and investment.b. Government consumption spending includes paying workers to administer governmentprograms; government investment spending includes buying military equipment andbuilding roads. Many other examples are possible. Government spending on healthprograms is an investment in human capital. This is truer for spending on health programsfor the young rather than those for the elderly.4. The opportunity cost of investing in capital is the loss of consumption that results from redirectingresources toward investment. Over-investment in capital is possible because of diminishingmarginal returns. A country can "over-invest" in capital if people would prefer to have higherconsumption spending and less future growth. The opportunity cost of investing in human capital is also the loss of consumption that is needed to provide the resources for investment. A countrycould "over-invest" in human capital if people were too highly educated for the jobs they couldget for example, if the best job a Ph.D. in philosophy could find is managing a restaurant.5. a. When a German firm opens a factory in South Carolina, it represents foreign directinvestment.b. The investment increases U.S. GDP because it increases production in the United States.The effect on U.S. GNP would be smaller because the owners would get paid a return ontheir investment that would be part of German GNP rather than U.S. GNP.6. a. The United States benefited from the Japanese investment because it made our capitalstock larger, increasing our economic growth.b. It would have been better for the United States to make the investments itself becausethen it would have received the returns on the investment itself, instead of the returnsgoing to Japan.7. Greater educational opportunities for women could lead to faster economic growth in the countriesof South Asia because increased human capital would increase productivity and there would beexternal effects from greater knowledge in the country. Second, increased educational1Chapter 25/Production and Growth 2opportunities for young women may lower the population growth rate because such opportunities raise the opportunity cost of having a child.8. a. Individuals with higher incomes have better access to clean water, medical care, and goodnutrition.b. Healthier individuals are likely to be more productive.c. Understanding the direction of causation will help policymakers place proper emphasis onthe programs that will achieve both greater health and higher incomes.9. a. Political stability could lead to strong economic growth by making the country attractive toinvestors. The increased investment would raise economic growth.b. Strong economic growth could lead to political stability because when people have highincomes they tend to be satisfied with the political system and are less likely to overthrowor change the government.10. a. If output is rising and the number of workers is declining, then output per worker must berising.b. Policymakers should not be concerned as long as output in the manufacturing sector is notdeclining. The reduction in manufacturing jobs will allow labor resources to move to otherindustries, increasing total output in the economy. An increase in productivity of workers(as measured by output per worker) is beneficial to the economy.。