Modeling Based Image Reconstruction in Time-Resolved Contrast-Enhanced Magnetic Resonance A
- 格式:pdf
- 大小:100.26 KB
- 文档页数:7
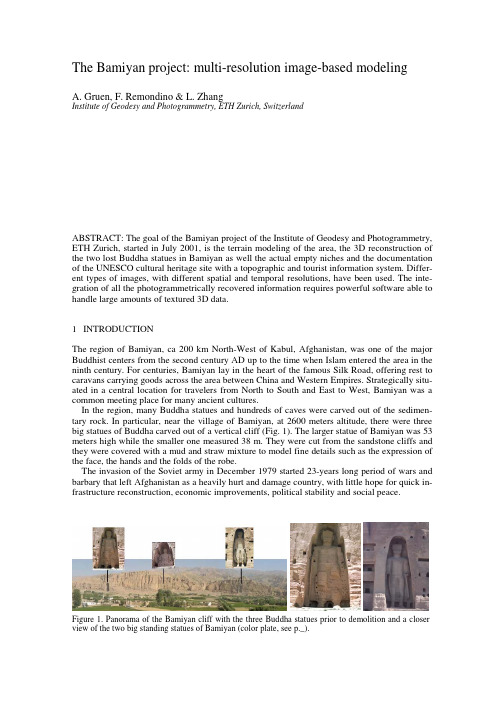
1INTRODUCTIONThe region of Bamiyan, ca 200 km North-West of Kabul, Afghanistan, was one of the major Buddhist centers from the second century AD up to the time when Islam entered the area in the ninth century. For centuries, Bamiyan lay in the heart of the famous Silk Road, offering rest to caravans carrying goods across the area between China and Western Empires. Strategically situ-ated in a central location for travelers from North to South and East to West, Bamiyan was a common meeting place for many ancient cultures.In the region, many Buddha statues and hundreds of caves were carved out of the sedimen-tary rock. In particular, near the village of Bamiyan, at 2600 meters altitude, there were three big statues of Buddha carved out of a vertical cliff (Fig. 1). The larger statue of Bamiyan was 53 meters high while the smaller one measured 38 m. They were cut from the sandstone cliffs and they were covered with a mud and straw mixture to model fine details such as the expression of the face, the hands and the folds of the robe.The invasion of the Soviet army in December 1979 started 23-years long period of wars and barbary that left Afghanistan as a heavily hurt and damage country, with little hope for quick in-frastructure reconstruction, economic improvements, political stability and social peace.Figure 1. Panorama of the Bamiyan cliff with the three Buddha statues prior to demolition and a closer view of the two big standing statues of Bamiyan (color plate, see p._).The Bamiyan project: multi-resolution image-based modelingA. Gruen, F. Remondino & L. ZhangInstitute of Geodesy and Photogrammetry, ETH Zurich, SwitzerlandABSTRACT: The goal of the Bamiyan project of the Institute of Geodesy and Photogrammetry, ETH Zurich, started in July 2001, is the terrain modeling of the area, the 3D reconstruction of the two lost Buddha statues in Bamiyan as well the actual empty niches and the documentation of the UNESCO cultural heritage site with a topographic and tourist information system. Differ-ent types of images, with different spatial and temporal resolutions, have been used. The inte-gration of all the photogrammetrically recovered information requires powerful software able to handle large amounts of textured 3D data.Moreover at the end of the 1990’s the extremist Taleban regime started an internal war against all the non-Islamic symbol. This led in March 2001 to the complete destruction of the two big standing Buddha statues of Bamiyan (Fig. 2), as well as other small statues in Foladi and Kakrak. In 2003, the World Heritage Committee has decided to include the cultural land-scape and archaeological remains of the Bamiyan valley in the UNESCO World Heritage List (/). The area contains numerous Buddhist monastic ensembles and sanctu-aries, as well as fortified edifices from the Islamic period. The site symbolizes the hope of the international community that extreme acts of intolerance, such as the deliberate destruction of the Buddhas, are never repeated again.The whole area is nowadays in a fragile state of conservation as it has suffered from aban-donment, military actions and explosions. The major dangers are the risk of imminent collapse of the Buddha niches with the remaining fragments of the statues, further deterioration of still existing mural paintings in the caves, looting and illicit excavation.The main goals of the Bamiyan project are:-the terrain modeling of the entire Bamiyan area from satellite images for the generation of virtual flights over the UNESCO cultural heritage site;-the modeling of the rock cliff where the Buddha were carved out;-the 3D computer reconstruction of the two lost Buddha statues and the mapping of all the frescos of the niches;-the 3D modeling of the two empty niches where the Buddha statues once stood;-the documentation of the cultural heritage area with a topographic, tourist and cultural in-formation system.The project is an excellent example of image-based modeling, using many types of images, with different spatial and temporal resolution. It shows the capabilities and achievements of the photogrammetric modeling techniques and combines large site landscape modeling with highly detailed modeling of objects (i.e. the statues) by terrestrial images. Automated image-based modeling algorithms have been specifically developed for the modeling of the Great Buddha statue, but, at the end, manual measurements revealed to be the best procedure to recover reli-able and accurate 3D models.Figure 2. The explosion of March 2001 that destroyed the Buddha statues (Image Source: CNN). The two empty niches, where the Buddha once stood, as seen in August 2003 during our field campaign.2TERRAIN MODELING FROM SATELLITE IMAGERYFor the 3D modeling and visualization of the area of interest, an accurate DTM is required. Ae-rial images were not available to us and the idea to acquire them was unrealistic, due to the ab-sence of any surveying company operating in that area. Thus, space-based image acquisition and processing resulted as the only alternative to the aerial photos or any other surveying method. Nowadays space images are competing successfully with traditional aerial photos, for the purpose of DTM generation or terrain study in such problematic countries as the current Af-ghanistan. Also, the availability of high-resolution world-wide scenes taken from satellite plat-forms is constantly increasing. Those scenes are available in different radiometric modes (pan-chromatic, multispectral) and also in stereo mode.For the project, a B/W stereo pair acquired with the HRG sensor carried on SPOT-5 and a PAN Geo level IKONOS image mosaic over the Bamiyan area were available. The SPOT5 im-ages were acquired in across-track direction at 2.5 m ground resolution while the IKONOS im-age has a ground resolution of 1 m.The sensor modeling, DTM/DSM and ortho-image generation were performed with our soft-ware SAT-PP, recently developed for the processing of high-resolution satellite imagery (Zhang & Gruen 2004, Poli et al. 2004, Gruen et al. 2005).The IKONOS mosaic orientation was based on a 2D affine transformation. On the other hand, the SPOT scenes orientation was based on a rational function model. Using the camera model, the calibration data and the ephemeris contained in the metadata file, the software esti-mates the RPC (Rational Polynomial Coefficients) for each image and applies a block adjust-ment in order to remove systematic errors in the sensor external and internal orientation. The scenes' orientation was performed with the help of some GCPs measured with GPS.The DTM was afterwards generated from the oriented SPOT stereo pair using the SAT–PP module for DTM/DSM generation. A 20 m raster DTM for the whole area and 5 m raster DTM for the area covered by the IKONOS image were interpolated from the original matching results (Fig. 3), using also some manually measured breaklines near the Buddha cliff. The matching al-gorithm combines the matching results of feature points, grid points and edges. It is a modified version of MPGC (Multi Photo Geometrically Constrained) matching algorithm (Gruen 1985, Zhang & Gruen 2004) and can achieve sub-pixel accuracy for all the matched features.For the photo-realistic visualization of the whole Bamiyan area, a 2.5 m resolution B/W or-tho-image from SPOT images and a 1 m resolution RGB ortho-image from the IKONOS image were generated. The textured 3D model (rendered with Erdas-Virtual GIS) is shown in Figure 4 where two closer views on the 3D IKONOS textured model of the Bamiyan cliff and the old Bamiyan city (the pyramid-type hill to the left) are presented.Figure 3. The recovered 20 m DTM of the Bamiyan area displayed in color coding mode (left), overlaid by the 5 m DTM (right) (colour plate, see p._).33D MODELING OF THE ROCK CLIFFFor the reconstruction and modeling of the Bamiyan cliff (Fig. 5), a series of terrestrial images acquired with an analogue Rollei 6006 camera was used while ca. 30 control points (measured with a total station) distributed all along the rock cliff were used as reference. The images weredigitized at 20 µm resolution and then oriented with a photogrammetric bundle-adjustment. Then manual measurements were performed on stereo-pairs in order to get all the small details that an automated procedure would smooth out. The recovered point cloud was triangulated, ed-ited and finally textured, as shown in Figure 6.Because of the network configuration and the complex shape of the rock facade, the recov-ered geometric model is not really complete, in particular in the upper part. In some areas it was not possible to find corresponding features, because of occlusions, different lighting conditions and shadows. This is not such a big problem, because the cliff model is not meant to be used alone, but in a next step it will be integrated into the DTM for visualization purposes.Empty niche of the Great BuddhaEmpty niche of the Small Buddha Rock cliff with Buddha nichesThe new BazaarShahr-i-Ghulghulah, the old Bamiyan cityFigure 4. Close view of the Bamiyan terrain model textured with an IKONOS ortho-image.Figure 5. The Bamiyan cliff, approximately 1 km long and 100 m high.Figure 6. Textured 3D model of the Bamiyan cliff, modeled with 30 images. The entire cliff (above) and two closer views of the niches (left: Big Buddha, right: Small Buddha).43D MODELING OF THE GREAT BUDDHA AND ITS ACTUAL EMPTY NICHEThe 3D computer reconstruction of the Great Buddha statue was performed on different image data-sets and using different algorithms (Gruen et al. 2004). Various 3D computer models of different quality, mostly based on automated image measurements were produced. However, in most of the cases, the reconstructed 3D model did not contain essential small features, like the folds of the dress and some important edges of the niche. Therefore, for the generation of a complete and detailed 3D model, manual photogrammetric measurements were indispensable. They were performed along horizontal profiles at 20 cm interval on three metric images, ac-quired in 1970 by Prof. Kostka (Kostka 1974) and scanned at 10 µm resolution.The final 3D model of the Great Buddha (Fig. 7) was used for the generation of different physical models of the Great Buddha. In particular, a 1:25 scale model was generated for the Swiss pavilion of the 2005 EXPO in Aichi, Japan.The modeling of the empty Buddha niches was instead performed using five digital images acquired with a Sony Cybershot F707 during our field campaign in August 2003. The image size is 1920 X 2560 pixels while the pixel size is ca 3.4 µm. After the image orientation, three stereo-models were set up and points were manually measured along horizontal profiles, while the main edges were measured as breaklines. Thus a point cloud of ca 12,000 points was gener-ated. The final textured 3D model is displayed in Figure 7.5MOSAICKING AND MAPPING OF THE FRESCOSThe niches of the Bamiyan Buddha statues were rich with paintings, which have been partly de-stroyed earlier in history and ultimately during the explosions. The best way of proper docu-mentation and visualization of this lost art is the generation of an accurate and photo-realistic image-based 3D model.Figure 7. The 3D textured model of the Great Buddha of Bamiyan and its actual empty niche.In particular, the ceiling part of the Big Buddha niche (approximately 15 m of diameter and 16 m depth) was rich with mural paintings, of many different colors, representing Buddha-like figures, bright-colored persons, ornaments, flowers and hanging curtains. Using available im-ages that tourists acquired in the 60’s and 70’s, we were able to create different mosaics of the paintings and the use them for the photo-realistic texture mapping of the 3D model (Remondino & Niederoest 2004).6INTEGRATION OF MULTI-RESOLUTION IMAGE-BASED DATAIn the last years a big number of sites and objects have been digitally modeled, using different tools, mainly for visualization and documentation. A great force for this trend has been the availability and improvement of image and range sensors, as well as the increasing power of computers for storage, computation and rendering of the digital data.The Bamiyan project is a combination of multi-resolution and multi-temporal photogrammet-ric data, as summarized in Table 1. The geometric resolution of the recovered 3D data spans from 20 m (SPOT5) to 5 cm (Buddha model) while the texture information is between 2.5 m (SPOT5) and 2 mm (fresco) resolution. A factor 400 exists between the different geometry reso-lutions, while there is a factor 1250 in the texture. The whole triangulated surface model covers an area of ca 49 X 38 km and contains approximately 35 millions triangles, while the texture occupies ca 2 GB. The fusion of the multi-resolution (and multi-temporal) data is a very com-plex and critical task. Currently there is no commercial software able to handle all these kinds of data at the same time, mainly for these reasons:-the data is a combination of 2.5 and 3D geometry, limiting the use of packages for geodata visualization, usually very powerful for large site textured terrain models;-the amount of data is too big for graphical rendering and animation packages, generally able to handle textured 3D data.-The high-resolution texture information exceeds the memory capacity of most current graphic cards.Therefore, there is a need for rendering techniques able to maximize the available amount of visible data with an optimal use of the rendering power, while maintaining smooth motion dur-ing the interactive navigations. Towards this goal Borgeat et al. (2003) developed a multi-resolution representation and display method that integrates aspects of edge contraction progres-sive meshes and classical discrete LOD techniques. It aims at multi-resolution rendering with minimal visual artifacts while displaying high-resolution and detailed scenes or 3D objects. Table 1. Multi-resolution data (geometry and images) used in the Bamiyan project.Source of data Year Image resolution(µm)Geometry resolution(m)Texture resolution(m)aIKONOS a2001 - 5 1Rollei b2003 20 1 0.5Sony b2003 4 0.5 0.1[Kostka, 1974] b 1970 10 0.05 0.01Frescos b60’s & 70’s 20 N.A. 0.002a b7TOURIST INFORMATION SYSTEMThe information recovered from the high-resolution satellite imagery is imported in GIS soft-ware (ArcView and ArcGIS) for further analysis, data visualization and topographic information generation.The use of Geographic Information Systems in heritage management has been also under-lined by UNESCO, as a GIS allows: (1) historical and physical site documentation, (2) the as-sessment of physical condition, cultural significance and administrative context, (3) the prepara-tion of conservation and management strategies, (4) the implementation, monitoring and evaluation of management policies (/culture/gis/index.html). Fur-thermore, a GIS tool generates permanent records of heritage sites, including also text documen-tation, virtual flight-overs and 3D models.The Bamiyan valley includes 8 protected locations, identified with an area of interest and a buffer area (/pg.cfm?cid=31&id_site=208). All the areas were mapped and documented within a GIS, together with man-made objects (e.g. streets and buildings) and rivers from IKONOS imagery. A total of 243 objects were extracted and then overlapped onto the re-covered DTM and ortho-image (Fig. 8). Finally, using the contour lines generated from the DTM and the extracted objects, a new plan of the Bamiyan area was also generated, as the pre-vious one was done by the Russian in 70’s.Figure 8. Two views of the 3D model of the Bamiyan area with the extracted rivers and man-made struc-tures (streets, houses and airport) (colour plate, see p. ).8CONCLUSIONSThe reported Bamiyan project is a complete image-based 3D modeling application that com-bines multi-resolution geometry and multi-temporal high-resolution images. The modeling of the whole cultural heritage site of Bamiyan required the use of different types of sensors and produced a detailed terrain model as well as 3D models of other objects. The 3D data is now used for visualization, animation, documentation and for the generation of a cultural and tourist information system.For the photo-realistic rendering and visualization of the generated digital models different commercial packages have been used separately, as the management and visualization of the whole data is still problematic, in particular for real-time rendering.The 3D model of the Great Buddha has been used for the production of a 90 minute movie about “The Giant Buddha”, which is planned to be shown in movie theatres late in 2005. ACKNOWLEDGMENTSThe authors would like to thank Daniela Poli for her help in the satellite image acquisition, CNES for providing the SPOT-5/HRS images (www.spotimage.fr) at special conditions through the ISIS program (http://medias.obs-mip.fr/isis/?choix_lang=English) and Space Imaging () for providing a IKONOS scene for free. We also appreciate the con-tributions of Natalia Vassilieva in terms of doing photogrammetric measurements and the work done with Jana Niederoest for the mosaicking of the frescos.REFERENCESBorgeat, L., Fortin, P.-A. & Godin, G. 2003. A fast hybrid geomorphing LOD scheme. In Proc. of SIG-GRAPH’03, Sketches and Application, San Diego, CA, USA, 27-31 July (on CD-ROM).Gruen, A. 1985. Adaptive Least Squares Correlation: A powerful Image Matching Technique. South Afri-can Journal of Photogrammetry, Remote Sensing and Cartography 14 (3): 175-187.Gruen, A., Remondino, F. & Zhang, L. 2004.Photogrammetric Reconstruction of the Great Buddha of Bamiyan, Afghanistan. The Photogrammetric Record 19(107): 177-199.Gruen, A., Zhang, L. & Eisenbeiss, H. 2005. 3D Precision Processing of High-resolution Satellite Im-agery. In Proc. of ASPRS Annual Meeting, Baltimore, MD, USA, 7-11 March (on CD-ROM). Kostka, R., 1974. Die Stereophotogrammetrische Aufnahme des Grossen Buddha in Bamiyan. Afghani-stan Journal 3(1): 65-74.Poli, D., Zhang, L. & Gruen, A. 2004. SPOT-5/HRS Stereo Images Orientation and Automated DSM Generation. International Archives of Photogrammetry, Remote Sensing and Spatial Information Sci-ences, Vol. 35, Part B1: 421-432.Remondino, F. & Niederoest, J. 2004. Generation of high-resolution Mosaic for photo-realistic texture-mapping of cultural heritage 3D models. In Proc. 5th International Symposium on Virtual Reality, Ar-chaeology and Cultural Heritage (VAST), 85-92, Brussels, Belgium, 6-10 December.Zhang, L. & Gruen, A. 2004. DSM Generation from Linear Array Imagery. International Archives of Photogrammetry, Remote Sensing and Spatial Information Sciences, Vol. 35, Part B3: 128-133.。

前言:最近由于工作的关系,接触到了很多篇以前都没有听说过的经典文章,在感叹这些文章伟大的同时,也顿感自己视野的狭小。
想在网上找找计算机视觉界的经典文章汇总,一直没有找到。
失望之余,我决定自己总结一篇,希望对 CV领域的童鞋们有所帮助。
由于自
己的视野比较狭窄,肯定也有很多疏漏,权当抛砖引玉了
1990年之前
1990年
1991年
1992年
1993年
1994年
1995年
1996年
1997年
1998年
1998年是图像处理和计算机视觉经典文章井喷的一年。
大概从这一年开始,开始有了新的趋势。
由于竞争的加剧,一些好的算法都先发在会议上了,先占个坑,等过一两年之后再扩展到会议上。
1999年
2000年
世纪之交,各种综述都出来了
2001年
2002年
2003年
2004年
2005年
2006年
2007年
2008年
2009年
2010年
2011年
2012年。

DDPM(Diffusion Probabilistic Models)和DDIM(Diffusion Implicit Models)是一种基于扩散过程的概率生成模型,它们在计算机视觉、图像生成和样本自动生成领域取得了许多突破性的成果。
其中,DDPM和DDIM算法的重参数技巧是其关键之一,本文将就DDPM和DDIM算法的重参数技巧进行深入分析和讨论。
一、DDPM和DDIM算法概述1. DDPM算法概述DDPM是一种基于扩散过程的概率生成模型,它通过建模数据的漫步过程来实现对数据分布的建模。
DDPM算法利用了高斯过程的性质,将高斯过程的扩散过程应用到数据生成中,从而实现了对图像数据的生成和重参数化。
DDPM算法的核心思想是将数据视为扩散过程中的粒子,通过模拟这些粒子的运动轨迹来生成图像数据。
通过对扩散过程进行建模和估计,DDPM算法能够有效地捕捉数据的分布特征,从而实现对图像数据的高效生成。
2. DDIM算法概述DDIM是基于扩散过程的隐式生成模型,它利用了扩散过程的性质来建模数据的生成过程。
与DDPM算法不同,DDIM算法通过对潜在空间的建模和估计,从而实现对图像数据的生成和重参数化。
DDIM算法的核心思想是通过对隐变量的建模和边缘化,从而实现对图像数据的生成。
通过对潜在空间的建模和估计,DDIM算法能够有效地捕捉数据的分布特征,从而实现对图像数据的高效生成。
二、DDPM和DDIM算法的重参数技巧1. DDPM算法的重参数技巧DDPM算法的重参数技巧是其关键之一,它通过引入可微分的随机变量来实现对模型的训练和推断。
具体来说,DDPM算法通过引入重参数化技巧,将模型的参数与噪声变量进行耦合,从而实现对模型的训练和推断。
重参数化技巧的核心是将随机变量的采样过程分解为确定性的变换和随机的噪声变量,从而使得采样过程可微分。
通过引入这种可微分的随机变量,DDPM算法能够实现对模型的端到端训练和推断,从而提高了模型的训练效率和推断精度。

电脑的重要性英语作文Title: The Importance of Computers。
In today's digital age, the importance of computers cannot be overstated. From personal use to business operations and scientific research, computers have become an indispensable part of our lives. In this essay, we will explore the multifaceted significance of computers in various aspects of modern society.Firstly, let us consider the realm of education. Computers have revolutionized the way we learn and acquire knowledge. With access to the internet, students can explore vast amounts of information, conduct research, and collaborate with peers from around the world. Educational software and online courses have made learning more engaging and accessible, catering to diverse learning styles and needs. Moreover, interactive multimedia resources enhance understanding and retention of complex concepts. Thus, computers play a pivotal role in moderneducation, empowering learners and educators alike.Moving on to the realm of commerce and industry, computers are the backbone of operations in virtually every sector. From managing inventory and processing transactions to analyzing market trends and communicating with stakeholders, businesses rely on computers for efficiency and competitiveness. Moreover, e-commerce platforms have transformed the way goods and services are bought and sold, expanding market reach and streamlining transactions. Additionally, computer-aided design (CAD) and manufacturing (CAM) technologies have revolutionized product development and production processes, driving innovation and quality improvement. Therefore, computers are indispensable tools for driving economic growth and progress.Furthermore, computers have revolutionized communication and social interaction. With the advent of email, social media, and instant messaging platforms, people can connect and communicate across vast distances instantaneously. Social networking sites have facilitated the formation of virtual communities based on sharedinterests and affiliations, fostering connections and collaborations beyond geographical boundaries. Moreover, video conferencing and online collaboration tools have transformed the way teams work together, enabling remote work and global collaboration. Thus, computers have redefined the dynamics of human interaction, making the world more interconnected than ever before.In the field of healthcare, computers play a crucial role in diagnosis, treatment, and research. Electronic health records (EHRs) streamline patient information management, ensuring continuity of care and facilitating data-driven decision-making. Medical imaging technologies, such as MRI and CT scans, rely on computer algorithms for image reconstruction and analysis, aiding in the detection and diagnosis of diseases. Moreover, computational modeling and simulation techniques enable researchers to study biological processes at the molecular level, leading to breakthroughs in drug discovery and personalized medicine. Therefore, computers are instrumental in advancing healthcare delivery and improving patient outcomes.Lastly, computers have transformed entertainment and leisure activities. From streaming movies and music to playing video games and engaging in virtual reality experiences, computers provide endless entertainment options for people of all ages. Moreover, digitalcreativity tools empower individuals to express themselves through art, music, and multimedia projects, fostering creativity and self-expression. Additionally, online gaming communities and virtual worlds offer opportunities for socializing and collaboration in immersive digital environments. Thus, computers enrich our lives by providing avenues for relaxation, entertainment, and creative expression.In conclusion, the importance of computers in modern society cannot be overstated. From education and commerce to communication and healthcare, computers play a pivotal role in driving progress and innovation across various domains. As we continue to embrace technological advancements, it is essential to harness the power of computers responsibly and ethically for the betterment of humanity.。
Int J Comput VisDOI10.1007/s11263-007-0107-3Modeling the World from Internet Photo Collections Noah Snavely·Steven M.Seitz·Richard SzeliskiReceived:30January2007/Accepted:31October2007©Springer Science+Business Media,LLC2007Abstract There are billions of photographs on the Inter-net,comprising the largest and most diverse photo collec-tion ever assembled.How can computer vision researchers exploit this imagery?This paper explores this question from the standpoint of3D scene modeling and visualization.We present structure-from-motion and image-based rendering algorithms that operate on hundreds of images downloaded as a result of keyword-based image search queries like “Notre Dame”or“Trevi Fountain.”This approach,which we call Photo Tourism,has enabled reconstructions of nu-merous well-known world sites.This paper presents these algorithms and results as afirst step towards3D modeling of the world’s well-photographed sites,cities,and landscapes from Internet imagery,and discusses key open problems and challenges for the research community.Keywords Structure from motion·3D scene analysis·Internet imagery·Photo browsers·3D navigation1IntroductionMost of the world’s significant sites have been photographed under many different conditions,both from the ground and from the air.For example,a Google image search for“Notre Dame”returns over one million hits(as of September, 2007),showing the cathedral from almost every conceivable viewing position and angle,different times of day and night, N.Snavely( )·S.M.SeitzUniversity of Washington,Seattle,WA,USAe-mail:snavely@R.SzeliskiMicrosoft Research,Redmond,WA,USA and changes in season,weather,and decade.Furthermore, entire cities are now being captured at street level and from a birds-eye perspective(e.g.,Windows Live Local,1,2and Google Streetview3),and from satellite or aerial views(e.g., Google4).The availability of such rich imagery of large parts of the earth’s surface under many different viewing conditions presents enormous opportunities,both in computer vision research and for practical applications.From the standpoint of shape modeling research,Internet imagery presents the ultimate data set,which should enable modeling a signifi-cant portion of the world’s surface geometry at high resolu-tion.As the largest,most diverse set of images ever assem-bled,Internet imagery provides deep insights into the space of natural images and a rich source of statistics and priors for modeling scene appearance.Furthermore,Internet imagery provides an ideal test bed for developing robust and gen-eral computer vision algorithms that can work effectively “in the wild.”In turn,algorithms that operate effectively on such imagery will enable a host of important applications, ranging from3D visualization,localization,communication (media sharing),and recognition,that go well beyond tradi-tional computer vision problems and can have broad impacts for the population at large.To date,this imagery is almost completely untapped and unexploited by computer vision researchers.A major rea-son is that the imagery is not in a form that is amenable to processing,at least by traditional methods:the images are 1Windows Live Local,.2Windows Live Local—Virtual Earth Technology Preview,http:// .3Google Maps,.4Google Maps,.Int J Comput Visunorganized,uncalibrated,with widely variable and uncon-trolled illumination,resolution,and image quality.Develop-ing computer vision techniques that can operate effectively with such imagery has been a major challenge for the re-search community.Within this scope,one key challenge is registration,i.e.,figuring out correspondences between im-ages,and how they relate to one another in a common3D coordinate system(structure from motion).While a lot of progress has been made in these areas in the last two decades (Sect.2),many challenging open problems remain.In this paper we focus on the problem of geometrically registering Internet imagery and a number of applications that this enables.As such,wefirst review the state of the art and then present somefirst steps towards solving this problem along with a visualization front-end that we call Photo Tourism(Snavely et al.2006).We then present a set of open research problems for thefield,including the cre-ation of more efficient correspondence and reconstruction techniques for extremely large image data sets.This paper expands on the work originally presented in(Snavely et al. 2006)with many new reconstructions and visualizations of algorithm behavior across datasets,as well as a brief dis-cussion of Photosynth,a Technology Preview by Microsoft Live Labs,based largely on(Snavely et al.2006).We also present a more complete related work section and add a broad discussion of open research challenges for thefield. Videos of our system,along with additional supplementary material,can be found on our Photo Tourism project Web site,.2Previous WorkThe last two decades have seen a dramatic increase in the capabilities of3D computer vision algorithms.These in-clude advances in feature correspondence,structure from motion,and image-based modeling.Concurrently,image-based rendering techniques have been developed in the com-puter graphics community,and image browsing techniques have been developed for multimedia applications.2.1Feature CorrespondenceTwenty years ago,the foundations of modern feature detec-tion and matching techniques were being laid.Lucas and Kanade(1981)had developed a patch tracker based on two-dimensional image statistics,while Moravec(1983)intro-duced the concept of“corner-like”feature points.Först-ner(1986)and then Harris and Stephens(1988)both pro-posedfinding keypoints using measures based on eigenval-ues of smoothed outer products of gradients,which are still widely used today.While these early techniques detected keypoints at a single scale,modern techniques use a quasi-continuous sampling of scale space to detect points invari-ant to changes in scale and orientation(Lowe2004;Mikola-jczyk and Schmid2004)and somewhat invariant to affine transformations(Baumberg2000;Kadir and Brady2001; Schaffalitzky and Zisserman2002;Mikolajczyk et al.2005).Unfortunately,early techniques relied on matching patches around the detected keypoints,which limited their range of applicability to scenes seen from similar view-points,e.g.,for aerial photogrammetry applications(Hannah 1988).If features are being tracked from frame to frame,an affine extension of the basic Lucas-Kanade tracker has been shown to perform well(Shi and Tomasi1994).However,for true wide baseline matching,i.e.,the automatic matching of images taken from widely different views(Baumberg2000; Schaffalitzky and Zisserman2002;Strecha et al.2003; Tuytelaars and Van Gool2004;Matas et al.2004),(weakly) affine-invariant feature descriptors must be used.Mikolajczyk et al.(2005)review some recently devel-oped view-invariant local image descriptors and experimen-tally compare their performance.In our own Photo Tourism research,we have been using Lowe’s Scale Invariant Fea-ture Transform(SIFT)(Lowe2004),which is widely used by others and is known to perform well over a reasonable range of viewpoint variation.2.2Structure from MotionThe late1980s also saw the development of effective struc-ture from motion techniques,which aim to simultaneously reconstruct the unknown3D scene structure and camera positions and orientations from a set of feature correspon-dences.While Longuet-Higgins(1981)introduced a still widely used two-frame relative orientation technique in 1981,the development of multi-frame structure from mo-tion techniques,including factorization methods(Tomasi and Kanade1992)and global optimization techniques(Spet-sakis and Aloimonos1991;Szeliski and Kang1994;Olien-sis1999)occurred quite a bit later.More recently,related techniques from photogrammetry such as bundle adjustment(Triggs et al.1999)(with related sparse matrix techniques,Szeliski and Kang1994)have made their way into computer vision and are now regarded as the gold standard for performing optimal3D reconstruc-tion from correspondences(Hartley and Zisserman2004).For situations where the camera calibration parameters are unknown,self-calibration techniques,whichfirst esti-mate a projective reconstruction of the3D world and then perform a metric upgrade have proven to be successful (Pollefeys et al.1999;Pollefeys and Van Gool2002).In our own work(Sect.4.2),we have found that the simpler approach of simply estimating each camera’s focal length as part of the bundle adjustment process seems to produce good results.Int J Comput VisThe SfM approach used in this paper is similar to that of Brown and Lowe(2005),with several modifications to improve robustness over a variety of data sets.These in-clude initializing new cameras using pose estimation,to help avoid local minima;a different heuristic for selecting the initial two images for SfM;checking that reconstructed points are well-conditioned before adding them to the scene; and using focal length information from image EXIF tags. Schaffalitzky and Zisserman(2002)present another related technique for reconstructing unordered image sets,concen-trating on efficiently matching interest points between im-ages.Vergauwen and Van Gool have developed a similar approach(Vergauwen and Van Gool2006)and are hosting a web-based reconstruction service for use in cultural heritage applications5.Fitzgibbon and Zisserman(1998)and Nistér (2000)prefer a bottom-up approach,where small subsets of images are matched to each other and then merged in an agglomerative fashion into a complete3D reconstruction. While all of these approaches address the same SfM prob-lem that we do,they were tested on much simpler datasets with more limited variation in imaging conditions.Our pa-per marks thefirst successful demonstration of SfM tech-niques applied to the kinds of real-world image sets found on Google and Flickr.For instance,our typical image set has photos from hundreds of different cameras,zoom levels, resolutions,different times of day or seasons,illumination, weather,and differing amounts of occlusion.2.3Image-Based ModelingIn recent years,computer vision techniques such as structure from motion and model-based reconstruction have gained traction in the computer graphicsfield under the name of image-based modeling.IBM is the process of creating three-dimensional models from a collection of input images(De-bevec et al.1996;Grzeszczuk2002;Pollefeys et al.2004).One particular application of IBM has been the cre-ation of large scale architectural models.Notable exam-ples include the semi-automatic Façade system(Debevec et al.1996),which was used to reconstruct compellingfly-throughs of the University of California Berkeley campus; automatic architecture reconstruction systems such as that of Dick et al.(2004);and the MIT City Scanning Project (Teller et al.2003),which captured thousands of calibrated images from an instrumented rig to construct a3D model of the MIT campus.There are also several ongoing academic and commercial projects focused on large-scale urban scene reconstruction.These efforts include the4D Cities project (Schindler et al.2007),which aims to create a spatial-temporal model of Atlanta from historical photographs;the 5Epoch3D Webservice,http://homes.esat.kuleuven.be/~visit3d/ webservice/html/.Stanford CityBlock Project(Román et al.2004),which uses video of city blocks to create multi-perspective strip images; and the UrbanScape project of Akbarzadeh et al.(2006). Our work differs from these previous approaches in that we only reconstruct a sparse3D model of the world,since our emphasis is more on creating smooth3D transitions be-tween photographs rather than interactively visualizing a3D world.2.4Image-Based RenderingThefield of image-based rendering(IBR)is devoted to the problem of synthesizing new views of a scene from a set of input photographs.A forerunner to thisfield was the groundbreaking Aspen MovieMap project(Lippman1980), in which thousands of images of Aspen Colorado were cap-tured from a moving car,registered to a street map of the city,and stored on laserdisc.A user interface enabled in-teractively moving through the images as a function of the desired path of the user.Additional features included a navi-gation map of the city overlaid on the image display,and the ability to touch any building in the currentfield of view and jump to a facade of that building.The system also allowed attaching metadata such as restaurant menus and historical images with individual buildings.Recently,several compa-nies,such as Google6and EveryScape7have begun creating similar“surrogate travel”applications that can be viewed in a web browser.Our work can be seen as a way to automati-cally create MovieMaps from unorganized collections of im-ages.(In contrast,the Aspen MovieMap involved a team of over a dozen people working over a few years.)A number of our visualization,navigation,and annotation capabilities are similar to those in the original MovieMap work,but in an improved and generalized form.More recent work in IBR has focused on techniques for new view synthesis,e.g.,(Chen and Williams1993; McMillan and Bishop1995;Gortler et al.1996;Levoy and Hanrahan1996;Seitz and Dyer1996;Aliaga et al.2003; Zitnick et al.2004;Buehler et al.2001).In terms of appli-cations,Aliaga et al.’s(2003)Sea of Images work is perhaps closest to ours in its use of a large collection of images taken throughout an architectural space;the same authors address the problem of computing consistent feature matches across multiple images for the purposes of IBR(Aliaga et al.2003). However,our images are casually acquired by different pho-tographers,rather than being taken on afixed grid with a guided robot.In contrast to most prior work in IBR,our objective is not to synthesize a photo-realistic view of the world from all viewpoints per se,but to browse a specific collection of 6Google Maps,.7Everyscape,.Int J Comput Visphotographs in a3D spatial context that gives a sense of the geometry of the underlying scene.Our approach there-fore uses an approximate plane-based view interpolation method and a non-photorealistic rendering of background scene structures.As such,we side-step the more challenging problems of reconstructing full surface models(Debevec et al.1996;Teller et al.2003),lightfields(Gortler et al.1996; Levoy and Hanrahan1996),or pixel-accurate view inter-polations(Chen and Williams1993;McMillan and Bishop 1995;Seitz and Dyer1996;Zitnick et al.2004).The bene-fit of doing this is that we are able to operate robustly with input imagery that is beyond the scope of previous IBM and IBR techniques.2.5Image Browsing,Retrieval,and AnnotationThere are many techniques and commercial products for browsing sets of photos and much research on the subject of how people tend to organize photos,e.g.,(Rodden and Wood2003).Many of these techniques use metadata,such as keywords,photographer,or time,as a basis of photo or-ganization(Cooper et al.2003).There has recently been growing interest in using geo-location information to facilitate photo browsing.In particu-lar,the World-Wide Media Exchange(WWMX)(Toyama et al.2003)arranges images on an interactive2D map.Photo-Compas(Naaman et al.2004)clusters images based on time and location.Realityflythrough(McCurdy and Griswold 2005)uses interface ideas similar to ours for exploring video from camcorders instrumented with GPS and tilt sensors, and Kadobayashi and Tanaka(2005)present an interface for retrieving images using proximity to a virtual camera.In Photowalker(Tanaka et al.2002),a user can manually au-thor a walkthrough of a scene by specifying transitions be-tween pairs of images in a collection.In these systems,loca-tion is obtained from GPS or is manually specified.Because our approach does not require GPS or other instrumentation, it has the advantage of being applicable to existing image databases and photographs from the Internet.Furthermore, many of the navigation features of our approach exploit the computation of image feature correspondences and sparse 3D geometry,and therefore go beyond what has been possi-ble in these previous location-based systems.Many techniques also exist for the related task of retriev-ing images from a database.One particular system related to our work is Video Google(Sivic and Zisserman2003)(not to be confused with Google’s own video search),which al-lows a user to select a query object in one frame of video and efficientlyfind that object in other frames.Our object-based navigation mode uses a similar idea,but extended to the3D domain.A number of researchers have studied techniques for au-tomatic and semi-automatic image annotation,and annota-tion transfer in particular.The LOCALE system(Naaman et al.2003)uses proximity to transfer labels between geo-referenced photographs.An advantage of the annotation ca-pabilities of our system is that our feature correspondences enable transfer at muchfiner granularity;we can transfer annotations of specific objects and regions between images, taking into account occlusions and the motions of these ob-jects under changes in viewpoint.This goal is similar to that of augmented reality(AR)approaches(e.g.,Feiner et al. 1997),which also seek to annotate images.While most AR methods register a3D computer-generated model to an im-age,we instead transfer2D image annotations to other im-ages.Generating annotation content is therefore much eas-ier.(We can,in fact,import existing annotations from pop-ular services like Flickr.)Annotation transfer has been also explored for video sequences(Irani and Anandan1998).Finally,Johansson and Cipolla(2002)have developed a system where a user can take a photograph,upload it to a server where it is compared to an image database,and re-ceive location information.Our system also supports this application in addition to many other capabilities(visual-ization,navigation,annotation,etc.).3OverviewOur objective is to geometrically register large photo col-lections from the Internet and other sources,and to use the resulting3D camera and scene information to facili-tate a number of applications in visualization,localization, image browsing,and other areas.This section provides an overview of our approach and summarizes the rest of the paper.The primary technical challenge is to robustly match and reconstruct3D information from hundreds or thousands of images that exhibit large variations in viewpoint,illumina-tion,weather conditions,resolution,etc.,and may contain significant clutter and outliers.This kind of variation is what makes Internet imagery(i.e.,images returned by Internet image search queries from sites such as Flickr and Google) so challenging to work with.In tackling this problem,we take advantage of two recent breakthroughs in computer vision,namely feature-matching and structure from motion,as reviewed in Sect.2.The back-bone of our work is a robust SfM approach that reconstructs 3D camera positions and sparse point geometry for large datasets and has yielded reconstructions for dozens of fa-mous sites ranging from Notre Dame Cathedral to the Great Wall of China.Section4describes this approach in detail, as well as methods for aligning reconstructions to satellite and map data to obtain geo-referenced camera positions and geometry.One of the most exciting applications for these recon-structions is3D scene visualization.However,the sparseInt J Comput Vispoints produced by SfM methods are by themselves very limited and do not directly produce compelling scene ren-derings.Nevertheless,we demonstrate that this sparse SfM-derived geometry and camera information,along with mor-phing and non-photorealistic rendering techniques,is suffi-cient to provide compelling view interpolations as described in5.Leveraging this capability,Section6describes a novel photo explorer interface for browsing large collections of photographs in which the user can virtually explore the3D space by moving from one image to another.Often,we are interested in learning more about the con-tent of an image,e.g.,“which statue is this?”or“when was this building constructed?”A great deal of annotated image content of this form already exists in guidebooks,maps,and Internet resources such as Wikipedia8and Flickr.However, the image you may be viewing at any particular time(e.g., from your cell phone camera)may not have such annota-tions.A key feature of our system is the ability to transfer annotations automatically between images,so that informa-tion about an object in one image is propagated to all other images that contain the same object(Sect.7).Section8presents extensive results on11scenes,with visualizations and an analysis of the matching and recon-struction results for these scenes.We also briefly describe Photosynth,a related3D image browsing tool developed by Microsoft Live Labs that is based on techniques from this paper,but also adds a number of interesting new elements. Finally,we conclude with a set of research challenges for the community in Sect.9.4Reconstructing Cameras and Sparse GeometryThe visualization and browsing components of our system require accurate information about the relative location,ori-entation,and intrinsic parameters such as focal lengths for each photograph in a collection,as well as sparse3D scene geometry.A few features of our system require the absolute locations of the cameras,in a geo-referenced coordinate frame.Some of this information can be provided with GPS devices and electronic compasses,but the vast majority of existing photographs lack such information.Many digital cameras embed focal length and other information in the EXIF tags of imagefiles.These values are useful for ini-tialization,but are sometimes inaccurate.In our system,we do not rely on the camera or any other piece of equipment to provide us with location,orientation, or geometry.Instead,we compute this information from the images themselves using computer vision techniques.We first detect feature points in each image,then match feature points between pairs of images,andfinally run an iterative, 8Wikipedia,.robust SfM procedure to recover the camera parameters.Be-cause SfM only estimates the relative position of each cam-era,and we are also interested in absolute coordinates(e.g., latitude and longitude),we use an interactive technique to register the recovered cameras to an overhead map.Each of these steps is described in the following subsections.4.1Keypoint Detection and MatchingThefirst step is tofind feature points in each image.We use the SIFT keypoint detector(Lowe2004),because of its good invariance to image transformations.Other feature de-tectors could also potentially be used;several detectors are compared in the work of Mikolajczyk et al.(2005).In addi-tion to the keypoint locations themselves,SIFT provides a local descriptor for each keypoint.A typical image contains several thousand SIFT keypoints.Next,for each pair of images,we match keypoint descrip-tors between the pair,using the approximate nearest neigh-bors(ANN)kd-tree package of Arya et al.(1998).To match keypoints between two images I and J,we create a kd-tree from the feature descriptors in J,then,for each feature in I wefind the nearest neighbor in J using the kd-tree.For efficiency,we use ANN’s priority search algorithm,limiting each query to visit a maximum of200bins in the tree.Rather than classifying false matches by thresholding the distance to the nearest neighbor,we use the ratio test described by Lowe(2004):for a feature descriptor in I,wefind the two nearest neighbors in J,with distances d1and d2,then accept the match if d1d2<0.6.If more than one feature in I matches the same feature in J,we remove all of these matches,as some of them must be spurious.After matching features for an image pair(I,J),we robustly estimate a fundamental matrix for the pair us-ing RANSAC(Fischler and Bolles1981).During each RANSAC iteration,we compute a candidate fundamental matrix using the eight-point algorithm(Hartley and Zis-serman2004),normalizing the problem to improve robust-ness to noise(Hartley1997).We set the RANSAC outlier threshold to be0.6%of the maximum image dimension,i.e., 0.006max(image width,image height)(about six pixels for a1024×768image).The F-matrix returned by RANSAC is refined by running the Levenberg-Marquardt algorithm(No-cedal and Wright1999)on the eight parameters of the F-matrix,minimizing errors for all the inliers to the F-matrix. Finally,we remove matches that are outliers to the recov-ered F-matrix using the above threshold.If the number of remaining matches is less than twenty,we remove all of the matches from consideration.Afterfinding a set of geometrically consistent matches between each image pair,we organize the matches into tracks,where a track is a connected set of matching key-points across multiple images.If a track contains more thanInt J Comput VisFig.1Photo connectivity graph.This graph contains a node for each image in a set of photos of the Trevi Fountain, with an edge between each pair of photos with matching features.The size of a node is proportional to its degree.There are two dominant clusters corresponding to day(a)and night time(d)photos.Similar views of the facade cluster together in the center,while nodes in the periphery,e.g.,(b) and(c),are more unusual(often close-up)viewsone keypoint in the same image,it is deemed inconsistent. We keep consistent tracks containing at least two keypoints for the next phase of the reconstruction procedure.Once correspondences are found,we can construct an im-age connectivity graph,in which each image is a node and an edge exists between any pair of images with matching features.A visualization of an example connectivity graph for the Trevi Fountain is Fig.1.This graph embedding was created with the neato tool in the Graphviz toolkit.9Neato represents the graph as a mass-spring system and solves for an embedding whose energy is a local minimum.The image connectivity graph of this photo set has sev-eral distinct features.The large,dense cluster in the cen-ter of the graph consists of photos that are all fairly wide-angle,frontal,well-lit shots of the fountain(e.g.,image(a)). Other images,including the“leaf”nodes(e.g.,images(b) and(c))and night time images(e.g.,image(d)),are more loosely connected to this core set.Other connectivity graphs are shown in Figs.9and10.4.2Structure from MotionNext,we recover a set of camera parameters(e.g.,rotation, translation,and focal length)for each image and a3D lo-cation for each track.The recovered parameters should be consistent,in that the reprojection error,i.e.,the sum of dis-tances between the projections of each track and its corre-sponding image features,is minimized.This minimization problem can formulated as a non-linear least squares prob-lem(see Appendix1)and solved using bundle adjustment. Algorithms for solving this non-linear problem,such as No-cedal and Wright(1999),are only guaranteed tofind lo-cal minima,and large-scale SfM problems are particularly prone to getting stuck in bad local minima,so it is important 9Graphviz—graph visualization software,/.to provide good initial estimates of the parameters.Rather than estimating the parameters for all cameras and tracks at once,we take an incremental approach,adding in one cam-era at a time.We begin by estimating the parameters of a single pair of cameras.This initial pair should have a large number of matches,but also have a large baseline,so that the ini-tial two-frame reconstruction can be robustly estimated.We therefore choose the pair of images that has the largest num-ber of matches,subject to the condition that those matches cannot be well-modeled by a single homography,to avoid degenerate cases such as coincident cameras.In particular, wefind a homography between each pair of matching im-ages using RANSAC with an outlier threshold of0.4%of max(image width,image height),and store the percentage of feature matches that are inliers to the estimated homogra-phy.We select the initial image pair as that with the lowest percentage of inliers to the recovered homography,but with at least100matches.The camera parameters for this pair are estimated using Nistér’s implementation of thefive point al-gorithm(Nistér2004),10then the tracks visible in the two images are triangulated.Finally,we do a two frame bundle adjustment starting from this initialization.Next,we add another camera to the optimization.We select the camera that observes the largest number of tracks whose3D locations have already been estimated, and initialize the new camera’s extrinsic parameters using the direct linear transform(DLT)technique(Hartley and Zisserman2004)inside a RANSAC procedure.For this RANSAC step,we use an outlier threshold of0.4%of max(image width,image height).In addition to providing an estimate of the camera rotation and translation,the DLT technique returns an upper-triangular matrix K which can 10We only choose the initial pair among pairs for which a focal length estimate is available for both cameras,and therefore a calibrated rela-tive pose algorithm can be used.。
2021⁃04⁃10计算机应用,Journal of Computer Applications2021,41(4):1142-1147ISSN 1001⁃9081CODEN JYIIDU http ://基于多通道图像深度学习的恶意代码检测蒋考林,白玮,张磊,陈军,潘志松*,郭世泽(陆军工程大学指挥控制工程学院,南京210007)(∗通信作者电子邮箱hotpzs@ )摘要:现有基于深度学习的恶意代码检测方法存在深层次特征提取能力偏弱、模型相对复杂、模型泛化能力不足等问题。
同时,代码复用现象在同一类恶意样本中大量存在,而代码复用会导致代码的视觉特征相似,这种相似性可以被用来进行恶意代码检测。
因此,提出一种基于多通道图像视觉特征和AlexNet 神经网络的恶意代码检测方法。
该方法首先将待检测的代码转化为多通道图像,然后利用AlexNet 神经网络提取其彩色纹理特征并对这些特征进行分类从而检测出可能的恶意代码;同时通过综合运用多通道图像特征提取、局部响应归一化(LRN )等技术,在有效降低模型复杂度的基础上提升了模型的泛化能力。
利用均衡处理后的Malimg 数据集进行测试,结果显示该方法的平均分类准确率达到97.8%;相较于VGGNet 方法在准确率上提升了1.8%,在检测效率上提升了60.2%。
实验结果表明,多通道图像彩色纹理特征能较好地反映恶意代码的类别信息,AlexNet 神经网络相对简单的结构能有效地提升检测效率,而局部响应归一化能提升模型的泛化能力与检测效果。
关键词:多通道图像;彩色纹理特征;恶意代码;深度学习;局部响应归一化中图分类号:TP309文献标志码:AMalicious code detection based on multi -channel image deep learningJIANG Kaolin ,BAI Wei ,ZHANG Lei ,CHEN Jun ,PAN Zhisong *,GUO Shize(Command and Control Engineering College ,Army Engineering University Nanjing Jiangsu 210007,China )Abstract:Existing deep learning -based malicious code detection methods have problems such as weak deep -level feature extraction capability ,relatively complex model and insufficient model generalization capability.At the same time ,code reuse phenomenon occurred in large number of malicious samples of the same type ,resulting in similar visual features of the code.This similarity can be used for malicious code detection.Therefore ,a malicious code detection method based on multi -channel image visual features and AlexNet was proposed.In the method ,the codes to be detected were converted into multi -channel images at first.After that ,AlexNet was used to extract and classify the color texture features of the images ,so as to detect the possible malicious codes.Meanwhile ,the multi -channel image feature extraction ,the Local Response Normalization (LRN )and other technologies were used comprehensively ,which effectively improved the generalization ability of the model with effective reduction of the complexity of the model.The Malimg dataset after equalization was used for testing ,the results showed that the average classification accuracy of the proposed method was 97.8%,and the method had the accuracy increased by 1.8%and the detection efficiency increased by 60.2%compared with the VGGNet method.Experimental results show that the color texture features of multi -channel images can better reflect the type information of malicious codes ,the simple network structure of AlexNet can effectively improve the detection efficiency ,and the local response normalization can improve the generalization ability and detection effect of the model.Key words:multi -channel image;color texture feature;malicious code;deep learning;Local Response Normalization (LRN)引言恶意代码已经成为网络空间的主要威胁来源之一。
Image-based Fac ¸ade ModelingJianxiong XiaoTian FangPing Tan ∗Peng ZhaoEyal Ofek †Long QuanThe Hong Kong University of Science and Technology ∗National University of Singapore †MicrosoftFigure 1:A few fac¸ade modeling examples from the two sides of a street with 614captured images:some input images in the bottom row,the recovered model rendered in the middle row,and three zoomed sections of the recovered model rendered in the top row.AbstractWe propose in this paper a semi-automatic image-based approach to fac ¸ade modeling that uses images captured along streets and re-lies on structure from motion to recover camera positions and point clouds automatically as the initial stage for modeling.We start by considering a building fac ¸ade as a flat rectangular plane or a developable surface with an associated texture image composited from the multiple visible images.A fac ¸ade is then decomposed and structured into a Directed Acyclic Graph of rectilinear elementary patches.The decomposition is carried out top-down by a recursive subdivision,and followed by a bottom-up merging with the detec-tion of the architectural bilateral symmetry and repetitive patterns.Each subdivided patch of the flat fac ¸ade is augmented with a depth optimized using the 3D points cloud.Our system also allows for an easy user feedback in the 2D image space for the proposed decom-position and augmentation.Finally,our approach is demonstrated on a large number of fac ¸ades from a variety of street-side images.CR Categories:I.3.5[Computer Graphics]:Computational ge-ometry and object modeling—Modeling packages;I.4.5[ImageProcessing and computer vision]:Reconstruction.Keywords:Image-based modeling,building modeling,fac ¸ade modeling,city modeling,photography.1IntroductionThere is a strong demand for the photo-realistic modeling of cities for games,movies and map services such as in Google Earth and Microsoft Virtual Earth.However,most work has been done on large-scale aerial photography-based city modeling.When we zoom to ground level,the viewing experience is often disappoint-ing,with blurry models with few details.On the other hand,many potential applications require street-level representation of cities,where most of our daily activities take place.In term of spatial con-straints,the coverage of ground-level images is close-range.More data need to be captured and processed.This makes street-side modeling much more technically challenging.The current state of the art ranges from pure synthetic methods such as artificial synthesis of buildings based on grammar rules [M¨u ller et al.2006],3D scanning of street fac ¸ades [Fr¨u h and Zakhor 2003],to image-based approaches [Debevec et al.1996].M¨u ller et al.[2007]required manual assignment of depths to the fac ¸ade as they have only one image.However,we do have information from the reconstructed 3D points to automatically infer the critical depth of each primitive.Fr¨u h and Zakhor [2003]required tedious 3D scan-ning,while Debevec et al.[1996]proposed the method for a small set of images that cannot be scaled up well for large scale modelingACM Transaction on Graphics (TOG)Proceedings of SIGGRAPH Asia 2008Figure 2:Overview of the semi-automatic approach to image-based fac ¸ade modeling.of buildings.We propose a semi-automatic method to reconstruct 3D fac ¸ademodels of high visual quality from multiple ground-level street-view images.The key innovation of our approach is the intro-duction of a systematic and automatic decomposition scheme of fac ¸ades for both analysis and reconstruction.The decomposition is achieved through a recursive subdivision that preserves the archi-tectural structure to obtain a Directed Acyclic Graph representation of the fac ¸de by both top-down subdivision and bottom-up merging with local bilateral symmetries to handle repetitive patterns.This representation naturally encodes the architectural shape prior of a fac ¸ade and enables the depth of the fac ¸ade to be optimally com-puted on the surface and at the level of the subdivided regions.We also introduce a simple and intuitive user interface that assists the user to provide feedback on fac ¸ade partition.2Related workThere is a large amount of literature on fac ¸ade,building and archi-tectural modeling.We classify these studies as rule-based,image-based and vision-based modeling approaches.Rule-based methods.The procedural modeling of buildings specifies a set of rules along the lines of L-system.The methods in [Wonka et al.2003;M¨u ller et al.2006]are typical examples of procedural modeling.In general,procedural modeling needs expert specifications of the rules and may be limited in the realism of re-sulting models and their variations.Furthermore,it is very difficult to define the needed rules to generate exact existing buildings.Image-based methods.Image-based methods use images asguide to generate models of architectures interactively.Fac ¸ade de-veloped by Debevec et al.[1996]is a seminal work in this cate-gory.However,the required manual selection of features and the correspondence in different views is tedious,and cannot be scaled up well.M¨u ller et al.[2007]used the limited domain of regular fac ¸ades to highlight the importance of the windows in an architec-tural setting with one single image to create an impressive result of a building fac ¸ade while depth is manually assigned.Although,this technique is good for modeling regular buildings,it is limited to simple repetitive fac ¸ades and cannot be applicable to street-view data as in Figure 1.Oh et al.[2001]presented an interactive sys-tem to create models from a single image.They also manually as-signed the depth based on a painting metaphor.van den Hengel et al.[2007]used a sketching approach in one (or more)image.Although this method is quite general,it is also difficult to scale up for large-scale reconstruction due to the heavy manual interac-tion.There are also a few manual modeling solutions on the market,such as Adobe Canoma,RealViz ImageModeler,Eos Systems Pho-toModeler and The Pixel Farm PFTrack,which all require tedious manual model parameterizations and point correspondences.Vision-based methods.Vision-based methods automatically re-construct urban scenes from images.The typical examples are thework in [Snavely et al.2006;Goesele et al.2007],[Cornelis et al.2008]and the dedicated urban modeling work pursued by Univer-sity of North Carolina at Chapel Hill and University of Kentucky (UNC/UK)[Pollefeys et al.2007]that resulted in meshes on dense stereo reconstruction.Proper modeling with man-made structural constraints from reconstructed point clouds and stereo data has not yet been addressed.Werner and Zisserman [2002]used line seg-ments to reconstruct buildings.Dick et al.[2004]developed 3D architectural modeling from short image sequences.The approach is Bayesian and model based,but it relies on many specific archi-tectural rules and model parameters.Lukas et al.[2006;2008]developed a complete system of urban scene modeling based on aerial images.The result looks good from the top view,but not from the ground level.Our approach is therefore complementary to their system such that the street level details are added.Fr¨u h and Zakhor [2003]also used a combination of aerial imagery,ground color and LIDAR scans to construct models of fac ¸ades.However,like stereo methods,it suffers from the lack of representation for the styles in man-made architectures.Agarwala et al.[2006]composed panoramas of roughly planar scenes without producing 3D models.3OverviewOur approach is schematized in Figure 2.SFM From the captured sequence of overlapping images,we first automatically compute the structure from motion to obtain a set of semi-dense 3D points and all camera positions.We then register the reconstruction with an existing approximate model of the buildings (often recovered from the real images)using GPS data if provided or manually if geo-registration information is not available.Fac ¸ade initialization We start a building fac ¸ade as a flat rectangular plane or a developable surface that is obtained either automatically from the geo-registered approximate building model or we manu-ally mark up a line segment or a curve on the projected 3D points onto the ground plane.The texture image of the flat fac ¸ade is com-puted from the multiple visible images of the fac ¸ade.The detection of occluding objects in the texture composition is possible thanks to the multiple images with parallaxes.Fac ¸ade decomposition A fac ¸ade is then systematically decom-posed into a partition of rectangular patches based on the horizontal and vertical lines detected in the texture image.The decomposition is carried out top-down by a recursive subdivision and followed by a bottom-up merging,with detection of the architectural bilateral symmetry and repetitive patterns.The partition is finally structured into a Directed Acyclic Graph of rectilinear elementary patches.We also allow the user to edit the partition by simply adding and removing horizontal and vertical lines.Fac¸ade augmentation Each subdivided patch of theflat fac¸ade is augmented with the depth obtained from the MAP estimation of the Markov Random Field with the data cost defined by the3D points from the structure from motion.Fac¸ade completion Thefinal fac¸ade geometry is automatically re-textured from all input images.Our main technical contribution is the introduction of a systematic decomposition schema of the fac¸ade that is structured into a Direct Acyclic Graph and implemented as a top-down recursive subdivi-sion and bottom-up merging.This representation strongly embeds the architectural prior of the fac¸ades and buildings into different stages of modeling.The proposed optimization for fac¸ade depth is also unique in that it operates in the fac¸ade surface and in the super-pixel level of a whole subdivision region.4Image CollectionImage capturing We use a camera that usually faces orthogonal to the building fac¸ade and moves laterally along the streets.The camera should preferably be held straight and the neighboring two views should have sufficient overlapping to make the feature corre-spondences computable.The density and the accuracy of the recon-structed points vary,depending on the distance between the camera and the objects,and the distance between the neighboring viewing positions.Structure from motion Wefirst compute point correspondences and structure from motion for a given sequence of images.There are standard computer vision techniques for structure from mo-tion[Hartley and Zisserman2004].We use the approach described in[Lhuillier and Quan2005]to compute the camera poses and a semi-dense set of3D point clouds in space.This technique is used because it has been shown to be robust and capable of providingsufficient point clouds for object modelingpurposes.(a)(b)(c)Figure3:A simple fac¸ade can be initialized from aflat rectangle (a),a cylindrical portion(b)or a developable surface(c).5Fac¸ade InitializationIn this paper,we consider that a fac¸ade has a dominant planar struc-ture.Therefore,a fac¸ade is aflat plane with a depthfield on the plane.We also expect and assume that the depth variation within a simple fac¸ade is moderate.A real building fac¸ade having complex geometry and topology could therefore be broken down into mul-tiple simple fac¸ades.A building is merely a collection of fac¸ades, and a street is a collection of buildings.The dominant plane of the majority of the fac¸ades isflat,but it can be curved sometimes as well.We also consider the dominant surface structure to be any cylinder portion or any developable surface that can be swept by a straight line as illustrated in Figure3.To ease the description,but without loss of generality,we use aflat fac¸ade in the remainder of the paper.For the developable surface,the same methods as forflat fac¸ades in all steps are used,with trivial surface parameterizations. Some cylindrical fac¸ade examples are given in the experiments.Algorithm1Photo Consistency Check For Occlusion Detection Require:A set of N image patches P={p1,p2,...,p N}cor-responding to the projections{x i}of the3D point X. Require:η∈[0,1]to indicate when two patches are similar.1:for all p i∈P do2:s i←0⊲Accumulated similarity for p i 3:for all p j∈P do4:s ij←NCC(p i,p j)5:if s ij>ηthen s i←s i+s ij6:end if7:end for8:end for9: n←arg max i s i⊲ n is the patch with best support 10:V←∅⊲V is the index set with visible projection 11:O←∅⊲V is the index set with occluded projection 12:for all p i∈P do13:if s i n>ηthen V←V∪{i}14:else O←O∪{i}15:end if16:end for17:return V and O5.1Initial Flat RectangleThe reference system of the3D reconstruction can be geo-registered using GPS data of the camera if available or using an interactive technique.Illustrated in Figure2,the fac¸ade modeling process can begin with an existing approximate model of the build-ings often reconstructed from areal images,such as publicly avail-able from Google Earth and Microsoft Virtual Earth.Alternatively, if no such approximate model exists,a simple manual process in the current implementation is used to segment the fac¸ades,based on the projections of the3D points to the groundfloor.We draw a line segment or a curve on the ground to mark up a fac¸ade plane as aflat rectangle or a developable surface portion.The plane or surface position is automaticallyfitted to the3D points or manually adjusted if necessary.5.2Texture CompositionThe geometry of the fac¸ade is initialized as aflat ually, a fac¸ade is too big to be entirely observable in one input image.We first compose a texture image for the entire rectangle of the fac¸ade from the input images.This process is different from image mo-saic,as the images have parallax,which is helpful for removing the undesired occluding objects such as pedestrians,cars,trees,tele-graph poles and trash cans,that lies in front of the target fac¸ade. Furthermore,the fac¸ade plane position is known,compared with an unknown spatial position in stereo algorithms.Hence,the photo consistency constraint is more efficient and robust for occluding object removal,with a better texture image than a pure mosaic. Multi-view occlusion removal As in many multiple view stereo methods,photo consistency is defined as follows.Consider a 3D point X=(x,y,z,1)′with color c.If it has a projection, x i=(u i,v i,1)′=P i X in the i-th camera P i,under the Lam-bertian surface assumption,the projection x i should also have the same color,c.However,if the point is occluded by some other ob-jects in this camera,the color of the projection is usually not the same as c.Note that c is unknown.Assuming that point X is visible from multiple cameras,I={P i},and occluded by some objects in the other cameras,I′={P j},then the color,c i,of the projections in I should be the same as c,while it may be differ-ent from the color,c j,of projections in I′.Now,given a set of projection colors,{c k},the task is to identify a set,O,of the oc-(a)Indicate(b)Remove(c)Inpaint(d)Guide(e)ResultFigure4:Interactive texture refinement:(a)drawn strokes on theobject to indicate removal.(b)the object is removed.(c)automati-cally inpainting.(d)some green lines drawn to guide the structure.(e)better result achieved with the guide lines.cluded cameras.In most situations,we can assume that point X isvisible from most of the cameras.Under this assumption,we have c≈median k{c k}.Given the estimated color of the3D point c,it is now very easy to identify the occluded set,O,according to theirdistances with c.To improve the robustness,instead of a singlecolor,the image patches centered at the projections are used,andpatch similarity,normalized cross correlation(NCC),is used as ametric.The details are presented in Algorithm1.In this way,withthe assumption that the fac¸ade is almost planar,each pixel of thereference texture corresponds to a point that lies on theflat fac¸ade.Hence,for each pixel,we can identify whether it is occluded in aparticular camera.Now,for a given planar fac¸ade in space,all vis-ible images arefirst sorted according to the fronto-parallelism ofthe images with respect to the given fac¸ade.An image is said tobe more fronto-parallel if the projected surface of the fac¸ade in theimage is larger.The reference image isfirst warped from the mostfronto-parallel image,then from the lesser ones according to thevisibility of the point.Inpainting In each step,due to existence of occluding objects,some regions of the reference texture image may still be left empty.In a later step,if an empty region is not occluded and visible fromthe new camera,the region isfilled.In this way of a multi-viewinpainting,the occluded region isfilled from each single camera.At the end of the process,if some regions are still empty,a nor-mal image inpainting technique is used tofill it either automatically[Criminisi et al.2003]or interactively as described in Section5.3.Since we have adjusted the cameras according to the image corre-spondences during bundle adjustment of structure from motion,thissimple mosaic without explicit blending can already produce veryvisually pleasing results.5.3Interactive RefinementAs shown in Figure4,if the automatic texture composition result isnot satisfactory,a two-step interactive user interface is provided forrefinement.In thefirst step,the user can draw strokes to indicatewhich object or part of the texture is undesirable as in Figure4(a).The corresponding region is automatically extracted based on theinput strokes as in Figure4(b)using the method in[Li et al.2004].The removal operation can be interpreted as that the most fronto-parallel and photo-consistent texture selection,from the result ofAlgorithm1,is not what the user wants.For each pixel, n fromLine9of Algorithm1and V should be wrong.Hence,P is up-dated to exclude V:P←O.Then,if P=∅,Algorithm1isrun again.Otherwise,image inpainting[Criminisi et al.2003]isused for automatically inpainting as in Figure4(c).In the secondstep,if the automatic texturefilling is poor,the user can manuallyspecify important missing structural information by extending a fewcurves or line segments from the known to the unknown regions asin Figure4(d).Then,as in[Sun et al.2005],image patches are syn-thesized along these user-specified curves in the unknown regionusing patches selected around the curves in the known region byLoopy Belief Propagation tofind the optimal patches.After com-pleting the structural propagation,the remaining unknownregions(a)Input(b)Structure(c)WeightACB DEHF G(d)SubdivideM(e)Merge Figure5:Structure preserving subdivision.The hidden structure of the fac¸ade is extracted out to form a grid in(b).Such hypotheses are evaluated according to the edge support in(c),and the fac¸ade is recursively subdivided into several regions in(d).Since there is not enough support between Regions A,B,C,D,E,F,G,H,they are all merged into one single region M in(e).arefilled using patch-based texture synthesis as in Figure4(e).6Fac¸ade DecompositionBy decomposing a fac¸ade we try to best describe the faced struc-ture,by segmenting it to a minimal number of elements.The fac¸ades that we are considering inherit the natural horizontal and vertical directions by construction.In thefirst approximation,we may take all visible horizontal and vertical lines to construct an ir-regular partition of the fac¸ade plane into rectangles of various sizes. This partition captures the global rectilinear structure of the fac¸ades and buildings and also keeps all discontinuities of the fac¸ade sub-structures.This usually gives an over-segmentation of the image into patches.But this over-segmentation has several advantages. The over-segmenting lines can also be regarded as auxiliary lines that regularize the compositional units of the fac¸ades and buildings. Some’hidden’rectilinear structures of the fac¸ade during the con-struction can also be rediscovered by this over-segmentation pro-cess.6.1Hidden Structure DiscoveryTo discover the structure inside the fac¸ade,the edge of the reference texture image isfirst detected[Canny1986].With such edge maps, Hough transform[Duda and Hart1972]is used to recover the lines. To improve the robustness,the direction of the Hough transform is constrained to only horizontal and vertical,which happens in most architectural fac¸ades.The detected lines now form a grid to parti-tion the whole reference image,and this grid contains many non-overlapping short line segments by taking intersections of Hough lines as endpoints as in Figure5(b).These line segments are now the hypothesis to partition the fac¸ade.The Hough transformation is good for structure discovery since it can extract the hidden global information from the fac¸ade and align line segments to this hidden structure.However,some line segments in the formed grid may not really be a partition boundary between different regions.Hence,the weight,w e,is defined for each line segment,e,to indicate the like-lihood that this line segment is a boundary of two different regions as shown in Figure5(c).This weight is computed as the number of edge points from the Canny edge map covered by the line segment.Remark on over-segmented partition It is true that the current partition schema is subject to segmentation parameters.But it is important to note that usually a slightly over-segmented partition is not harmful for the purpose of modeling.A perfect partition cer-tainly eases the regularization of the fac¸ade augmentation by depth as presented in the next section.Nevertheless,an imperfect,partic-ularly a slight over-segmented partition,does not affect the model-ing results when the3D points are dense and the optimization works well.(a)Edge weight support(b)Regional statistics supportFigure 6:Merging support evaluation.6.2Recursive SubdivisionGiven a region,D ,in the texture image,it is divided into two sub rectangular regions,D 1and D 2,such that D =D 1∪D 2,by a line segment L with strongest support from the edge points.After D is subdivided into two separate regions,the subdivision procedures continue on the two regions,D 1and D 2,recursively.The recursive subdivision procedure is stopped if either the target region,D ,is too small to be subdivided,or there is not enough support for a division hypothesis,i.e.,region D is very smooth.For a fac ¸ade,the bilateral symmetry about a vertical axis may not exist for the whole fac ¸ade,but it exists locally and can be used for more robust subdivision.First,for each region,D ,the NCC score,s D ,of the two halves,D 1and D 2,vertically divided at the center of D is computed.If s D >η,region D is considered to have bilateral symmetry.Then,the edge map of D 1and D 2are averaged,and subdivision is recursively done on D 1only.Finally,the subdivision in D 1is reflected across the axis to become the subdivision of D 2,and merged the two subdivisions into the subdivision of D .Recursive subdivision is good to preserve boundaries for man-made structural styles.However,it may produce some unnecessary fragments for depth computation and rendering as in Figure 5(d).Hence,as a post-processing,if two neighboring leaf subdivision re-gions,A and B ,has not enough support,s AB ,to separate them,they are merged into one region.The support,s AB ,to separate two neighbor regions,A and B ,is defined to be the strongest weight of all the line segments on the border between A and B :s AB =max e {w e }.However,the weights of line segments can only offer a local image statistic on the border.To improve the ro-bustness,a dual information region statistic between A and B can be used more globally.As in Figure 6,Since regions A and B may not have the same size,this region statistic similarity is defined as follows:First,an axis is defined on the border between A and B ,and region B is mirrored on this axis to have a region,−→B .The over-lapped region,A ∩−→B between A and −→B is defined to be the pixelsfrom A with locations inside −→B .In a similar way,←−A ∩B containsthe pixels from B with locations inside ←−A ,and then it is mirrored tobecome −−−−→←−A ∩B according the the same axis.The normalized crosscorrelation (NCC)between A ∩−→B and −−−−→←−A ∩B is used to define the regional similarity of A and B .In this way,only the symmetric part of A and B is used for region comparison.Therefore,the effect of the other far-away parts of the region is avoided,which will happen if the size of A and B is dramatically different and global statistics,such as the color histogram,are used.Weighted by a parameter,κ,the support,s AB ,to separate two neighboring regions,A and B ,is now defined ass AB =max e{w e }−κNCC (A ∩−→B ,−−−−→←−A ∩B ).Note that the representation of the fac ¸ade is a binary recursive tree before merging and a Directed Acyclic Graph (DAG)after region merging.The DAG representation can innately support the Level of Detail rendering technique.When great details are demanded,the rendering engine can go down the rendering graph to expand all detailed leaves and render them correspondingly.Vice versa,the(x 1,y 1)(x 4,y 4)(x 2,y 2)(x 3,y 3)(a)Fac ¸ade(b)DAGFigure 7:A DAG for repetitive pattern representation.intermediate node is rendered and all its descendents are pruned atrendering time.6.3Repetitive Pattern RepresentationThe repetitive patterns of a fac ¸ade locally exist in many fac ¸ades and most of them are windows.[M¨u ller et al.2007]used a compli-cated technique for synchronization of subdivisions between differ-ent windows.To save storage space and to ease the synchroniza-tion task,in our method,only one subdivision representation for the same type of windows is maintained.Precisely,a window tem-plate is first detected by a trained model [Berg et al.2007]or man-ually indicated on the texture images.The templates are matched across the reference texture image using NCC as the measurement.If good matches exist,they are aligned to the horizontal or vertical direction by a hierarchical clustering,and the Canny edge maps on these regions are averaged.During the subdivision,each matched region is isolated by shrinking a bounding rectangle on the average edge maps until it is snapped to strong edges,and it is regarded as a whole leaf region.The edges inside these isolated regions should not affect the global structure,and hence these edge points are not used during the global subdivision procedure.Then,as in Figure 7,all the matched leaf regions are linked to the root of a common subdivision DAG for that type of window,by introducing 2D trans-lation nodes for the pivot position.Recursive subdivision is again executed on the average edge maps of all matched regions.To pre-serve photo realism,the textures in these regions are not shared and only the subdivision DAG and their respective depths are shared.Furthermore,to improve the robustness of the subdivision,the ver-tical bilateral symmetric is taken as a hard constraint for windows.6.4Interactive Subdivision RefinementIn most situations,the automatic subdivision works satisfactorily.If the user wants to refine the subdivision layout further,three line op-erations and two region operations are provided.The current auto-matic subdivision operates on the horizontal and vertical directions for robustness and simplicity.The fifth ‘carve’operator allows the user to sketch arbitrarily shaped objects manually,which appear less frequently,to be included in the fac ¸ade representation.AddIn an existing region,the user can sketch a stroke to indi-cate the partition as in Figure 8(a).The edge points near the stroke are forced to become salient,and hence the subdivision engine can figure the line segment out and partition the region.DeleteThe user can sketch a zigzag stroke to cross out a linesegment as in Figure 8(b).ChangeThe user can first delete the partition line segments andthen add a new line segment.Alternatively,the user can directly sketch a stroke.Then,the line segment across by the stroke will be deleted and a new line segment will be constructed accordingly as in Figure 8(c).After the operation,all descendants with the target。
reconstruction-based models Reconstruction-based models, also known as generative models, have gained significant attention in the field of machine learning. These models aim to understand the underlying structure of observed data and then use this information to generate new samples that resemble the original data. In this article, we will explore the concept of reconstruction-based models, their applications, and the step-by-step process involved in utilizing such models.1. Introduction to Reconstruction-Based Models: Reconstruction-based models are a class of generative models that learn the probability distribution of observed data and use this knowledge to generate new samples. These models are particularly useful in scenarios where the underlying structure of the data is complex and difficult to model directly.2. Applications of Reconstruction-Based Models: Reconstruction-based models find applications in various fields, including:a. Image Generation: These models can learn to generate realisticimages by capturing the patterns and features present in a given dataset.b. Anomaly Detection: By learning the "normal" distribution of a dataset, reconstruction-based models can identify deviations or anomalies, which can be useful in detecting fraud or anomalies in medical diagnostics.c. Data Imputation: In cases where data is missing, reconstruction-based models can be used to fill in the gaps by generating plausible values based on the observed data.3. The Step-by-Step Process of Utilizing Reconstruction-Based Models:Step 1: Data Preprocessing:The first step in utilizing reconstruction-based models is to preprocess the data. This involves cleaning the data, handling missing values, encoding categorical variables, and normalizing numerical features. Data preprocessing ensures that the input is in a suitable format for the reconstruction-based model.Step 2: Designing the Architecture:The next step is to design the architecture of the reconstruction-based model. This typically involves selecting a suitable neural network architecture, such as a Variational Autoencoder (VAE) or a Generative Adversarial Network (GAN). The choice of the architecture depends on the specific task and requirements.Step 3: Training the Model:Once the architecture is finalized, the model needs to be trained on the input data. The training process involves optimizing the model's parameters to minimize the reconstruction error between the original data and the generated samples. Various optimization techniques, such as gradient descent, are employed to update the model's parameters iteratively.Step 4: Evaluating the Model:After training, the model's performance needs to be evaluated. This can be done by measuring the reconstruction error on a separate validation set. Additionally, subjective evaluations, such as visual inspections or domain-specific metrics, can also be used to assess the quality of the generated samples.Step 5: Generating New Samples:Once the model is trained and evaluated, it can be used to generate new samples. By sampling from the learned probability distribution, the model can produce new data instances that resemble the original dataset.4. Advantages and Limitations of Reconstruction-Based Models: Reconstruction-based models offer several advantages, including their ability to capture complex patterns in data, handle missing values, and generate new samples. However, they also have limitations, such as difficulties in modeling high-dimensional data and the potential for overfitting when the model is too complex.In conclusion, reconstruction-based models play a pivotal role in machine learning by learning the underlying probability distribution of data and generating new samples. They have a wide range of applications and involve a step-by-step process that includes data preprocessing, architecture design, model training, evaluation, and sample generation. By leveraging the power of reconstruction-based models, researchers and practitioners cangain insights into complex datasets and generate new data that closely resembles the original.。
计算机视觉常用术语中英文对照(1)2011-06-08 21:26人工智能 Artificial Intelligence认知科学与神经科学Cognitive Science and Neuroscience 图像处理Image Processing计算机图形学Computer graphics模式识别Pattern Recognized图像表示Image Representation立体视觉与三维重建Stereo Vision and 3D Reconstruction 物体(目标)识别Object Recognition运动检测与跟踪Motion Detection and Tracking边缘edge边缘检测detection区域region图像分割segmentation轮廓与剪影contour and silhouette纹理texture纹理特征提取feature extraction颜色color局部特征local features or blob尺度scale摄像机标定Camera Calibration立体匹配stereo matching图像配准Image Registration特征匹配features matching物体识别Object Recognition人工标注Ground-truth自动标注Automatic Annotation运动检测与跟踪Motion Detection and Tracking 背景剪除Background Subtraction背景模型与更新background modeling and update运动跟踪Motion Tracking多目标跟踪multi-target tracking颜色空间color space色调Hue色饱和度Saturation明度Value颜色不变性Color Constancy(人类视觉具有颜色不变性)照明illumination反射模型Reflectance Model明暗分析Shading Analysis成像几何学与成像物理学Imaging Geometry and Physics全像摄像机Omnidirectional Camera激光扫描仪Laser Scanner透视投影Perspective projection正交投影Orthopedic projection表面方向半球Hemisphere of Directions立体角solid angle透视缩小效应foreshortening辐射度radiance辐照度irradiance亮度intensity漫反射表面、Lambertian(朗伯)表面diffuse surface 镜面Specular Surfaces漫反射率diffuse reflectance明暗模型Shading Models环境光照ambient illumination互反射interreflection反射图Reflectance Map纹理分析Texture Analysis元素elements基元primitives纹理分类texture classification从纹理中恢复图像shape from texture 纹理合成synthetic图形绘制graph rendering图像压缩image compression统计方法statistical methods结构方法structural methods基于模型的方法model based methods 分形fractal自相关性函数autocorrelation function 熵entropy能量energy对比度contrast均匀度homogeneity上下文约束contextual constraintsGibbs随机场吉布斯随机场边缘检测、跟踪、连接Detection、Tracking、LinkingLoG边缘检测算法(墨西哥草帽算子)LoG=Laplacian of Gaussian 霍夫变化Hough Transform链码chain codeB-样条B-spline有理B-样条Rational B-spline非均匀有理B-样条Non-Uniform Rational B-Spline控制点control points节点knot points基函数basis function控制点权值weights曲线拟合curve fitting逼近approximation回归Regression主动轮廓Active Contour Model or Snake 图像二值化Image thresholding连通成分connected component数学形态学mathematical morphology结构元structuring elements膨胀Dilation腐蚀Erosion开运算opening闭运算closing聚类clustering分裂合并方法split-and-merge区域邻接图region adjacency graphs四叉树quad tree区域生长Region Growing过分割over-segmentation分水岭watered金字塔pyramid亚采样sub-sampling尺度空间Scale Space局部特征Local Features背景混淆clutter遮挡occlusion角点corners强纹理区域strongly textured areas 二阶矩阵Second moment matrix 视觉词袋bag-of-visual-words类内差异intra-class variability类间相似性inter-class similarity生成学习Generative learning判别学习discriminative learning人脸检测Face detection弱分类器weak learners集成分类器ensemble classifier被动测距传感passive sensing多视点Multiple Views稠密深度图dense depth稀疏深度图sparse depth视差disparity外极epipolar外极几何Epipolor Geometry校正Rectification归一化相关NCC Normalized Cross Correlation平方差的和SSD Sum of Squared Differences绝对值差的和SAD Sum of Absolute Difference俯仰角pitch偏航角yaw扭转角twist高斯混合模型Gaussian Mixture Model运动场motion field光流optical flow贝叶斯跟踪Bayesian tracking粒子滤波Particle Filters颜色直方图color histogram尺度不变特征转换SIFT scale invariant feature transform 孔径问题Aperture problem/view/77fb81ddad51f01dc281f1a7.html/quotes/txt/2007-09/06/content_75057.htm /message/message1.html/90001/90776/90883/7342346.html。
Modeling Based Image Reconstructionin Time-Resolved Contrast-Enhanced Magnetic Resonance Angiography(CE-MRA)F.T.A.W.Wajer,J.van den Brink,M.Fuderer,D.van Ormondt,J.A.C.van Osch and R.de BeerDelft University of Technology,Department of Applied PhysicsP.O.Box5046,2600GA Delft,The NetherlandsPhone:+31(0)152786394Fax:+31(0)152783251E-mail:beer@si.tn.tudelft.nlPhilips Medical Systems,Best,The Netherlands Abstract—We have worked on the measurement protocoland related image reconstruction of4D data sets in thefieldof time-resolved Contrast-Enhanced Magnetic ResonanceAngiography(CE-MRA).The method aims at improving theinterpolation of sparsely sampled-space data.It is basedon exploiting prior knowledge on the time courses(TCs)ofthe image pixels,when monitoring the uptake of contrastagents in the blood vessels.The result is compared with anexisting approach called3D-TRICKS.Keywords—Magnetic resonance angiography,contrastagent,image reconstruction,scan-time reduction,modelingof pixel time courses.I.I NTRODUCTIONRecently we have published on a method for reducing the scan time in thefield of three-dimensional(3D)time-resolved Contrast-Enhanced Magnetic Resonance Angio-graphy(CE-MRA)[1].CE-MRA is a3D Magnetic Re-sonance Imaging(3D-MRI)technique for visualizing the vascular system.It is based on using the passage of a con-Fig.2.Division of3D-space into four blocks labeled A,B,C and D,as proposed in3D-TRICKS[2].II.M ETHODSA.IntroductionIn3D-MRI the data values in-space are acquired along trajectories,which in case of cartesian sampling distribu-tions are equidistant straight lines.In Figure1these carte-sian trajectories are depicted as arrows in the-direction. Several of such trajectories are required tofill-space.The total measurement time for one3D-space is equal to thenumber of trajectories times the repetition time(TR).Typ-ical values are and TR=10ms,re-sulting in a measurement time of about20s.It is clear that this20s is too long to measure a series of3D-spaces du-ring passage of a contrast agent.A straightforward way to accomplish scan-time reduction is to ommit the measure-ment of a number of trajectories.In the next subsection we will describe how this is done in a sampling strategy called 3D-TRICKS.TimeD D D DC C C CB B B BA A A A A A A AA A A A A A A AB B B BC C C CD D D DFig.3.3D-TRICKS measurement protocol[2].At each sam-pling point in time only one block A,B,C or D of-space is mea-sured.The sequence DACABA is repeated.The empty boxes should be interpolated from the measured ones prior to image reconstruction.Fig.4.TCs of three-coordinates in the neighbourhood of the 3D-space origin.(top)Contributions from all pixels.(bottom) No contributions from pixels outside the blood vessels.B.3D-TRICKSIn three-Dimensional Time-Resolved Imaging of Con-trast KineticS(3D-TRICKS)reduction of MRI scan time is achieved by measuring only parts of the3D-space. To avoid loosing spatial resolution,previously measured -space parts in the4D data set are borrowed.The follow-ing steps can be distinguished in the original3D-TRICKS approach[2]:“Subdivision”of the3D-space into four blocks,la-beled A,B,C and D(see Figure2).Measurement of only“one single block”at each time point,following the sequence shown in Figure3. Estimation of the data values in the empty blocks.In 3D-TRICKS this is accomplished by“linear interpolation”between the acquired blocks.3D FFT based image reconstruction at each time point. The3D-TRICKS measurement protocol,presented in Figure3,makes it clear that the inner blocks A(the center of-space)are measured most.Furthermore it shows that the sequence DACABA is repeated,causing afive times larger empty gap between successive B,C and D blocks than A blocks.We have anticipated that estimating the data values of the empty outer blocks by means of linear inter-polation might be problematic.In the next subsection we propose an alternative way to deal with the missing data.It is based on exploiting the behaviour in the time direction of the individual pixels(the pixel time courses(TCs)). Fig.5.Fit of a sum of two gamma-variate functions(noiselesscurves)to a TC of a pixel in an artery(left peak)and a vein(right peak).C.Modeling by exploiting time behaviourSince in CE-MRA we are dealing with“time series”of 3D-spaces(and related3D images)it seems a logical step to investigate whether the behaviour as a function of time somehow can be included in the sampling-and image reconstruction strategy.In this context afirst decision to be made is,in which domain are we exploiting the timebehaviour?That is to say,are we looking in-space or in image-space as a function of time?Subdivision of3D-space into3D-TRICKS blocksMeasurement of a single block at each time pointZerofilling in the truncation dimension towards fullnumber of points3D-FFTInterpolation of TCs of imagesInterpolation of TCs of,andimagesby imposing the TCs ofAdding,,and imagesFig.6.Block scheme of sampling-and image reconstruction steps for time resolved4D CE-MRA.In principle,due to the linearity property of the Fourier transform[3],there should be no difference when obser-ving the TCs via-space coordinates or image-space pix-els.However,in practice of real-world CE-MRA data sets there is a complication since the contribution of the image domain“background”,or in other words of the pixels out-side the blood vessels,are influencing the time behaviour in-space.The latter is illustrated in Figure4,where we show some TCs for a4D CE-MRA data set as depicted via the center of-space.Details about the data set are given in the section Results and Discussion.When explaining Figure4we assume for a moment that the-space is the result of reverse Fourier transforming the image domain.In doing so in the top part of Figure4some TCs are shown“with the contributions from all pixels”.In the bottom part of thefigure,on the other hand,the TCs of the same-coordinates are shown,but now“without the contributions from the background pixels”.It can be seen that a somewhat clearer contrast agent uptake is visible. In Figure5we show two TCs as obtained via the image domain.One pixel is located in an artery and the other in a vein.The time behaviour is now so pronounced that the TCs could even be modeled by a mathematical function(in the example by a sum of two gamma-variates[4]). Because of the observations,just described,we have de-cided to exploit the time behaviour solely via the image do-main.In doing so we have defined a sequence of sampling-and image reconstruction steps as visualized in the block scheme of Figure6.Concerning the block scheme the following can be said. Since the A blocks are measured most(see Figure3)it seems a logical step to interpolate in some way the TCs of and subsequently impose that time behaviour on,and.The latter amounts to solving the equation(only shown for):(1) Once the linear parameters and have been ob-tained,they can be used to calculate the images at the other times(indicated by):(2) Hence an important step in the method is that in some way the missing time points of must be estimated. We have found that the number of A points is sufficient to allow“linear interpolation”,as was proposed in the origi-nal3D-TRICKS method[2].Fig.7.The TC of an pixel after(solid)using all data, (dashed)using3D-TRICKS and(dotted-solid)imposing the time behaviour of the A part on that of the B part.In order to illustrate that imposing the time behaviour of pixels can yield an improvement we compare in Fig-ure7the TC of an pixel as realized in three ways.The solid line is the true TC,obtained by using all data of the real-world4D data set mentioned earlier.The dashed line results from simulating the3D-TRICKS approach,that is to say after reducing the data set into the3D-TRICKS blocks and performing linear interpolation.Finally,the dotted-solid line is the result of imposing the TC from the A part on that of the B part.It is clear that the latter ismuch closer to the true TC than the linearly interpolated one.III.R ESULTS AND D ISCUSSIONA.Simulation of a4D CE-MRA data setIn order to establish whether the approach,described in the previous section,really works we have applied the method to a“simulated”4D CE-MRA data set.That is to say,we simulated the3D vascular system by sets of ar-teries and veins as shown in the top of Figure8and,in addition,we simulated the uptake of a contrast agent by the TCs shown in the bottom of thatfigure.Subsequently, we applied the protocol described by the block scheme of Figure6.Fig.8.Simulation of a4D CE-MRA data set.(top)Cross-section through the3D image domain.(bottom)The simulated TC of an artery(solid)and a vein(dashed).In Figure9we present the result for3D-TRICKS and our approach,as obtained for the simulated4D CE-MRA data set.Along the vertical axis the so-called“norm”is displayed,which is the square root of the sum of the squared differences between the absolute pixel values of the reconstructed image and the true image.The latter is known,of course,because we are dealing with a simulated image.The horizontal axis concerns thefirst40seconds of the time domain of the contrast agent uptake(the total time is about62seconds).Figure9demonstrates,that a4D CE-MRA data set,measured according to the3D-TRICKS protocol,really can benefit from our interpolation approach for theouter-space blocks.In thefigure most of the norm points for3D-TRICKS are considerable higher(rger differences with the true image)than the points for the new approach. Summing the norms over all time points and taking the 3D-TRICKS result as the100%reference,it is found that the sum for our method is42%of that of3D-TRICKS.Fig.9.Performance of3D-TRICKS and the new method for the simulated4D CE-MRA data set.Along the vertical axis is displayed the“norm”(see text)of the differences between the absolute pixel values of the reconstructed image and the true image.The horizontal axis concerns thefirst40seconds of the time domain.(dashed)Result of3D-TRICKS.(solid)Result of the new method.Fig.10.Performance of3D-TRICKS and the new method for the real-world4D CE-MRA data set.(dashed)Result of3D-TRICKS.(solid)Result of the new method.B.A real-world4D CE-MRA data setThe next step to do is to apply the new approach to a real-world4D CE-MRA data set.To that end we used a measurement that concerned the vascular system of the human neck.The4D acquisition matrix.This amounts for thecomplex-valued-space to a data set of about87MB,ta-king into account that the data values are stored in double precision.To increase the temporal resolution of the mea-surement,the SENSitivity Encoding(SENSE)method was employed.This method realizes a reduced-sampling stra-tegy by using an array of receiver coils[5].In this way for the data set at hand an inter-frame time of1.6s could be accomplished which means a total measurement time of about62s.This time is long enough to visualize the enlightenment of both the arteries and the veins.In order to handle the kind of data set just described we have worked with a PC containing a1.1GHz AMD Athlon CPU and having a1.5GB SDRAM memory.Fur-thermore,the hard-disk capacity is150GB and the sys-tem can operate under either RedHat Linux or Windows NT.When composing this system we have assumed that it must be capable of accessing something like three times the size of the resulting image domain matrix during image reconstruction.A typical case would be,for instance,anreconstruction matrix(when assuming short integers for the pixel values).Fig.11.Performances for the real-world4D CE-MRA data set after introducing true3D rectangular-space blocks and optimizing the sampling sequence of the blocks.(dashed)Result of3D-TRICKS.(solid)Result of the new method.(plus)Result of a mixed approach(see text).In Figure10the performance of3D-TRICKS and the new method is compared for the real-world4D CE-MRA data set.It can be seen that now the improvement of the new interpolation method is only present for a few time points around13seconds.This is the moment that the con-trast agent starts to pass the arteries(see again Figure5). For most of the other time points the performance of3D-TRICKS is even slightly better.Summing the norms over all time points and taking the3D-TRICKS result as the 100%reference,it is found that the sum for our method is102%of that of3D-TRICKS.In the next subsection we will describe how we have tried to improve this somewhat disappointing result for the real-world data set.C.An improvement of the new interpolation approach The performance results,shown in Figure10,were re-alized by using the original3D-TRICKS-space blocks (Figure2)and measurement protocol(Figure3)[2].In or-der tofind out,whether we could improve the results for the real-world data set,we have varied some parameters of the approach:The A,B,C and D-space regions were changed into true3D rectangular blocks(instead of blocks only dividing the dimension;see again Figure2).The order of sampling the A,B,C and D blocks was va-ried,leading to an optimum sequence for the current real-world data set.In fact,more B blocks were introduced at the expense of the C and D blocks.Fig.12.TCs of the original real-world CE-MRA data set, separated into the contribution from the A blocks(solid),the B blocks(dashed),the C blocks(plus-solid)and the D blocks (dotted-solid).(top)Pixel(55,49,7)(in an artery).(bottom) Pixel(70,56,7)(in between an artery and a vein).Dividing the-space into true3D rectangular blocks in-troduced some minor improvement for both3D-TRICKS and our approach.Measuring more B blocks realized a larger improvement,however more for3D-TRICKS than for our interpolation method(see Figure11).This has led us to the idea that somehow our assumption about the time behaviour of the A,B,C and D blocks is not true for all pixels.Indeed,after visualization of many pixel TCs we could demonstrate that for certain pixels the contribu-tions from the various-domain blocks may have different shapes.The latter is illustrated in Figure12.In order to be able to account for different time be-haviours wefinally have applied a mixed interpolation ap-proach:Both the A blocks and C blocks are linearly interpolated (i.e.according to3D-TRICKS).For A this was already the case.For C this was decided because they only represent a small signal strength(see Figure12).The B and C blocks are interpolated either according to 3D-TRICKS or to our approach,depending on the kind of time behaviour(see Figure13).Fig.13.TCs of pixel(55,49,7)(in an artery;see also top of Fig-ure12).The curves are from the full,original,dataset(dotted-solid),from the3D-TRICKS result(dashed)and from the model-based result(solid).(top)The B part.(bottom)The C part.It is clear that in this example the B part should be interpolated according to3D-TRICKS and the C part to our approach.The result for this mixed approach is visualized in Fig-ure11in the form of the plus points.For a number of time points they represent the lowest norm,or in other words they have the best performance.However,when summing the norms over all time points the differences are rather small.Taking the original3D-TRICKS approach of Fig-ure10as the100%reference,the sums for our original approach,the new3D-TRICKS and the mixed approach are88%,86%and85%,respectively.IV.C ONCLUSIONSWe have worked on improving the measurement proto-col and related image reconstruction method,when sam-pling4D data sets in thefield of time-resolved Contrast-Enhanced Magnetic Resonance Angiography(CE-MRA). The method takes as a starting point the3D-TRICKS approach and aimes at improving the interpolation of sparsely sampled outer-space blocks.This is realized by employing prior knowledge delivered by the pixel time courses(TCs).Compared to the original3D-TRICKS pro-tocol[2]we can conclude that:For a simulated CE-MRA data set the new interpolation approach works rather well.A gain in performance of im-age reconstruction of about58%is obtained.Dividing the-space into true3D blocks,instead of blocks that are only dividing the dimension,delivers a minor gain in performance.For the real-world CE-MRA data set a larger gain in performance is obtained by collecting more inner-space blocks than outer blocks as a function of time.The3D-TRICKS method benefits more from that than our method. Compared to the original3D-TRICKS measurement pro-tocol the new3D-TRICKS gains about14%and our new interpolation approach12%.The assumption that outer-space blocks deliver the same kind of time contribution to the TCs of pixels than inner blocks is not always met.This can be the case,for example,for pixels near blood-vessel walls and pixels in between neighbouring arteries and veins.An improvement of our interpolation method is obtained by carrying out a mixed approach concerning the interpo-lation of the sparsely sampled-space blocks.That is to say,some blocks are linearly interpolated(i.e.according to 3D-TRICKS)and others are interpolated according to our approach(i.e.invoking the TCs of inner blocks on that of the outer ones).This yielded a gain in performance,when compared to the original3D-TRICKS,of about15%.A CKNOWLEDGEMENTSThis work is supported by the Dutch Technology Foun-dation(STW,project DTN4967).R EFERENCES[1]Wajer F.T.A.W.;Fuderer M.;van der Brink J.;van Ormondt D.;de Beer R.Image Reconstruction With Time-Resolved Contrast.Proc.ProRISC2001,Veldhoven,the Netherlands,pp.714-720.On CD.[2]Korosec F.R.;Frayne R.;Grist T.M.;Mistretta C.A.Time-Resolved Contrast-Enhanced3D MR Angiography.Magn.Reson.Med.36:345-351;1996.[3]Brigham E.O.The Fast Fourier Transform.Englewood Cliffs:Prentice-Hall;1974.[4]Fain S.B.;Riederer S.J.;Bernstein M.A.;Huston J.Theoreti-cal Limits of Spatial Resolution in Elliptical-Centric Contrast-Enhanced3D-MRA.Magn.Reson.Med.42:1106-1116;1999.[5]Pruessmann K.P.;Weiger M.;Scheidegger M.B.;Boesiger P.SENSE:Sensivity Encoding for Fast MRI.Magn.Reson.Med.42:952-962;1999.。