SPSS软件应用实例
- 格式:docx
- 大小:81.10 KB
- 文档页数:21
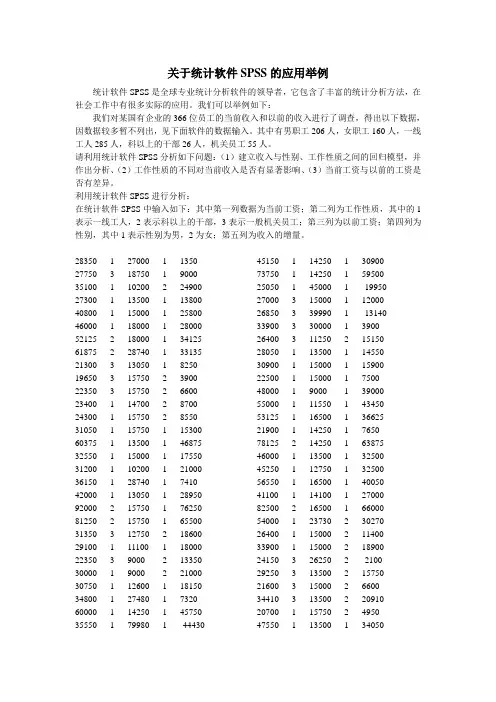
关于统计软件SPSS的应用举例统计软件SPSS是全球专业统计分析软件的领导者,它包含了丰富的统计分析方法,在社会工作中有很多实际的应用。
我们可以举例如下:我们对某国有企业的366位员工的当前收入和以前的收入进行了调查,得出以下数据,因数据较多暂不列出,见下面软件的数据输入。
其中有男职工206人,女职工160人,一线工人285人,科以上的干部26人,机关员工55人。
请利用统计软件SPSS分析如下问题:(1)建立收入与性别、工作性质之间的回归模型,并作出分析、(2)工作性质的不同对当前收入是否有显著影响、(3)当前工资与以前的工资是否有差异。
利用统计软件SPSS进行分析:在统计软件SPSS中输入如下:其中第一列数据为当前工资;第二列为工作性质,其中的1表示一线工人,2表示科以上的干部,3表示一般机关员工;第三列为以前工资;第四列为性别,其中1表示性别为男,2为女;第五列为收入的增量。
28350 1 27000 1 1350 27750 3 18750 1 9000 35100 1 10200 2 24900 27300 1 13500 1 13800 40800 1 15000 1 25800 46000 1 18000 1 28000 52125 2 18000 1 34125 61875 2 28740 1 33135 21300 3 13050 1 8250 19650 3 15750 2 3900 22350 3 15750 2 6600 23400 1 14700 2 8700 24300 1 15750 2 8550 31050 1 15750 1 15300 60375 1 13500 1 46875 32550 1 15000 1 17550 31200 1 10200 1 21000 36150 1 28740 1 7410 42000 1 13050 1 28950 92000 2 15750 1 76250 81250 2 15750 1 65500 31350 3 12750 2 18600 29100 1 11100 1 18000 22350 3 9000 2 13350 30000 1 9000 2 21000 30750 1 12600 1 18150 34800 1 27480 1 7320 60000 1 14250 1 45750 35550 1 79980 1 -44430 45150 1 14250 1 30900 73750 1 14250 1 59500 25050 1 45000 1 -19950 27000 3 15000 1 12000 26850 3 39990 1 -13140 33900 3 30000 1 3900 26400 3 11250 2 15150 28050 1 13500 1 14550 30900 1 15000 1 15900 22500 1 15000 1 7500 48000 1 9000 1 39000 55000 1 11550 1 43450 53125 1 16500 1 36625 21900 1 14250 1 7650 78125 2 14250 1 63875 46000 1 13500 1 32500 45250 1 12750 1 32500 56550 1 16500 1 40050 41100 1 14100 1 27000 82500 2 16500 1 66000 54000 1 23730 2 30270 26400 1 15000 2 11400 33900 1 15000 2 18900 24150 3 26250 2 -2100 29250 3 13500 2 15750 21600 3 15000 2 6600 34410 3 13500 2 20910 20700 1 15750 2 4950 47550 1 13500 1 3405033900 1 14250 1 19650 23400 1 15000 2 8400 32850 1 9750 2 23100 55750 1 21750 2 34000 25200 1 26250 2 -1050 26250 1 21000 1 5250 26400 1 14550 1 11850 39150 1 30000 1 9150 68750 1 21240 1 47510 16200 1 21480 2 -5280 20100 1 25000 2 -4900 24000 1 20250 2 3750 25950 1 34980 2 -9030 24600 1 18000 2 6600 28500 1 10500 2 18000 30750 1 19500 1 11250 40200 1 11550 1 28650 30000 1 11550 1 18450 22050 1 11400 2 10650 78250 1 10500 1 67750 60625 1 14550 1 46075 39900 1 18000 1 21900 97000 2 10950 1 86050 27450 1 14250 1 13200 31650 1 11250 1 20400 91250 2 10950 1 80300 25200 1 17100 2 8100 21000 1 15750 2 5250 30450 1 14100 1 16350 28350 1 28740 1 -390 30750 1 27480 1 3270 30750 1 9750 1 21000 32550 1 11250 2 21300 33300 1 10950 2 22350 38550 1 10950 2 27600 27450 1 10050 1 17400 24300 1 10500 1 13800 30750 1 15000 1 15750 19650 1 19500 2 150 68750 1 15000 1 53750 59375 1 10950 1 48425 31500 1 27480 1 4020 27300 1 22500 1 4800 27000 1 15750 1 11250 41550 1 35010 2 6540 26250 1 15750 2 10500 22200 1 13500 1 8700 65000 1 29490 1 35510 30900 1 14400 1 16500 20100 1 11550 2 8550 22350 1 15000 2 7350 35550 1 18000 2 17550 28500 1 9000 2 19500 24450 1 15000 2 9450 16650 1 27480 2 -10830 26700 1 16500 1 10200 43950 1 14100 1 29850 23700 1 16500 1 7200 26550 1 18750 2 7800 27600 1 14250 1 13350 25800 1 14100 1 11700 42300 1 15750 1 26550 30750 1 10500 1 20250 26700 3 13500 2 13200 20850 3 15000 2 5850 35250 3 16500 1 18750 26700 3 15000 1 11700 26550 3 15000 2 11550 27750 3 15000 2 12750 25050 3 9750 2 15300 66000 2 27510 1 38490 52650 2 30000 1 22650 45625 2 15750 1 29875 30900 1 17250 1 13650 29400 1 15750 2 13650 33300 1 24990 2 8310 21900 1 10950 2 10950 18150 1 15000 2 3150 46875 1 37500 2 9375 25500 1 15000 1 10500 26550 1 13200 1 13350 26700 1 13500 1 13200 29850 1 13350 2 16500 69250 1 13950 1 55300 31950 1 13200 1 18750 26250 1 9750 1 16500 35700 1 13500 2 22200 28500 1 23250 2 525017100 1 13500 2 3600 25200 1 14250 1 10950 24000 1 15000 2 9000 27450 1 15000 2 12450 18450 1 26250 2 -7800 39300 1 15000 1 24300 38850 1 12900 1 25950 30750 1 12000 1 18750 37500 1 15000 1 22500 58750 1 15000 1 43750 34500 1 13050 2 21450 36000 1 12000 2 24000 29100 3 12750 2 16350 16500 1 47490 2 -30990 19650 1 19500 1 150 24750 1 23250 2 1500 27150 1 15000 2 12150 26400 1 16500 2 9900 23100 1 13500 2 9600 54900 1 9750 1 45150 70875 2 9750 1 61125 51250 1 17250 1 34000 67500 2 14400 1 53100 29340 1 15000 1 14340 39600 1 13500 1 26100 29100 1 15000 1 14100 33150 1 42480 1 -9330 66750 1 15000 1 51750 33750 1 15600 1 18150 27300 1 17250 1 10050 24000 1 16500 2 7500 19800 1 10200 2 9600 30600 3 13050 1 17550 28950 3 12750 1 16200 38400 3 10200 1 28200 30750 3 10200 1 20550 20400 3 15750 2 4650 19200 3 15000 2 4200 30150 3 15000 1 15150 34620 3 20400 1 14220 80000 2 21750 1 58250 25350 1 18750 1 6600 29850 1 19980 1 9870 24000 1 16500 2 7500 27750 1 10200 2 17550 22350 1 12750 2 9600 16200 1 12000 2 4200 21900 1 15750 2 6150 23250 1 12750 2 10500 33900 1 12000 2 21900 25650 1 25500 2 150 17250 1 43500 2 -26250 22500 1 27480 1 -4980 40200 1 34980 1 5220 55500 1 19500 1 36000 26550 1 16500 1 10050 50550 1 15000 1 35550 75000 1 16500 1 58500 27450 1 52500 2 -25050 22650 1 15000 2 7650 27300 1 17250 2 10050 27750 1 11250 2 16500 54375 1 10200 2 44175 22050 1 16500 2 5550 25500 1 15000 2 10500 28200 1 16500 2 11700 23100 1 15000 2 8100 25500 1 10950 1 14550 17100 1 11100 2 6000 68125 3 15750 1 52375 30600 1 27750 1 2850 19950 1 15750 2 4200 23400 1 15000 2 8400 34500 1 15750 2 18750 18150 3 13800 2 4350 22350 3 19500 1 2850 40200 3 10200 1 30000 28650 3 10200 1 18450 27750 3 12750 1 15000 66875 2 15750 1 51125 30000 1 12000 1 18000 83750 2 14250 1 69500 33900 1 10200 1 23700 56500 1 15000 1 41500 43000 1 21000 2 22000 20850 1 33750 2 -12900 24450 1 15000 2 9450 24750 1 19500 2 525034500 1 31500 1 3000 27900 1 12000 1 15900 24000 1 11250 1 12750 26850 1 11250 1 15600 23400 1 11225 2 12175 24600 1 18750 2 5850 32550 1 10200 2 22350 26550 1 18000 1 8550 31500 1 10950 1 20550 22350 1 10950 1 11400 35250 1 11550 1 23700 25800 1 11250 2 14550 30750 1 10950 1 19800 30750 1 10950 1 19800 50000 1 12000 1 38000 34500 1 12750 1 21750 26250 1 11250 1 15000 44875 1 11400 1 33475 22500 1 10200 2 12300 25650 1 32490 2 -6840 21300 1 15750 2 5550 29850 1 27480 2 2370 34500 1 36750 2 -2250 27750 1 11550 1 16200 27750 1 11250 1 16500 48750 1 11250 1 37500 43410 1 11250 1 32160 22050 1 10950 1 11100 22050 1 11250 2 10800 26700 1 11250 1 15450 55000 2 11250 1 43750 62500 2 17250 1 45250 27300 3 10950 1 16350 24450 3 15000 2 9450 33000 3 17250 2 15750 37050 3 18000 2 19050 24450 3 16500 2 7950 31950 3 31980 1 -30 47250 2 15750 1 31500 26100 3 21750 2 4350 15900 3 16500 2 -600 23700 3 21000 2 2700 21750 3 17490 2 4260 59400 2 12000 1 47400 24450 1 12000 2 12450 103500 2 10950 1 92550 35700 1 15750 1 19950 22200 1 15000 2 7200 22950 1 32010 2 -9060 23100 1 33000 2 -9900 56750 1 15750 2 41000 29100 1 25500 2 3600 37650 1 19500 2 18150 27900 1 23730 2 4170 21150 1 30750 2 -9600 31200 1 36240 1 -5040 20550 1 15750 2 4800 25950 3 15000 1 10950 28350 3 14250 1 14100 17700 3 12750 2 4950 23550 1 15750 2 7800 19950 1 15000 2 4950 29400 1 15300 2 14100 28800 1 13500 2 15300 16950 1 18000 2 -1050 35700 1 15000 1 20700 17400 1 13500 2 3900 21450 1 15000 2 6450 24750 1 15750 2 9000 16950 1 13500 2 3450 26100 1 15750 2 10350 28050 1 16500 1 11550 36600 1 32490 2 4110 58125 1 18000 2 40125 21300 1 15750 1 5550 22500 1 21240 1 1260 29400 1 12000 1 17400 27450 1 14250 1 13200 29850 1 11250 1 18600 25350 1 13500 1 11850 15750 1 12150 2 3600 19650 1 15000 2 4650 21000 1 11550 2 9450 27000 1 21990 1 5010 24000 1 15750 1 8250 78500 1 15000 1 63500 20850 1 12000 2 8850 30000 1 14250 1 1575028500 1 12000 1 16500 65000 2 15000 1 50000 30150 1 10200 1 19950 21600 1 15750 2 5850 29100 1 15750 2 13350 22650 1 32490 2 -9840 20850 1 34980 2 -14130 22950 1 17250 2 5700 30600 1 12000 2 18600 20400 1 18000 2 2400 23850 1 18000 2 5850 22800 3 10950 2 11850 20700 3 15750 2 4950 21300 3 21240 2 60 37800 3 11550 1 26250 31200 3 10200 1 21000 29400 3 10650 1 18750 70000 2 12450 1 57550 33900 1 33750 1 150 27150 1 14250 1 12900 22200 1 60000 2 -37800 31350 1 16500 2 14850 20850 1 16500 2 4350 33300 1 13950 1 19350 86250 2 12000 1 74250 30750 1 30000 1 750 33540 1 12750 1 20790 34950 1 15750 1 19200 21600 1 13500 2 8100 24450 1 12000 2 12450 30750 1 15750 1 15000 40050 1 11250 1 28800 40350 1 17250 1 23100 38700 1 15000 1 23700 65000 1 10200 1 54800 51450 1 13500 1 37950 35250 1 10200 1 25050 25950 1 15300 1 10650 25050 1 13950 1 11100 26250 1 10200 1 16050 31950 1 18000 1 13950 30000 1 10200 1 19800 66250 2 10200 1 56050 101889 2 12000 1 89889(1)对收入与性别、工作类型之间的关系,利用SPSS的线性回归进行建模分析:得到当前工资与性别、工作类型之间的相关模型为:当前工资=52368.571-14140×性别+1535.501×工作类型模型检验的p值为0.000<0.05,说明该模型显著;而决定系数为0.196,因决定系数在取值范围0—1内取值越大说明模型的效果越好,可见该模型效果不是很好。
引言概述:SPSS是一款广泛应用于统计学和社会科学领域的数据分析软件。
它具有强大的统计分析功能,能够帮助研究人员更好地理解数据和探索潜在的关联。
本文将通过一个实际的案例,介绍SPSS在数据分析中的应用。
正文内容:1.数据的收集和准备:详细描述数据的来源和收集方式。
解释数据的结构和格式。
分析数据的质量并进行必要的数据清洗,如处理缺失值、异常值和离群值。
2.描述性统计分析:利用SPSS计算数据的基本统计指标,如均值、中位数、标准差等,以便更好地了解数据的分布和特征。
绘制直方图、箱线图等图表来可视化数据的分布情况。
计算数据的相关系数来研究变量之间的关系。
3.统计推断分析:运用t检验、方差分析、回归分析等方法来检验假设和得出结论。
描述分析结果的显著性和实际意义。
进一步探讨可能的影响因素,并运用SPSS进行模型拟合和预测。
4.因子分析和聚类分析:运用因子分析方法来降维和提取变量的共性因子。
对提取出的因子进行解释和命名,以便更好地理解变量之间的关系。
运用聚类分析方法来探索数据样本的分组结构和相似性。
5.时间序列分析:将数据按照时间顺序进行排序,并探索数据的趋势、周期和季节性。
运用ARIMA模型或指数平滑法进行时间序列预测。
解释预测结果的可靠性和稳定性。
总结:本文以一个实际的案例为例,详细介绍了SPSS在数据分析中的应用。
通过数据的收集和准备,描述性统计分析,统计推断分析,因子分析和聚类分析以及时间序列分析等方面的阐述,我们可以较为全面地了解SPSS在数据分析中的强大功能和应用价值。
通过SPSS的数据分析,研究人员可以更好地理解数据、发现问题、做出准确的预测,从而对决策和政策的制定提供支持。
同样的方法可以应用于各种领域的数据分析,无论是市场调研、医学研究还是社会科学研究,SPSS都能够提供强大的分析工具和方法。
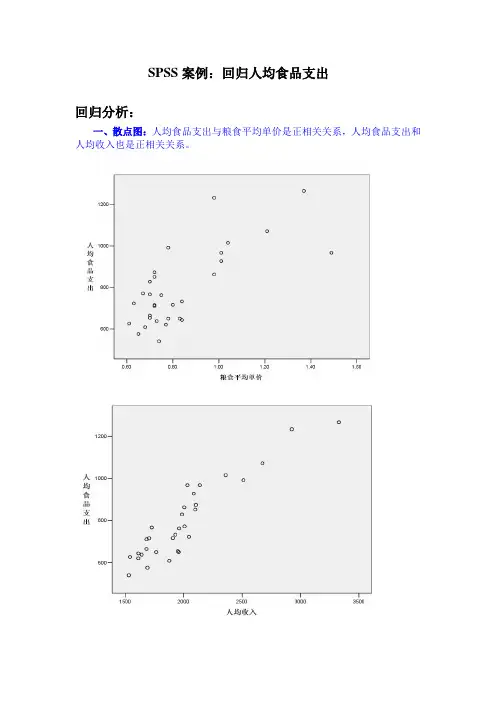
SPSS案例:回归人均食品支出回归分析:一、散点图:人均食品支出与粮食平均单价是正相关关系,人均食品支出和人均收入也是正相关关系。
二、相关性分析:人均食品支出与粮食平均单价的相关系数为0.730,为显著相关,假设检验t检验,sig(2-tailed)=0小于双侧检验的显著水平0.01,所以推翻原假设,人均食品支出与粮食平均单价线性相关。
人均食品支出与人均收入的相关系数为0.921,为显著相关,假设检验t检验,sig(2-tailed)=0小于双侧检验的显著水平0.01,所以推翻原假设,人均食品支出与人均收入线性相关。
三、(1)方程中的自变量列表(方法是进入)(2 )模型拟合概述:可以从表中看出,自变量和因变量之间的相关系数为0.940,拟合线性回归的确定性系数为0.883,经调整后的确定性系数为0.875,标准误的估计为2.766。
这里的R,R^2的值反映两变量的共变量比率高,模型与数据的拟合程度好。
Durbin-Watson=2.766>2,所以他们三者的关系程度显著。
四、方差分析:回归平方和为915129.1,残差平方和为120679.8,总平方和为1035809,对应的F统计量的值为106.164,显著性水平小于0.05,可以认为所建立的回归方程有效。
因为sig=0小于0.05,所以推翻原假设的多个自变量同时为0的假设,所以自变量不同时为0.五、回归系数:非标准化的回归系数X1的估计值为213.423,标准误为73.278,标准化的回归系数为0.243,回归系数显著性检验t统计量的值为2.913,对应显著性水平Sig.=0.007<0.05,可以认为粮食平均单价对人均食品输出有显著影响。
X2的估计值为0.352,标准误为0.038,标准化的回归系数0.767,回归系数显著性检验t统计量的值为9.185,对应显著性水平Sig.=0.000<0.05,可以认为人均收入对人均食品输出有显著影响。
spss分析案例SPSS分析案例。
在社会科学研究中,SPSS(Statistical Package for the Social Sciences)是一个非常常用的统计分析软件,它能够帮助研究者对数据进行有效的整理、分析和呈现。
本文将以一个实际的案例来介绍SPSS的使用,希望能够帮助读者更好地理解和运用这一工具。
案例背景:假设我们是一家餐饮公司的市场部门,想要了解不同地区的顾客对我们产品的满意度情况,以便进行有针对性的改进和营销活动。
我们收集了来自不同地区的顾客满意度调查数据,包括满意度评分和顾客所在地区。
数据准备:首先,我们需要将收集到的数据整理成SPSS可以识别的格式。
在SPSS中,我们可以将数据导入数据视图中,按照变量的不同类型进行设定,比如将地区设定为名义变量,满意度评分设定为数值型变量。
数据分析:接下来,我们可以进行数据分析了。
我们可以使用描述性统计方法来了解不同地区的顾客满意度评分的分布情况,比如平均值、标准差、最大值和最小值等。
这可以帮助我们直观地了解不同地区的满意度情况。
此外,我们还可以使用交叉表分析方法来探究地区和满意度评分之间的关系。
通过交叉表,我们可以清晰地看到不同地区的顾客在不同满意度评分下的分布情况,从而找出可能存在的关联关系。
结果呈现:最后,我们需要将分析结果进行呈现。
在SPSS中,我们可以利用图表功能来直观地展示数据分析的结果,比如制作柱状图或饼状图来展示不同地区的满意度评分分布情况。
此外,我们还可以利用报告功能来生成分析报告,将分析结果清晰地呈现给决策者。
结论:通过以上的分析,我们可以得出不同地区的顾客满意度情况,从而为下一步的改进和营销活动提供依据。
同时,我们也了解了如何使用SPSS来进行数据分析,希望本案例能够对读者有所帮助。
总结:SPSS作为一款强大的统计分析软件,可以帮助研究者对数据进行全面的分析和呈现。
通过本案例的介绍,希望读者能够更加熟练地运用SPSS,为自己的研究工作提供有力的支持。

大学生spss数据分析案例大学生SPSS数据分析案例。
在大学教育中,数据分析是一个非常重要的环节,尤其是对于社会科学和商业管理专业的学生来说。
SPSS(Statistical Package for the Social Sciences)是一个专业的统计分析软件,广泛应用于学术研究和商业决策中。
本文将以一个大学生SPSS数据分析案例为例,介绍如何使用SPSS进行数据分析。
案例背景:某大学社会科学专业的学生对大学生活满意度进行了调查,并收集了相关数据,包括学生的性别、年级、专业、宿舍类型、课程质量、宿舍环境、社交活动等方面的信息。
现在需要对这些数据进行分析,以了解不同因素对大学生活满意度的影响。
数据准备:首先,需要将调查所得的数据录入SPSS软件中,确保数据的准确性和完整性。
在录入数据时,要注意将不同的变量分别录入不同的列中,以便后续的分析和处理。
数据分析:1. 描述统计分析。
首先,可以对各个变量进行描述统计分析,包括计算均值、标准差、频数分布等。
通过描述统计分析,可以直观地了解各个变量的分布情况,为后续的分析提供基础。
2. 相关性分析。
接下来,可以进行各个变量之间的相关性分析,通过相关系数的计算来了解不同变量之间的关联程度。
例如,可以分析学生的性别、年级、专业与大学生活满意度之间的相关性,以及宿舍类型、课程质量、社交活动等因素对大学生活满意度的影响程度。
3. 方差分析。
针对分类变量,可以进行方差分析,比较不同组别之间的均值差异是否显著。
例如,可以分析不同年级、不同专业的学生对大学生活满意度的差异情况,以及不同宿舍类型对大学生活满意度的影响是否显著。
4. 回归分析。
最后,可以利用回归分析来探讨不同因素对大学生活满意度的影响程度。
通过建立回归模型,可以了解各个自变量对因变量的影响情况,以及它们之间的关系强度和方向。
结论与建议:通过以上的数据分析,可以得出不同因素对大学生活满意度的影响程度,为学校和相关部门提供决策建议。
spss案例分析SPSS案例分析。
SPSS(Statistical Package for the Social Sciences)是一种统计分析软件,广泛应用于社会科学、生物科学、医学科学等领域。
它提供了强大的数据分析工具,可以帮助研究人员进行数据处理、统计分析和数据可视化。
在本文中,我们将通过一个实际案例来演示如何使用SPSS进行数据分析。
案例背景。
假设我们是一家电子商务公司的数据分析师,我们收集了一份关于用户购买行为的数据,希望通过分析这些数据来了解用户的购买习惯,从而制定更有效的营销策略。
数据描述。
我们的数据包括以下几个变量:用户ID,用户的唯一标识。
购买金额,用户在一段时间内的购买金额。
购买次数,用户在同一段时间内的购买次数。
平均购买金额,用户平均每次购买的金额。
性别,用户的性别。
年龄,用户的年龄。
注册时间,用户的注册时间。
数据分析。
首先,我们将导入数据到SPSS软件中,然后进行数据清洗和变量筛选。
接下来,我们可以使用SPSS中的统计分析功能来对数据进行探索性分析,包括描述统计、相关性分析、t检验、方差分析等。
描述统计。
我们可以通过描述统计来了解用户的购买行为情况,包括购买金额的分布、购买次数的分布、平均购买金额的均值和标准差等。
这些统计指标可以帮助我们更清楚地了解用户的购买习惯。
相关性分析。
我们可以利用SPSS进行相关性分析,探讨购买金额和其他变量之间的关系。
比如,我们可以分析购买金额与用户年龄的相关性,购买金额与购买次数的相关性等。
通过相关性分析,我们可以发现变量之间的关联性,从而为后续的分析提供参考。
t检验和方差分析。
如果我们想比较不同性别、不同年龄段用户之间的购买行为是否存在显著差异,可以利用SPSS进行t检验和方差分析。
这些分析可以帮助我们了解不同群体之间的差异性,为制定针对性营销策略提供依据。
数据可视化。
除了以上的统计分析,SPSS还提供了丰富的数据可视化功能,包括直方图、散点图、箱线图等。


统计学课SPSS数据分析实战案例SPSS(统计分析系统)是一款常用的统计软件,被广泛应用于社会科学、商业、医学等领域的数据分析工作中。
通过这个案例,我们将运用SPSS软件进行数据分析,以展示统计学课的实战应用。
案例背景假设你是一位市场研究员,你的公司正在调查消费者对某产品的满意度。
你已经收集了一份随机抽样的数据集,包含了消费者的满意度评分以及他们的一些个人信息。
你的任务是对这些数据进行分析,以了解消费者满意度与个人信息之间是否存在关联。
数据集说明数据集包括了500个消费者的信息,具体变量如下:1. 变量1:满意度评分(连续变量,取值范围从1到10);2. 变量2:性别(分类变量,取值为男性和女性);3. 变量3:年龄(连续变量);4. 变量4:收入水平(分类变量,取值为低、中、高三个层次);5. 变量5:购买次数(连续变量,表示过去一年内购买该产品的次数)。
数据分析步骤以下是对这份数据集进行分析的步骤:1. 数据清洗和准备首先,我们需要检查数据集中是否存在缺失值或异常值,并进行数据清洗。
在SPSS中,我们可以使用数据查看和数据清洗的功能来完成这一步骤。
确保数据集中的每一列都没有缺失值,并且所有的异常值已经得到恰当的处理。
2. 描述性统计分析接下来,我们可以使用SPSS的描述性统计分析功能,对数据集进行描述性统计分析。
我们可以计算满意度评分、年龄和购买次数的平均值、标准差、最小值、最大值,并生成频数分布表和柱状图。
3. 相关性分析为了确定满意度评分与其他个人信息变量之间的关联性,我们可以使用SPSS的相关性分析功能。
通过计算满意度评分与性别、年龄、收入水平和购买次数之间的相关系数,我们可以评估它们之间的相关性。
4. 单因素方差分析我们可以使用SPSS进行单因素方差分析,以了解不同收入水平的消费者在满意度评分上是否存在显著差异。
通过观察方差分析表和显著性水平,我们可以得出初步结论。
5. 多元线性回归分析最后,我们可以使用SPSS的多元线性回归分析功能来建立一个回归模型,以预测满意度评分。
spss案例SPSS案例。
在社会科学研究中,统计分析是非常重要的一环。
SPSS(Statistical Package for the Social Sciences)是一款专业的统计分析软件,广泛应用于各种社会科学领域的数据处理和分析。
本文将通过一个实际案例,介绍如何运用SPSS进行数据分析,帮助读者更好地理解和掌握SPSS的使用方法。
案例背景。
假设我们是一家市场调查公司的数据分析师,公司委托我们对一项关于消费者购买行为的调查数据进行分析。
调查内容包括消费者的年龄、性别、受教育程度、月收入以及购买产品的种类和频率等信息。
我们需要利用SPSS对这些数据进行分析,为公司提供有关消费者购买行为的详细报告。
数据导入与整理。
首先,我们需要将调查数据导入SPSS软件中进行整理。
在SPSS界面中,选择“文件”-“导入数据”-“从文本文件”,选择相应的数据文件并进行导入。
导入后,我们需要对数据进行清洗和整理,包括删除缺失值、重复值以及异常值,确保数据的准确性和完整性。
描述性统计分析。
接下来,我们可以利用SPSS进行描述性统计分析,对数据的基本特征进行描述。
通过选择“分析”-“描述统计”-“频数”,我们可以得到各个变量的频数分布情况,包括年龄、性别、受教育程度等。
同时,我们还可以利用直方图、饼图等图表形式直观地展示这些分布情况,帮助我们更好地理解数据。
相关性分析。
在获得了数据的基本描述后,我们可以利用SPSS进行相关性分析,探究不同变量之间的相关关系。
通过选择“分析”-“相关”-“双变量”,我们可以得到各个变量之间的相关系数和显著性水平。
这有助于我们了解不同变量之间的相关程度,为后续的分析提供依据。
多元回归分析。
最后,我们可以利用SPSS进行多元回归分析,探究影响消费者购买行为的主要因素。
通过选择“回归”-“线性”,我们可以将购买产品的频率作为因变量,年龄、性别、受教育程度、月收入等作为自变量,建立回归模型并进行分析。
spss数据分析案例SPSS数据分析案例。
在实际的数据分析工作中,SPSS(Statistical Product and Service Solutions)是一个非常常用的统计分析软件。
它提供了强大的数据处理和分析功能,可以帮助研究人员快速、准确地进行数据处理和分析。
本文将通过一个实际的案例,介绍如何使用SPSS进行数据分析,并展示分析结果。
案例背景:某公司想要了解员工满意度与工作绩效之间的关系,为了达到这个目的,他们进行了一项调查,收集了员工的满意度评分和绩效评分数据。
现在,他们希望通过这些数据,利用SPSS进行分析,找出员工满意度和工作绩效之间的关系。
数据收集:首先,我们收集了100名员工的满意度评分和绩效评分数据。
满意度评分采用了1-5的五级评分制,绩效评分采用了1-100的百分制评分。
数据导入:将收集到的数据导入SPSS软件中,创建一个新的数据集,并将员工的满意度评分和绩效评分数据分别录入到不同的变量中。
数据描述统计分析:首先,我们对数据进行描述性统计分析,包括计算满意度评分和绩效评分的均值、标准差、最大值、最小值等。
这些统计量可以帮助我们更好地了解数据的分布情况。
相关性分析:接下来,我们使用SPSS进行相关性分析,探索员工满意度评分和绩效评分之间的相关关系。
通过相关性分析,我们可以计算出两个变量之间的相关系数,进而判断它们之间是否存在显著的相关性。
回归分析:在确定了员工满意度评分和绩效评分之间存在相关性的基础上,我们可以进一步进行回归分析,建立员工满意度评分对绩效评分的预测模型。
通过回归分析,我们可以得到员工满意度评分对绩效评分的影响程度,以及其他可能影响绩效评分的因素。
结论:通过SPSS数据分析,我们发现员工满意度评分与绩效评分之间存在显著的正相关关系,即员工满意度评分越高,其绩效评分也越高。
这为公司提高员工绩效提供了重要的参考依据,可以通过提升员工满意度来提高整体绩效水平。
总结:在本案例中,我们利用SPSS软件进行了员工满意度和绩效之间的数据分析。
spss数据分析简单案例SPSS数据分析简单案例。
在社会科学研究中,SPSS(统计分析软件包)被广泛应用于数据分析。
本文将通过一个简单的案例来介绍如何使用SPSS进行数据分析。
首先,我们收集了一份关于学生学习成绩的数据,包括学生的性别、年龄、每周学习时间和期末考试成绩。
我们的研究问题是探讨性别、年龄和每周学习时间对学习成绩的影响。
我们首先打开SPSS软件,导入我们收集的数据。
然后,我们可以使用SPSS 的数据编辑功能对数据进行清洗和整理,确保数据的准确性和完整性。
接下来,我们可以使用SPSS的描述性统计功能对数据进行分析。
我们可以计算每个变量的均值、标准差、最大值和最小值,从而对数据的分布和特征有一个直观的了解。
然后,我们可以使用SPSS的相关分析功能来探讨不同变量之间的相关性。
我们可以计算不同变量之间的皮尔逊相关系数,从而了解它们之间的线性关系。
在接下来的分析中,我们可以使用SPSS的回归分析功能来探讨性别、年龄和每周学习时间对学习成绩的影响。
我们可以建立一个多元线性回归模型,从而探讨不同变量对学习成绩的预测作用。
最后,我们可以使用SPSS的图表功能来进行数据可视化分析。
我们可以绘制散点图、柱状图和折线图,从而直观地展示不同变量之间的关系和趋势。
通过以上步骤,我们可以利用SPSS对学生学习成绩的数据进行全面的分析,从而回答我们的研究问题。
在实际研究中,我们还可以进一步探讨其他统计分析方法,如方差分析、卡方检验等,以深入挖掘数据的内在规律。
总之,SPSS作为一款功能强大的统计分析软件,为社会科学研究提供了重要的数据分析工具。
通过本文的简单案例,希望读者能够对SPSS的数据分析功能有一个初步的了解,并能够在实际研究中灵活运用,从而为研究工作提供有力的支持。
spss统计分析与行业应用案例SPSS是一款统计分析软件,其强大的数据处理和分析功能,使得它在各个行业中得到广泛应用。
下面将以医疗行业为例,说明SPSS在统计分析中的应用。
在医疗行业中,SPSS可以用于患者数据的统计分析。
假设某医院想要研究某种疾病在不同年龄段的患病情况,可以通过SPSS对患者数据进行处理和分析。
首先,医院可以将收集到的病历数据导入SPSS,根据患者的年龄信息将数据进行分组。
然后,通过SPSS的交叉报表功能,可以统计每个年龄段的患者数量和患病率。
此外,SPSS还可以进行相关性分析,帮助医院了解患者年龄与疾病的相关性。
通过SPSS的相关性分析功能,医院可以知道年龄与患病风险是否存在关联,从而进一步为临床治疗提供参考依据。
SPSS还可以用于医院对医疗资源的分配和利用。
医院可以通过SPSS分析患者的挂号、住院和就诊数据,统计不同科室的就诊次数和人数。
通过对这些数据的分析,医院可以得到每个科室的就诊情况和资源利用情况。
比如,医院可以通过SPSS得知某个科室的就诊量过高,而其他科室的利用率较低,从而调整医疗资源的配置,提高资源利用效率。
此外,SPSS还可以通过群组分析功能,将患者按病情和诊断结果进行分类,从而为医院提供更精确的资源分配建议。
另外,SPSS在医学研究中也有广泛的应用。
医学研究常需要进行大量的数据处理和分析,SPSS可以提供相应的统计分析工具和技术支持。
例如,一个医学研究团队想要研究某种药物的疗效,可以通过SPSS对临床试验的数据进行统计分析。
首先,团队可以将试验数据导入SPSS,进行数据清洗和整理。
然后,通过SPSS的描述性统计和推论统计功能,可以对药物的疗效进行评估。
此外,SPSS还可以进行假设检验、回归分析等高级统计分析,帮助研究团队得出科学准确的结论。
综上所述,SPSS在医疗行业中的应用非常广泛。
无论是患者数据分析,医疗资源的分配和利用,还是医学研究数据的分析,SPSS都能提供合适的统计分析方法和工具。
大学生spss数据分析案例SPSS数据分析是大学生在进行学术研究和毕业论文撰写过程中常常需要掌握的技能之一。
本文将以一个实际案例为例,介绍如何使用SPSS软件进行数据分析,以帮助大学生更好地理解和运用SPSS进行数据处理和分析。
首先,我们需要明确案例研究的背景和目的。
假设我们要研究大学生学习成绩与每周学习时间的关系,我们收集了一批大学生的学习成绩和每周学习时间的数据,现在需要用SPSS进行分析。
第一步,我们需要导入数据。
在SPSS软件中,点击“文件”-“导入数据”-“从数据库导入数据”,选择相应的文件并导入数据。
第二步,进行数据清洗。
在数据清洗过程中,我们需要检查数据是否存在缺失值、异常值等情况,可以使用SPSS中的数据查看功能和描述统计功能进行检查和处理。
第三步,进行描述性统计分析。
在SPSS中,我们可以使用“描述统计”功能来计算学习成绩和每周学习时间的均值、标准差、频数分布等统计指标,以便对数据有一个整体的了解。
第四步,进行相关性分析。
我们可以使用SPSS中的“相关分析”功能来计算学习成绩和每周学习时间之间的相关系数,以判断它们之间是否存在显著的相关性。
第五步,进行回归分析。
如果我们想进一步探究学习成绩与每周学习时间之间的因果关系,可以使用SPSS中的“线性回归”功能来进行回归分析,得出它们之间的回归方程和相关系数。
最后,我们需要对分析结果进行解释和总结。
在解释和总结过程中,我们需要使用清晰、准确的语言对分析结果进行解释,并结合案例研究的背景和目的进行合理的总结和结论。
通过以上案例分析,我们可以看到,SPSS软件作为一款专业的统计分析工具,能够帮助我们快速、准确地进行数据分析,为我们的学术研究和毕业论文撰写提供了有力的支持。
希望本文能够对大学生在SPSS数据分析方面有所帮助,引起大家对SPSS数据分析的重视和学习兴趣。
SPSS相关分析案例讲解在社会科学研究中,统计分析是必不可少的工具之一。
SPSS(Statistical Package for the Social Sciences)作为一款专业的统计分析软件,被广泛应用于各种研究领域。
本文将通过一个案例来讲解SPSS中的相关分析方法及其应用。
案例背景:某研究小组想要探索学生的睡眠时间与其学业成绩之间是否存在相关性。
他们采集了一份包括学生的睡眠时间和学业成绩的数据,并希翼通过SPSS进行相关性分析,以验证他们的研究假设。
数据采集与准备:研究小组首先在一所中学中随机选取了100名学生作为研究对象。
他们使用问卷调查的方式采集了学生的睡眠时间和学业成绩数据。
睡眠时间以小时为单位,学业成绩以百分制表示。
在数据采集完成后,研究小组将数据输入SPSS软件进行分析。
相关性分析:在SPSS软件中,相关性分析可以匡助我们了解两个变量之间的关系。
为了进行相关性分析,我们首先需要检查数据的正态性和线性关系。
在这个案例中,我们可以通过绘制散点图来观察学生的睡眠时间和学业成绩之间的关系。
通过SPSS软件,我们可以很方便地进行散点图的绘制。
在绘制完成后,我们可以观察到散点图中的数据点是否具有明显的线性趋势。
如果数据点呈现出明显的线性关系,我们可以继续进行相关性分析。
在SPSS中,相关性分析可以通过计算皮尔逊相关系数来实现。
相关系数的取值范围为-1到1,其中-1表示彻底负相关,1表示彻底正相关,0表示没有相关性。
通过相关系数的计算,我们可以得到学生的睡眠时间和学业成绩之间的相关系数。
结果解读:在该案例中,通过SPSS进行相关性分析后,我们得到了一个相关系数为0.6。
这个结果表明学生的睡眠时间与其学业成绩之间存在中度正相关关系。
也就是说,睡眠时间较长的学生往往有较好的学业成绩。
进一步分析:除了计算相关系数,SPSS还可以进行更深入的相关性分析。
例如,我们可以通过假设检验来确定相关系数是否显著。
The Research and Analysis of Xiao MilaSchool: International BusinessMajor: International economy and trade class 1Member: 李雪竹41002021 夏鸿曲41002022黄丹妮41002062 丁桑妮41002064鲜铤41002036 李凯41002002梅琳41002003AbstractSince the catering enterprises actively developed in china, our team chooses one of the catering restaurants, Xiao Mila, located in the Liu Lang bay, closed to the east gate of SWUFE. It looks crowded and not very comfortable for eating hot pot. However, it is still very popular and competitive outside the East Gate and has a lot of regular customers. We decided to find out reasons for this odd phenomenon. As it is a typical catering restaurant in that area, the research gives us in-depth knowledge of catering restaurant in college student living area.Our article uses systematic research towards the operating condition of Xiao Mila. Our aims are to understand the in dividual catering businesses‟ operating condition, and at the same time supplement economic research, respond to our national twelfth five-year development plan, provide guidance for other catering enterprises. The investigative manner of this article is through the issuance of the form of questionnaire survey to the crowd who ate in the Xiao Mila. After the investigation, we use the statistics we got to analyze the research questions. The methods of analysis are quantitative analysis and qualitative analysis, the Comparative MethodOur conclusions of the reasons for Xiao Mila‟s success are its unique flavor, locality, and low price and its awesome reputation among students; the shortages of this restaurant are its inefficient service and poor sanitation. Our team also gets the conclusion that different in gender groups have different attitude towards to Xiao Mila. This difference do not only indicate the difference in female‟s and male‟s thinking patterns, but also point out the way for Xiao Mila to attract customers of a certain gender. Then through discussion, we come up with a suggestion that it should overcome its shortages while holding on to its best position in flavor and price.KeywordsXiao Mila; College Students; Consumption; Analysis; SWOT1. IntroductionAlong with the economy development and people's living standard improving, our tertiary industry especially catering industry is developing vigorously. Especially those young, good-tasted college students with appreciating ability,enjoyment demand, time and relatively plenty of money, have an increasing demand for catering. Canteen cannot satisfy their requirement, so the snack bars outside the university are developing prosperously. As one of the most popular restaurants among these shops, Xiao Mila‟s business model has strong research significance. It is located in the Liu Lang bay, closed to the east gate of SWUFE. It uses the form of buffet soup pot. With paying ten Yuan, everyone can get a gift dish and can get vegetables freely. As a shop with only two other shops, it has many customers. But the national twelfth five-year development planning emphasizes the development of the service industry. Therefore, the study of Xiao Mila‟s operati on state, is of great significant not only for economic research theory but also for the individual food businesses.This paper aims to have systematic research towards the operating condition of Xiao Mila. We investigate many factors such as the food taste, environment of dieting, health, location and so on, which appeal to typical customers like our college students. So as to understand the individual catering businesses‟ operating condition, and at the same time supplement economic research ,respond to our national twelfth five-year development plan, provide a guidance for other catering enterprises.This paper are divided into eight parts, respectively is the introduction, literature review, research method, data analysis and conclusions and enlightenment, references and appendix. We hope it can fully display Xiao Mila‟s performance!2. Literature reviewSince 1988, catering enterprises in China have actively explored the markets and promoted the popularization of the development of food industry and its development. Xiao Mila as a new local catering mode, there has been no person to do research on it. But from the former researches about catering enterprises we can see the reasons of Xiao Mil a‟s prosper ity. After the analysis about modern diners‟ consu mption psychology, Swiss expert concluded the tendency of food consumption. In the report, he pointed out that customers are more inclined to the restaurant of high quality but low costs, has various options and can enjoy with families and friends. I n Chi Jin‟s report in 2000, our dining market should pay more attention to level marketing. That is to change products appropriately to generate new use, new situation and new target market to create new categories, thus to redefine markets and create new requirements and value. So new type of catering mode like Xiao Mila can easily be accepted an loved by people. As Li Muming said in his report that the best way to attract customers is to be special.3. Methodology3.1 The proposing of problem and hypotheticThe report is aimed at analyzing of the management of Xiao Mila, a restaurant serving hot pot near SWUFE campus. In our first year in SWUFE, we made Xiao Mila a regular place for dining and having a treat. As we getting familiar with the small restaurant, we found it really below the standard of catering enterprises. However, it is still very popular and competitive outside the East Gate and has a lot of regular customers. We decided to find out reasons for this odd phenomenon.3.2 The selecting of research methodConsidering the actual situation and operability, we used random sampling survey to do the research. The survey had been done on May.22 2011 in Southwestern University of Finance and Economic .150 questionnaires were handed out, via Sojump and also in the class meeting of International Trade and Business. 127 questionnaires were collected and 86 of them were valid. The percentage of valid questionnaires is 67.7%.4. Sample and data analysis4.1 Pre-investigationTo test the validity of our questionnaires, we did an analysis for pre-investigation. During the process of pre-investigation, we asked students some questions about our questionnaires to know whether our questionnaires are easy to understand .Then we revise our questionnaires according to students‟ precious suggestions.The possible reasons for the imperfect questionnaire are three. First, we‟re supposed to use the quantitative research mode, but we didn‟t. So we gave people too much choice that it was difficult for them to choose answers and for us to collect data. Second, we didn‟t organize the questions well. We didn‟t divide them into several types. So it was difficult for us to analyze the answers. Last, the questi on types weren‟t enough for us to do the research of Xiao Mila systemically.4.2 TableThis table is designed to analyze the influence of grade on customers‟ choice.This table is designed to analyze the influence of gender.4.2 SWOT Analysis4.2.1 Strength4.2.1.1 Technology Strengthsa. Xiao Mila has a very special-tasted soup which contains various herbs and ingredients, beneficial to health to a certain degree.b. A free meat dish is offered for each custom, the more people joining the dining the more dishes treated.c. Xiao Mila, the traditional pepper used in Sichuan food, extremely hot, is used as the main ingredients of the sauce. It has an amazingly spicy taste that makes customers enjoying.4.2.1.2 Tangible Assets Strengths:a. Rustic decorating style with fake green vines hanging over head andbamboo tables and chairs creates a comfortable and relaxing dining atmosphere.b. An easily accessible location.4.2.1.3 Intangible Assets Strengths:a. Exclusive recipeb. Good public praisec. Brand image is generally built among the neighborhood.4.2.1.4 Human Resource Strengths:a. Warm-hearted and honesty employeesb. Specially-trained chief4.2.1.5 Organizational system Strengths:a. Loyal customer group4.2.1.6 Competition Capability Strengths:a. Overwhelming superiority of market share4.2.2 Weaknessa. Xiao Mila is so popular that there‟s always full of people. So customershave to wait for quite a long time to enjoy the delicious food.b. Waiters have unfriendly attitude. If you want to add tea or soup, youmust have waited a long time since you asked them.c. Cooks have low efficiency in preparing food.d. The food is not clean. The vegetables provided are always notwashed properly.e. The food provided for customers to get without paying are so simplexthat doesn‟t have constant attraction on customers.f. The account of gift food is small. And it has quite small size.g. The tableware is not clean.h. The repast environment is not so comfortable for people.4.2.3 Opportunitya. University will enlarge the amount of studentsb. Small market sharec. Customer has a high randomness of choosing canteend. Another Xiao Mila will close down4.2.4 Threata. The food industry in East Gate is very prosperous. There are many kinds ofsnack bars with specialty. Such as Wan Zhou roast fish, and various kinds of hot pots.b. Customers will gradually lose their interest in it because the free food typesin the shop are limited. The flavor of the hot pot of Xiao Mila never changes.So to think further, it is not perfect on attracting more customers.c. The canteen provides special kinds of hot pots, where students can enjoythemselves without spending too much money, and it is also more convenient, healthy and cheap.d. Another snack bar called Ye Dian Xiao Mila was opened last semester.From then on, some students choose that one for its more types of vegetables.4.3 linear regression analysesAccording to the date from questionnaire survey[数据集1]5. Results and discussionAfter the analysis, there are many factors that influence the operation of Xiao Mila. In general, it is affected by its flavor, price, location, decoration, service attitude, sanitation, customers‟ gender, food types, reputation.From the tabl e analysis, we can see grade, gender and address affect people‟s choice of the answers. From the SWOT analysis, we can see the advantages and disadvantages of Xiao Mila and conclude the opportunity and threat in its development.6. Conclusion6.1 Summarya. From the statistic we analyzed, we can draw the conclusion that thesuccess of Xiao Mila is directly related to its unique flavor, low price and its awesome reputation among students.b. What hold Xiao Mila back from getting greater success is its inefficientservice and poor sanitation. The statistic illustrates that more than two thirds of students are more or less dissatisfied with the service Xiao Mila offered and food sanitation.c. When it comes to the distance of Xiao Mila to the dormitory, the resultsdiffer a lot in terms of the different location of dormitory. From the statistic, it is obvious that students who live in the dormitory near the north gate havea greater dissatisfaction of Xiao Mila‟s location than students who live indormitory near the east gate.d. As the results of the questionnaire indicated, the decoration of thestorefront doesn‟t have a obvious impact on the Xiao Mila‟s operation. Most of the students we researched feel indifferent about the decoration of the storefront.e. In addition, we find out there is subtle difference in differ ent gender‟sattitude towards Xiao Mila: females are more dissatisfied with the poor sanitation and inefficient service than males, whereas males are more dissatisfied with the flavor of the soup pot. This difference do not only indicates the difference in female‟s and male‟s thinking patterns, but also point out the way for Xiao Mila to attract customers of a certain gender.f. According to the result of our questionnaires, we can see that the situationXiao Mila is in is quite paradoxical. On the one hand, Xiao Mila is not that perfect, for students are not satisfied with it in many aspects, especially the aspects of its poor sanitation and service. On the other hand, despite of its numerous weaknesses, Xiao Mila‟s special flavor and unfair advantage of its low price and still attract a lot of customers. If Xiao Mila wants to push its business to a higher level, it should overcome its shortage while holding on to its best position in flavor and price.6.2Suggestion6.2.1 About hardwarea. Expand the restaurant area to contain more people. Rent the nearingstorefront or transform the table setting to make space.b. Improve the decoration to create a more comfortable environment.c. Focus on the sanitation of the whole restaurant, especially the tables andaround the food shelves.6.2.2 About softwarea.Improve the variety and cleanness of food to meet the catering standard.b.Adopting employee training program to make them behave appropriately andwork with enthusiasm and efficiency.6.3ImplicationWe can find an indication through the analysis of the research. In the catering market, which has a variety of types, we can conclude that restaurant owners are not able to determine the consumption level but they are able to attract and keep customers by many other means. The Xiao Mila doesn‟t have rare ingredients or elegant decoration to attract customers. But it has successfully exerted popularity among innumerable college students. The college students are willing to queue for a long time to have meal in Xiao Mila. Just like a senior student in SWUFE said: “If you haven‟t been to Xiao Mila, you are likely to be out of fashion.” We have to say, indeed, Xiao Mila has performed successfully in catering market. And we can get many indications from it.In contemporary society, the catering industry is weak. Developing all kinds of luxury food, spending a big deal of money on advertising, and using all kinds of spices to make food more delicate, Traders have tried their best to attract customers. However, customers always only just have a try on their luxury food and then give it up. The reason is not that customers cannot afford the high price but they are afraid of the food which is full of unhealthy unknown spice. In this point, Xiao Mila does a great job. Its ingredients are both cheap and healthy. We can find that people turn to choose food that is good for their health and of a reasonable price. With its unique way, Xiao Mila wins more and more customers‟ hearts and establishes itself securely in position.In addition, compared with Ye Dian Xiao Mila, Zhu Juan Xiao Mila has perfect location. This example perfectly explains that as to a catering enterprise, accurate market positioning and realistic analysis do make a great sense to its success.Furthermore, not only for Xiao Mila, but also for whole catering industry,to attract more diners,the enterprises must assure their customer groups and position customer market. And they had better attach more importance to innovation, paying more attention to healthy food and its flavor. Only in this way can they fascinate new customers while keeping old customers and promote their catering brand.Also, we found some problems in our research of Xiao Mila. A lot of students complain about its poor service and terrible sanitation. Because there is only one cook in Xiao Mila, serving speed becomes its Achilles‟ heel. If those problems stay unsolved, even Xiao Mila‟s magical flavor cannot stop it fromstepping into its own grave. This potential dilemma also reminds other catering enterprises to establish a complete system of service and pay more attention to the division of labor and cooperation.6.4 ShortageIn this research, we get samples from students of SWUFE, while the research result is not common enough. As a liberal arts college, there is a low proportion of male students. And compared with female students of science academies or engineering college, the female students here are keener on perusing delicious food.Next, we handed out 127 pieces of questionnaire while only 86 pieces of them are valid. What‟s worse, most of the samples are from dormitory area which is close to the east gate, which made the research some limitations.In the process of analyzing, as lacking of professional knowledge, we are incapable of using a more advanced research method7. ReferenceDong Hong …an.(2010).Our dining enterprise level marketing strategy research.Liu Xinfeng & Feng Yuzhu(2011). Chinese catering economic research review in recent years.Li Muming(2010). Way of keeping customers.Government.(2010). CPC central committee about formulate national economic and social development of the twelfth five-year plan suggestion.Chi Jin.(2000). Several problems of the development in catering enterprises.8. Appendix8.1 Questionnaire8.1.1 Questionnaire of pre-investigation关于财大东门小米辣顾客满意度的调查问卷1.如果您到小米辣就餐,您最注重以下哪些方面(限选3项)A.食品质量B.就餐环境C.知名度D.服务质量E.所在位置F.口味与品种G.卫生程度H.其他2.您对小米辣所提供的食品的满意程度如何A.卫生程度B.菜肴质量C.营养价值D.菜肴口味E.菜肴价位F.菜式种类3.您对小米辣的就餐环境满意度如何A.卫生条件B.装修格调C.文化气息D.地理位置E.就餐气氛F.家具与餐具4.您对小米辣的员工服务满意吗A.服务态度B.服务效率C.服务主动性D.服务准确性E.服务及时性F.员工个人素质5.需要改进的地方A.食品质量B.就餐环境C.知名度D.服务质量E.所在位置F.口味与品种G.卫生程度H.其他6.在什么情况下你会选择去小米辣和TA约会A.同学聚餐B.班级活动C.缺乏蔬菜补给D.想吃了E.荷包窘迫8.1.2 Final questionnaire关于财大东门小米辣顾客满意度的调查问卷财大东门餐馆云集,竞争激烈,而“猪圈小米辣”因其独特的口味和良好的口碑赢得了超高人气。