Chapter 8 Capital Budgeting Decision Criteria:8章资本预算决策标准
- 格式:doc
- 大小:54.50 KB
- 文档页数:13


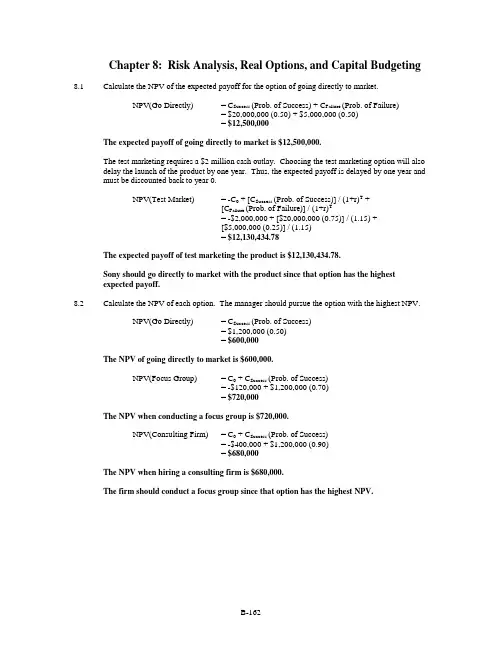
Chapter 8: Risk Analysis, Real Options, and Capital Budgeting 8.1Calculate the NPV of the expected payoff for the option of going directly to market.NPV(Go Directly) = C Success (Prob. of Success) + C Failure (Prob. of Failure)= $20,000,000 (0.50) + $5,000,000 (0.50)= $12,500,000The expected payoff of going directly to market is $12,500,000.The test marketing requires a $2 million cash outlay. Choosing the test marketing option will also delay the launch of the product by one year. Thus, the expected payoff is delayed by one year and must be discounted back to year 0.NPV(Test Market) = -C0 + [C Success (Prob. of Success)] / (1+r)T +[C Failure (Prob. of Failure)] / (1+r)T= -$2,000,000 + [$20,000,000 (0.75)] / (1.15) +[$5,000,000 (0.25)] / (1.15)= $12,130,434.78The expected payoff of test marketing the product is $12,130,434.78.Sony should go directly to market with the product since that option has the highestexpected payoff.8.2Calculate the NPV of each option. The manager should pursue the option with the highest NPV.NPV(Go Directly) = C Success (Prob. of Success)= $1,200,000 (0.50)= $600,000The NPV of going directly to market is $600,000.NPV(Focus Group) = C0 + C Success (Prob. of Success)= -$120,000 + $1,200,000 (0.70)= $720,000The NPV when conducting a focus group is $720,000.NPV(Consulting Firm) = C0 + C Success (Prob. of Success)= -$400,000 + $1,200,000 (0.90)= $680,000The NPV when hiring a consulting firm is $680,000.The firm should conduct a focus group since that option has the highest NPV.8.3Recommend the strategy that has the highest NPV.NPV(Lower Prices) = C Success (Prob. of Success) + C Failure (Prob. of Failure)= -$1,300,000 (0.55) - $1,850,000 (0.45)= -$1,547,500NPV(Lobbyist) = C0 + C Success (Prob. of Success) + C Failure (Prob. of Failure)= -$800,000 - $0 (0.75) - $2,000,000 (0.25)= -$1,300,000The CFO should hire the lobbyist since that option has the highest NPV.8.4Since the NPV of Research is greater than that of no research, based on expected outcomes, B&Bshould go directly to market.$3 million at t = 0Note: Research = –1 million investment + 0.7 * (26.087) if successful + 0.3 * (2.6087) if unsuccessful No Research = 0.55 * (30) if successful + 0.45 * (3) if unsuccessful8.5Carl should have taken the $5,000.Expected return for 1% of movie profits is $3,000. Since only good scripts are made into movies and only a good movie would make a profit: (10% x 30% x $10 mil x 1%)Movie studio decision tree:B-1648.6 Apply the accounting profit break-even point (BEP) formula and solve for the sales price, x, thatallows the firm to break even when producing 20,000 calculators. In order for the firm to breakeven, the revenues from the calculator sales (number of calculators sold sales price per unit)must equal the total annual cost of producing the calculators. Remember to include taxes in theanalysis.Variable costs = $15 per calculatorFixed costs = $900,000 per yearDepreciation = (Initial Investment / Economic Life)= ($600,000 / 5)= $120,000 per yearDivide the after-tax sum of the depreciation expense and the fixed costs by the calculator’s after-tax contribution margin (selling price, x, minus variable cost). The after-tax contribution margin is the amount that each additional calculator contributes to the firm’s profit. Before the firm canrealize a positive profit, it must have earned enough to cover its fixed costs and depreciationexpense. Solve for x.[(Fixed Costs + Depr.) (1–T c)] / [(Sales Price - Variable Cost) (1-T c)] = BEP[($900,000 + $120,000) (1 – 0.30)] / [(x - $150) (1 – 0.30)] = 20,000x= $66 The break-even sales price of the calculator is $66.8.7 Apply the accounting profit break-even point formula. Divide the after-tax sum of the annualdepreciation expense and the annual fixed costs by the television’s after-tax contribution margin(selling price minus variable cost).[(Fixed Costs + Depr.) (1–T c)] / [(Sales Price - Variable Cost) (1-T c)] = BEP[($120,000 + $20,000) (1 -0.35)] / [($1,500 - $1,100) (1 - 0.35)] = 350 The distributor must sell 350 televisions per year to break even.8.8 a. Apply the accounting profit break-even point formula. Divide the after-tax sum of thefixed costs and depreciation charge by the abalone’s after-tax contribution margin(selling price minus variable cost). The number of abalones that the proprietor must sellin order for you to receive any profit is the break-even point (BEP).[(Fixed Costs + Depr.) (1–T c)] / [(Sales Price – Variable Cost) (1-T c)] = BEP[($340,000 + $20,000) (1 – 0.35)] / [($2.00 - $0.72) (1 – 0.35)]= 281,250The proprietor must sell at least 281,250 abalones per year in order for you toreceive any profit.b. To calculate the amount of profit you will receive if the proprietor sells 300,000 abalones,subtract the total cost incurred from the total revenue received. Remember to includetaxes.Total Revenue Per Year = (Sales Price) (Number Sold) (1 – T c)= ($2.00) (300,000) (1 – 0.35)= $390,000Total Cost Per Year = [Fixed Cost + Deprc. + (Variable Cost) (Number Sold)] (1-T c)= [$340,000 + $20,000 +($0.72) (300,000)] (1 – 0.35)= $374,400Total Profit = Total Revenue – Total Cost= $390,000 - $374,400= $15,600You will receive $15,600 if the proprietor sells 300,000 abalones.8.9 Played 2187.5 = CEILING ((1000 + 50)/(0.5-0.02),1)8.10 a) ()()()()()()()()shirts-T10003.18103.1000,2Tc-1costVariable-priceSalesTc-1onDepreciatiCostFixed=-⨯--⨯+=⨯⨯+b) ()()()()()()()()shirts-T29743.18104018.2/000,10Tc-1costVariable-priceSalesTconDepreciatiTc1costFixedEAC=-⨯-++=⨯⨯+-⨯+8.11 When calculating the present value break-even point, express the initial investment of $140,000 asan equivalent annual cost (EAC). Divide the initial investment by the seven-year annuity factor,discounted at 15 percent. The EAC incorporates the opportunity cost of the investment.EAC = Initial Investment / A T r= $140,000 / A70.15= $33,650.45Calculate the annual depreciation expense.Depreciation = $140,000 / 7= $20,000Calculate the present-value break-even point. The fixed costs are $340,000. Remember toincorporate taxes into the calculation. Remember to include the depreciation tax shield, whichlowers the firm’s tax bill.[EAC+(Annual Fixed Costs) (1 - T c) – (Annual Depr.) (T c)] / [(Sales Price – Variable Cost) (1 – T c)]= BEP[$33,650.45 + $340,000 (0.65) - $20,000 (0.35)] / [($2 - $0.72) (0.65)] =297,656.79≅ 297,657 units The present value break-even point is 297,657 abalones.8.12 When calculating the present value break-even point, express the initial investment of $200,000 asan equivalent annual cost (EAC). Divide the initial investment by the five-year annuity factor,discounted at 12 percent.EAC = Initial Investment / A T r= $200,000 / A50.12= $55,481.95Calculate the annual depreciation expense.Depreciation = $200,000 / 5= $40,000Calculate the present-value break-even point.[EAC+(Fixed Costs) (1 - T c) – (Depr.) (T c)] / [(Sales Price – Variable Cost) (1 – T c)]= BEP[$55,481.95 + ($350,000) (0.75) – ($40,000) (0.25)] / [($25 - $5) (0.75)] = 20,532.13 The present value break-even point is 20,532 units.8.13 The following represents a different approach to solving present-value break-even problems,unlike the EAC method used in problems 8.8 and 8.7.Both the EAC approach and this approach will yield the same answer.First, determine the cash flow from selling the old harvester. When calculating the salvage value, remember that tax liabilities or credits are generated on the difference between the resale value and the book value of the asset.Use the original purchase price of the old harvester to determine annual depreciation.Depreciation Per Period = $45,000 / 15= $3,000Since the machine is five years old, the firm has accumulated five annual depreciation charges,reducing the book value of the machine. The current book value of the machine is equal to theinitial purchase price minus the accumulated depreciation.Book Value = Initial Purchase Price – Accumulated Depreciation= $45,000 – ($3,000 ⨯ 5 years)= $30,000Since the firm is able to resell the old harvester for $20,000, which is less than the $30,000 bookvalue of the machine, the firm will generate a tax credit on the sale.PV(Resale Value) = C - T C (Resale Value – Book Value)= $20,000 – 0.34 ($20,000 - $30,000)= $23,400Calculate the incremental depreciation. Calculate the depreciation tax shield generated by the new harvester less the forgone depreciation tax shield from the old harvester. Let P be the break-even purchase price.Depreciation Tax Shield, New Harvester = (Initial Investment / Economic Life) ⨯ T c= (P / 10) (0.34)Depreciation Tax Shield, Old Harvester = ($45,000 / 15) (0.34)= ($3,000) (0.34)Incremental Depreciation Tax Shield = (P / 10 - $3,000) (0.34)Apply the 10-year annuity formula, discounted at 15 percent, to calculate the PV of theincremental depreciation tax shield.PV(Depreciation Tax Shield) = (P / 10 - $3,000) (0.34) A100.15 The new harvester will generate year-end pre-tax cash flow savings of $10,000 per year for 10years. Apply the 10-year annuity formula, discounted at 15 percent, to find the PV of thosesavings. Remember to include taxes.PV(Savings) = (1 – T c) C1 A T r= (1 - 0.34) $10,000 A100.15= $33,123.87The break-even purchase price of the new harvester is the price, P, which makes the NPV of themachine equal to zero.NPV = -P + PV(Resale Value) + PV(Depreciation Tax Shield) + PV(Savings)$0 = -P + $23,400 + (P / 10 - $3,000) (0.34) A100.15 + $33,123.87P= $61,981.06The break-even purchase price is $61,981.06.8.14 A 5,0.08 3.993EAC 75,136,936Depreciation 60,000PVBreak-Even 3,5188.15 a. Pessimistic:Calculate the NPV of the pessimistic scenario. First, determine the yearly cash flow.Cash Flow = [Revenue - Variable Costs – Fixed Costs] (1 – T c) + Depr. Tax Shield= [($38 ⨯ 23,000) – ($21 ⨯ 23,000) - $320,000] (1- 0.35) +($420,000 / 7) (0.35)= $67,150Apply the seven-year annuity formula to calculate the NPV of the machine. Subtract theinitial investment.NPV = C0 + C1 A T r= -$420,000 + $67,150 A70.13= -$123,021.71The NPV of the pessimistic scenario is -$123,021.71.Expected:Calculate the NPV of the expected scenario. First, determine the yearly cash flow.Cash Flow = [Revenue - Variable Costs – Fixed Costs] (1 – T c) + Depr. Tax Shield= [($40 ⨯ 25,000) – ($20 ⨯ 25,000) - $300,000] (1- 0.35)+ ($420,000 / 7) (0.35)= $151,000Apply the seven-year annuity formula to calculate the NPV of the machine. Subtract theinitial investment.NPV = C0 + C1 A T r= -$420,000 + $151,000 A70.13= $247,814.18The NPV of the expected scenario is $247,814.18.Optimistic:Calculate the NPV of the optimistic scenario. First, determine the yearly cash flow.Cash Flow = [Revenue – Variable Costs – Fixed Costs] (1 – T c)+ Depreciation Tax Shield= [($42 ⨯ 27,000) – ($19 ⨯ 27,000) - $280,000] (1- 0.35)+ ($420,000 / 7) (0.35)= $242,650Apply the seven-year annuity formula to calculate the NPV of the machine. Subtract theinitial investment.NPV = C0 + C1 A T r= -$420,000 + $242,650 A70.13= $653,146.42The NPV of the optimistic scenario is $653,146.42.b. Calculate the expected NPV of the project to form your conclusion about the project.Remember that, since each scenario is equally likely, the expected NPV is the average ofthe three scenarios.NPV = [NPV(Pessimistic) + NPV(Expected) + NPV(Optimistic)] / (3)= [-$123,021.71 + $247,814.18 + $653,146.42] / 3= $259,312.96The expected NPV of the project is $259,312.96. You should conclude that theproject is worthwhile.8.16 Pessimistic:Calculate the NPV of the pessimistic scenario. First, determine the yearly cash flow. Todetermine the number of rackets sold, multiply the market size by the market share.Number of Rackets = Market Size ⨯ Market Share= 110,000 ⨯ 0.22= 24,200Cash Flow = [Revenue – Variable Costs – Fixed Costs] (1 – T c)+ Depreciation Tax Shield= [$115 ⨯ 24,200 - $72 ⨯ 24,200 - $850,000] (1 – 0.4)+ ($1,500,000 / 5) (0.4)= $234,360Apply the five-year annuity formula to calculate the NPV of the racket project. Subtract the initial investment.NPV = C0 + C1 A T r= -$1,500,000 + $234,360 A50.13= -$675,701.68Expected:Calculate the NPV of the expected scenario. First, determine the yearly cash flow. To determine the number of rackets sold, multiply the market size by the market share.Number of Rackets = Market Size ⨯ Market Share= 120,000 ⨯ 0.25= 30,000Cash Flow = [Revenue – Variable Costs – Fixed Costs] (1 – T c)+ Depreciation Tax Shield= [$120 ⨯ 30,000 - $70 ⨯ 30,000 - $800,000] (1 – 0.4)+ ($1,500,000 / 5) (0.4)= $540,000Apply the five-year annuity formula to calculate the NPV of the racket project. Subtract the initial investment.NPV = C0 + C1 A T r= -$1,500,000 + $540,000 A50.13= $399,304.88Optimistic:Calculate the NPV of the optimistic scenario. First, determine the yearly cash flow. To determine the number of rackets sold, multiply the market size by the market share.Number of Rackets = Market Size ⨯ Market Share= 130,000 ⨯ 0.27= 35,100Cash Flow = [Revenue – Variable Costs – Fixed Costs] (1 – T c)+ Depreciation Tax Shield= [$125 ⨯ 35,100 - $68 ⨯ 35,100 - $750,000] (1 – 0.4)+ ($1,500,000 / 5) (0.4)= $870,420Apply the five-year annuity formula to calculate the NPV of the racket project. Subtract the initial investment.NPV = C0 + C1 A T r= -$1,500,000 + $870,420 A50.13= $1,561,468.43Calculate the expected NPV of the project. Since each scenario is equally likely, the expectedNPV is the average of the three scenarios.NPV = [NPV(Pessimistic) + NPV(Expected) + NPV(Optimistic)] / (3)= [-$675,701.68 + $399,304.88 + $1,561,468.43] / (3)= $428,357.21The expected NPV of the project is $428,357.21. You should accept the project.8.17 Holding all variables as expected, except a single sensitivity analysis variable that is held atpessimistic or optimistic.Since under all scenarios NPVs come out positive, the project should be taken.8.18B-172Optimistic8.19 a. Apply the 10-year annuity formula, discounted at 10 percent, to calculate the NPV of thevideo game.NPV = C0 + C1 A T r= -$4,000,000 + $750,000 A100.1= $608,425.33The NPV of the video game is $608,425.33.b.Calculate the revised NPV of the project. The firm expects to receive net cash flow of$750,000 at the end of the first year of operations. Discount that value back one period toyear 0.PV(Year 1 Cash Flow) = C1 / (1+r)T= $750,000 / (1.1)= $681,818.18For the next nine years, the firm has a 50 percent chance of receiving annual cash flowsof $1,500,000 and a 50 percent chance of receiving annual cash flows of $0. Should thefirm receive cash flows of $0, the firm should exercise the option of abandonment andreceive the $200,000 cash flow. The probability of exercising that option is 50 percent.Calculate the expected PV of the revised cash flows by applying the nine-year annuityformula. To calculate the expected PV as of year 0, discount that value back one periodto year 0. The option is exercised in year 1 and must also be discounted back one periodto year 0.PV(Revised) = (Prob. ⨯ C2⨯ A T r + Prob. ⨯ Salvage) / (1+r)T= (0.5 ⨯ $1,500,000 ⨯ A90.1 + 0.5 ⨯ $200,000) / (1.1)= $4,017,516.23After including the initial investment, the revised NPV of the project is equal to the sumof the first year’s cash flow, the PV of the expected cash flows for the next nine years,and the expected value of abandoning the project.Revised NPV = C0 + C1 / (1+r)T +[(Prob. ⨯ C2⨯ A T r) + (Prob. ⨯ C2)] / (1+r)T= -$4,000,000 + $750,000 / (1.1) +(0.5 ⨯ $1,500,000 ⨯ A90.1 + 0.5 ⨯ $200,000) / (1.1)= $699,334.42The revised NPV is $699,334.42.c. The market value of the project, M, is the NPV of the project without an option toabandon plus the value of the option, Opt. The NPV of the project without the option toabandon was calculated in part (a). The difference between the NPV as calculated in part(a) and the revised NPV is equal to the option value of abandonment, Opt.M= NPV + Opt$699,334.42 = $608,425.33+ Opt$90,909.09 = OptThe option value of abandonment is $90,909.09.8.20 a. Apply the 10-year annuity formula, discounted at 20 percent to calculate the NPV of theproject. Total annual net cash flow is $200,000,000.NPV = C0 + C1 A T r= -$100,000,000 + $200,000,000 A100.2= $738,494,417.11The NPV of the project is $738,494,417.11.b.Allied Products should abandon the project if the PV of the revised cash flows for thenext nine years is less than the project’s scrap value. Since the option to abandon theproject occurs in year 1, discount the revised cash flows to year 1 as well. To determinethe level of expected cash flows below which Allied should abandon the project,calculate the equivalent annual cash flows the project must earn to equal the scrap value,$50 million. Set the scrap value equal to a nine-year annuity, discounted at 20 percent.Solve for C1.Scrap Value = C1 A T r$50,000,000 = C1 A90.2$50,000,000 / A90.2= C1$12,403,973.08 = C1The firm should abandon the project after the first year if the revised expectedannual cash flows are below $12,403,973.08. Below that level, the firm is better offabandoning the project and receiving the $50 million scrap value of the project.8.21 a. NPV (1.932) = –10 + 10*0.3*(1/0.25-1/0.25*(1/1.25)5)b. Option Value 2.000 = 0.5*9/1.25New NPV 0.068 = –10 + 10*0.3/1.25 + 0.5*15*0.3*(1/0.25 –1/0.25*(1/1.25)4)/(1.25) + 0.5*9/1.25B-175。


Chapter 8Fundamentals of Capital BudgetingNote:All problems in this chapter are available in MyFinanceLab. An asterisk (*) indicates problems with a higher level of difficulty.1.Plan: We can compute the total capitalization of the machine by adding the total cost oftransporting and installing the machine to the initial cost of purchasing the machine, and thiswill provide us with the total cost of the machine that we must appreciate over the 5 years of themachine’s life. In order to compute the annual depreciation expense of the machine we can thentake the total capitalization of the machine and divide it by the depreciable life of the machine.Execute:Capitalization of machine: $10,050,000Annual depreciation expense: 10,050,000/5 = $2,010,000Evaluate: Rather than expensing the $10,050,000 it costs to buy, ship, and install the machinein the year it was bought, accounting principles require you to depreciate the $10,050,000 overthe depreciable life of the equipment. Assuming the equipment has a 5-year depreciable life andthat we use the straight-line method, we would expense $10,050,000/5 = $2,010,000 per year for five years. The idea is to match the cost of acquiring the machine to the timing of the revenuesit generates.2.Plan: We need four items to calculate incremental earnings: (1) incremental revenues,(2) incremental costs, (3) depreciation, and (4) the marginal tax rate.Execute:= (Revenues − Costs − Depreciation) × (1 − tax rate)earningsAnnualincrementalearningsincrementalAnnual=−−×−=(4 1.2 2.01)(10.35)$513,500Evaluate: These incremental earnings are an intermediate step on the way to calculating theincremental cash flows that would form the basis of any analysis of the project. The cost of theequipment does not affect earnings in the year it is purchased, but does so through the depreciation expense in the following five years. Note that the depreciable life, which is based on accountingrules, does not have to be the same as the economic life of the asset—the period over which itwill have value.90 Berk/DeMarzo/Harford • Fundamentals of Corporate Finance3. Plan: We can compute the incremental revenues by taking the percentage increase in sales ofthe 100,000 units multiplied by the $20 sales price per unit.Execute: Incremental revenues =××=(0.20100,000)$20$400,000.Evaluate: A new product typically has lower sales initially, as customers gradually becomeaware of the product. Sales will then accelerate, plateau, and ultimately decline as the productnears obsolescence or faces increased competition. Similarly, the average selling price of aproduct and its cost of production will generally change over time. Prices and costs tend to risewith the general level of inflation in the economy.4.Plan: We can compute the level of incremental sales associated with introducing the new pizzaassuming that customers will spend the same amount on either version by using the sales of the new pizza and the lost sales of the original pizza (40% of customers who switched to the newpizza multiplied by the $20 million in new sales).We can compute the level of incremental sales associated with introducing the new pizzaassuming that 50% of the customers will switch to another brand by using the sales of the newpizza and the lost sales of the original pizza from the customers who would not have switchedbrands.Execute:a. Sales of new pizza − lost sales of original = 20 − 0.40(20) = $12 million.b. Sales of new pizza − lost sales of original pizza from customers who would not have switchedbrands = 20 − 0.50(0.40)(20) = $16 million.Evaluate: More incremental sales are generated if 50% of the customers who will switch fromPisa Pizza’s original pizza to its healthier pizza will switch to another brand if Pisa Pizza doesnot introduce a healthier pizza than just the incremental sales associated with introducing thenew pizza. A new product typically has lower sales initially, as customers gradually becomeaware of the product. Sales will then accelerate, plateau, and ultimately decline as the productnears obsolescence or faces increased competition. Similarly, the average selling price of aproduct and its cost of production will generally change over time. Prices and costs tend to risewith the general level of inflation in the economy.5. Plan: We need four items to calculate incremental earnings: (1) incremental revenues,(2) incremental costs, (3) depreciation, and (4) the marginal tax rate.Execute:Year 1 2 Incremental Earnings Forecast ($000s)1 Sales of Mini Mochi Munch 9,000 7,000Sales 2,000 2,0002 Other3 Cost of Goods Sold (7,350) (6,050)2,9504 Gross Profit 3,6505 Selling, General & Admin. (5,000) —6 Depreciation — —2,9507 EBIT (1,350)8 Income tax at 35% 473 (1,033)9 Unlevered Net Income (878) 1,918Chapter 8 Fundamentals of Capital Budgeting 91 Evaluate: These incremental earnings are an intermediate step on the way to calculating the incremental cash flows that would form the basis of any analysis of the project. The cost of the equipment does not affect earnings in the year it is purchased, but does so through thedepreciation expense in the following five years. Note that the depreciable life, which is based on accounting rules, does not have to be the same as the economic life of the asset—the period over which it will have value. Net income is negative in the first year because the additional selling, general, and administrative costs occurred only in the first year.6. Plan: We can compute the incremental impact on this year’s EBIT of the drop in price bysubtracting the gross profit without the price drop from the gross profit with the price drop.We can compute the incremental impact on EBIT for the next three years of a price drop in the first year from the additional sales on ink cartridges by finding the change in EBIT from ink cartridge sales, which will be the incremental impact on EBIT for years 2 and 3. Note that for year one, we must remember to subtract the incremental impact on EBIT from the price drop in year one.Execute:a. Change in EB I T = Gross profit with price drop − Gross profit without price drop= 25,000 × (300 − 200) − 20,000 × (350 − 200)=−$500,000b. Change in EBIT from ink cartridge sales = 25,000 × $75 × 0.70 − 20,000 × $75 × 0.70= $262,500T herefore, incremental change in EBIT for the next three years is− 500,000 =−$237,500Year1: $262,5002: $262,500Year3: $262,500YearEvaluate: A new product typically has lower sales initially, as customers gradually become aware of the product. Sales will then accelerate, plateau, and ultimately decline as the product nears obsolescence or faces increased competition. Similarly, the average selling price of a product and its cost of production will generally change over time. Prices and costs tend to rise with the general level of inflation in the economy.7. Plan: The difference between incremental earnings and incremental free cash flows is driven bythe equipment purchased. We need to recognize the cash outflow associated with the purchase in year 0 and add back the depreciation expenses from years 1 to 5, as they are not actually cash outflows.Execute:Free cash flows = After-tax earnings + depreciation − capital expenditures − changes in NWC FCF (this year) =−$10,050,000FCF (for each of the next five years) = 513,500 + 2,010,000 = $2,523,500Evaluate: By recognizing the outflow from purchasing the equipment in year 0, we account for the fact that $10,050,000 left the firm at that time. By adding back the depreciation expenses in years 1 to 5, we adjust the incremental earnings to reflect the fact that the depreciation expense is not a cash outflow.92 Berk/DeMarzo/Harford • Fundamentals of Corporate Finance8. Plan: We can project the net working capital needed for this operation by adding cash, inventory,and receivables and subtracting payables.Execute: Net working capital in this problem is the sum of Cash, Accounts Receivable, and Inventory (Lines 1, 2, and 3 below) less Accounts Payable (Line 4). Line 5 is net workingcapital and Line 6 is the changes in working capital from year to year. For example, net working capital in year 1 was 14 and in year 2 it grew to 19, so the increase in NWC, as computed on Line 6 for year 2, is 5. The firm must add 5 to working capital in year 2, so it represents a reduction in cash flow available to investors.Year 0Year 1Year 2 Year 3 Year 4 Year 51 Cash 6 12 15 15 15 2 Accounts Receivable 21 22 24 24 24 3 I nventory 5 7 10 12 13 4 Accounts Payable18 22 24 25 30 5 Net working capital (1 + 2 + 3 − 4) 0 14 19 25 26 226 Increase in NWC−14−5−6−1 4Evaluate: Most projects will require the firm to invest in net working capital. We care about networking capital because it reflects a short-term investment that ties up cash flow that could be used elsewhere. Note that whenever net working capital increases, reflecting additional investment in net working capital, it represents a reduction in cash flow that year.9. Plan: In order to compute the net working capital for each year we need to compute the receivables and payables for each year as a percentage of sales and COGS (receivables are 15% of sales, and payables are 15% of COGS).Execute:0 1 2 3 4 Sales $23,500 $26,438 $23,794 $8,566COGS $ 9,500 $10,688 $ 9,619 $3,463 Receivables: $0 $ 3,525 $ 3,966 $ 3,569 $1,285Payables: $0 $ 1,425 $ 1,603 $ 1,443 $ 519 NWC: $0 $ 2,100 $ 2,363 $ 2,126 $ 765Δ NWC (Required Investment): $ 2,100$ 263−$ 236 −$1,364Evaluate: Most projects will require the firm to invest in net working capital. We care about networking capital because it reflects a short-term investment that ties up cash flow that could be used elsewhere. Note that whenever net working capital increases, reflecting additional investmentin net working capital, it represents a reduction in cash flow that year.Chapter 8 Fundamentals of Capital Budgeting 9310. Plan: We need four items to calculate incremental earnings: (1) incremental revenues,(2) incremental costs, (3) depreciation, and (4) the marginal tax rate.Earnings include non-cash charges, such as depreciation, but do not include the cost of capital investment. To determine the project’s free cash flow from its incremental earnings, we mustadjust for these differences. We need to add back depreciation to the incremental earnings torecognize the fact that we still have the cash flow associated with it.Execute:Solution: Note—we have assumed any incremental cost of goods sold is included as part ofoperating expenses.a.Year 1 2 Incremental Earnings Forecast ($000s)1 Sales 125.0 160.02 Operating Expenses (40.0) (60.0)3 Depreciation (25.0) (36.0)64.04 EBIT 60.05 Income tax at 35% (21.0) (22.4)6 Unlevered Net Income 39.0 41.6b.Free Cash Flow ($000s) 1 27 Plus: Depreciation 25.0 36.08 Less: Capital Expenditures (30.0) (40.0)9 Less: Increases in NWC (5.0) (8.0)10 Free Cash Flow32.0 29.6Evaluate: These incremental earnings are an intermediate step on the way to calculating theincremental cash flows that would form the basis of any analysis of the project. Earnings are an accounting measure of the firm’s performance. They do not represent real profits, and a firmneeds cash. Thus, to evaluate a capital budgeting decision, we must determine its consequences for the firm’s available cash.11. Plan: Earnings include non-cash charges, such as depreciation, but do not include the cost ofcapital investment. To determine the project’s free cash flow from its incremental earnings, we must adjust for these differences. We need to add back depreciation to the incremental earnings to recognize the fact that we still have the cash flow associated with it.Execute: FCF = Unlevered Net Income + Depreciation − CapEx − Increase in NWC = 250 +100 − 200 − 10 = $140 million.Evaluate: Earnings are an accounting measure of the firm’s performance. They do not represent real profits, and a firm needs cash. Thus, to evaluate a capital budgeting decision, we mustdetermine its consequences for the firm’s available cash.94 Berk/DeMarzo/Harford • Fundamentals of Corporate Finance12. This opportunity cost lowers the incremental earnings of Home net by the after-tax earnings thatthey would have otherwise earned had they rented out the space instead. This would be a decrease in incremental earnings of 200,000 × (1 − 0.40) = $120,000 per year for the 4 years.*13. Plan: Incremental revenues: 0 I ncremental costs: −150,000 Depreciation: $10,000 per year Capital Gain on Salvage: $50,000 − $0 = $50,000 Cash flow from salvage value: +50,000 − (50,000)(0.45) = 27,500Execute: Replacing the machine increases EBITDA by 40,000 − 20,000 = 20,000. Depreciationexpenses rises by $15,000 − $10,000 = $5,000. Therefore, FCF will increase by (20,000) × (1 − 0.45) + (0.45)(5,000) = $13,250 in years 1 through 10.In year 0, the initial cost of the machine is $150,000. Because the current machine has a book value of $110,000 − 10,000 (one year of depreciation) = $100,000, selling it for $50,000generates a capital gain of 50,000 − 100,000 = −50,000. This loss produces tax savings of 0.45 × 50,000 = $22,500, so that the after-tax proceeds from the sales including this tax savings is $72,500. Thus, the FCF in year 0 from replacement is −150,000 + 72,500 = −$77,500. NPV of replacement = −77,500 + 13,250 × (1/0.10)(1 − 1/1.1010) = $3,916. There is a small profit from replacing the machine.Evaluate: Even though the decision has no impact on revenues, it still matters for cash flows because it reduces costs. Further, both selling the old machine and buying the new machine involve cash flows with tax implication.*14. Plan: We can use Eq. (8.5) to evaluate the free cash flows associated with each alternative. Notethat we only need to include the components of free cash flows that vary across each alternative. For example, since NWC is the same for each alternative, we can ignore it.Execute: The spreadsheet below computes the relevant FCF from each alternative. Note that each alternative has a negative NPV—this represents the PV of the costs of each alternative. We should choose the one with the highest NPV (lowest cost), which in this case is purchasing the existing machine. a. See spreadsheet.12345678910Rent Machine1 Rent (50,000) (50,000)(50,000)(50,000)(50,000)(50,000)(50,000)(50,000) (50,000) (50,000)2 FCF (rent) (32,500) (32,500)(32,500)(32,500)(32,500)(32,500)(32,500)(32,500) (32,500) (32,500)3 NPV at 8%(218,078)Purchase Current Machine4 Maintenance (20,000) (20,000)(20,000)(20,000)(20,000)(20,000)(20,000)(20,000) (20,000) (20,000)5 Depreciation 21,429 21,42921,429 21,429 21,429 21,429 21,429 — — —6 Capital Expenditures (150,000)7 FCF (purchase current)(150,000) (5,500) (5,500)(5,500)(5,500)(5,500)(5,500)(5,500)(13,000) (13,000) (13,000)8 NPV at 8%(198,183)ContinuedChapter 8 Fundamentals of Capital Budgeting 950 1 2 3 4 5 6 7 8 9 10 Purchase Advanced Machine9 Maintenance (15,000)(15,000)(15,000)(15,000)(15,000)(15,000) (15,000) (15,000) (15,000)(15,000)10 Other Costs (35,000) 10,000 10,000 10,000 10,000 10,000 10,000 10,000 10,000 10,000 10,00011 Depreciation 35,714 35,714 35,714 35,714 35,714 35,714 35,714 — — —12 Capital Expenditures (250,000)13 FCF (purchase advanced) (272,750) 9,250 9,250 9,250 9,250 9,250 9,250 9,250 (3,250) (3,250)(3,250)14 NPV at 8%(229,478)b. See spreadsheet.Evaluate: When evaluating a capital budgeting project, financial managers should make thedecision that maximizes NPV. In this case Beryl’s Iced Tea should purchase the current machine because it has the lowest negative NPV.Plan: Compute the depreciation charges and the book value of the asset during each of the five 15.years of its life. Then compute the after tax proceeds if the asset is sold after three years.Execute:a. The MACRS 5-year schedule, along with the book value:Year 0 Year 1 Year 2 Year 3 Year 4 Year 5 MACRS schedule: 20.00%32.00%19.20%11.52% 11.52% 5.76%Depreciation charge: $ 60,000 $ 96,000 $57,600 $34,560 $34,560 $17,280Remaining book value: $240,000 $144,000 $86,400 $51,840 $17,280 $ 0b. The profits on the sale would be $180,000 − 51,840 = 128,160. The taxes on this profitwould be 128,160 × 0.35 = 44,856. Thus, the total after tax proceeds from the sale are180,000 − 44,856 = 135,144.Evaluate: The book value of the asset after three years would be $51,840. If the asset were soldafter three years for $180,000 the firm would receive $135,144 net of taxes.Plan: If the company accepts the order and does not sell the machine, determine the cost to the 16.company.Execute: Yes, the cost of taking the order is the lost $135,144 in after tax cash flow that itwould have otherwise received by selling the equipment.Evaluate: By taking the order and not selling the machine the company is foregoing the$135,144 it would have received from the sale of the machine. This is therefore a cost of takingthe order.17. a. No, this is a sunk cost and will not be included directly. (But see part (f) below.)b. Yes, this is a cost of opening the new store.c. Yes, this loss of sales at the existing store should be deducted from the sales at the newstore to determine the incremental increase in sales that opening the new store will generatefor HBS.d. No, this is a sunk cost.96 Berk/DeMarzo/Harford • Fundamentals of Corporate Financee. This is a capital expenditure associated with opening the new store. These costs willtherefore increase HBS’s depreciation expenses.f. Yes, this is an opportunity cost of opening the new store. (By opening the new store, HBSforgoes the after-tax proceeds it could have earned by selling the property. This loss is equalto the sale price less the taxes owed on the capital gain from the sale, which is the differencebetween the sale price and the book value of the property. The book value equals the initialcost of the property less accumulated depreciation.)g. While these financing costs will affect HBS’s actual earnings, for capital budgeting purposeswe calculate the incremental earnings without including financing costs to determine theproject’s unlevered net income.18. The incremental cash flows would increase in years 0 and 1, as the accelerated depreciationschedule would give Daily Enterprises a higher tax shield during those two years. In years 2through 5, the incremental free cash flows would be lower, since the depreciation expenses inthese years is lower than 20%. Overall, the present value of the free cash flows would increaseunder a MACRS depreciation schedule.19. a. $15 million/5 years = $3 million per year.b. $3 million × 35% = $1.05 million per year.c.Year0 1 2 3 4 5 MACRS DepreciationEquipment Cost 15,000MACRS Depreciation Rate 20.00%32.00% 19.20% 11.52% 11.52% 5.76%Depreciation Expense 3,000 4,800 2,880 1,728 1,728 864Depreciation Tax Shield1,050 1,680 1,008 605 605 302(at 35% tax rate)d. In both cases, its total depreciation tax shield is the same. But with MACRS, it receives thedepreciation tax shields sooner—thus, MACRS depreciation leads to a higher NPV ofMarkov’s FCF.e. If the tax rate will increase substantially, then Markov may be better off claiming higherdepreciation expenses in later years, since the tax benefit at that time will be greater.20. Plan: Under MACRS, we take the percentage in the table for each year and multiply it by theoriginal purchase price of the equipment to calculate the depreciation for that year.Execute:a. Free Cash Flows are:9…1021= Net income 4,875 4,875 4,875 4,875+ Overhead (after tax at 35%) 650 650 650 650+ Depreciation 2,500 2,500 2,500 2,500− Capex 25,000− Inc. in NWC 10,000–10000FCF −35,0008,025 8,025 …8,025 18,025Chapter 8 Fundamentals of Capital Budgeting 97b. NPV 9101118.025358.02519.5570.14 1.14 1.14⎛⎞=−+×−+=⎜⎟⎝⎠Evaluate: Compared with straight-line depreciation, the MACRS method allows for largerdepreciation deductions earlier in the asset’s life, which increases the present value of the depreciation tax shield and so will raise the project’s NPV.21. Plan: Compute the Free Cash Flow forecast for the next 10 years. Compute the NPV of the projectbased on the forecasted Free Cash Flows. Then compute the NPV under different assumptions about Initial Sales and Growth. Then compute the NPV of the project under a range of discount rates.Year 0 1 2 3 4 5 6 7 8 9 10Free Cash Flow Forecast($ millions)1 Sales — 100.0 100.0 100.0 100.0 100.0 100.0 100.0 100.0 100.0 100.02 Manufacturing — (35.0) (35.0) (35.0) (35.0) (35.0) (35.0) (35.0) (35.0) (35.0) (35.0)3 Marketing Expenses — (10.0) (10.0) (10.0) (10.0) (10.0) (10.0) (10.0) (10.0) (10.0) (10.0)4 Depreciation — (15.0) (15.0) (15.0) (15.0) (15.0) (15.0) (15.0) (15.0) (15.0) (15.0)5 EB I T — 40.0 40.0 40.0 40.0 40.0 40.0 40.0 40.0 40.0 40.06 Income tax at 35% —(14.0)(14.0) (14.0) (14.0)(14.0)(14.0) (14.0) (14.0) (14.0) (14.0)7 Unlevered Net Income— 26.0 26.0 26.0 26.0 26.0 26.0 26.0 26.0 26.0 26.0 8 Depreciation — 15.0 15.0 15.0 15.0 15.0 15.0 15.0 15.0 15.0 15.0 9 Inc. in NWC — (5.0) (5.0) (5.0) (5.0) (5.0) (5.0) (5.0) (5.0) (5.0) (5.0)10 Capital Expenditures(150.0) — — — — — — — — — — 11 Continuation value ——————————12.012 Free Cash Flow(150.0) 36.0 36.0 36.0 36.0 36.0 36.0 36.0 36.0 36.0 48.0 13 NPV at 12%57.3 — — — — — — — — — —Execute:a. The NPV of the estimate free cash flow is9101148NPV 1503610.12 1.12 1.12$57.3 million⎛⎞=−+×−+⎜⎟⎝⎠=b. I nitial Sales 90 100 110 NPV 20.5 57.3 94.0c. Growth Rate 0% 2% 5% NPV57.3 72.5 98.198 Berk/DeMarzo/Harford • Fundamentals of Corporate Financed. NPV is positive for discount rates below the IRR of 20.6%.Evaluate: Under the forecast assumptions the project has an NPV of $57.3 million and thereforeshould be accepted. Under various scenarios of assumed initial sales and growth the projectcontinues to have a positive NPV meaning that even if the forecast assumption proves toooptimistic or pessimistic, the project will still create firm value. Finally the discount rate used inthe forecast assumptions is 12%, but the project would have a positive NPV using any discountrate below 20.6%. The project is positive and the results are robust.*22. a. See spreadsheet.b. See spreadsheet.c. See spreadsheet.d. See data tables in spreadsheet.e. See data tables in spreadsheet.f. See spreadsheet—need additional sales of $11.384 million in years 3 to 10 for larger machineto have a higher NPV than XC-750.Incremental Effects(with vs. without XC-750)Year 0 1 2 3 4 5 6 7 8 9 10 11 Sales Revenues −5,000 10,000 10,00010,00010,00010,00010,00010,00010,000 10,000 10,000Cost of Goods Sold 3,500 −7,000 −7,000−7,000−7,000−7,000−7,000−7,000−7,000 −7,000 −7,000S, G, & A Expenses −2,000 −2,000−2,000−2,000−2,000−2,000−2,000−2,000 −2,000 −2,000 Depreciation −275 −275−275−275−275−275−275−275 −275 −275 EBIT −1,500 725 725725725725725725725 725 725 Taxes at 35% 525 −254 −254−254−254−254−254−254−254 −254 −254 Unlevered Net Income −975 471 471471471471471471471 471 471ContinuedChapter 8 Fundamentals of Capital Budgeting 99Incremental Effects(with vs. without XC-750)Year 0 1 2 3 4 5 6 7 8 9 10 11Depreciation 275275275275275275275 275 275 275Capital Expenditures −2,7501,000800Add. to Net Work. Cap. −600 −1,200000000 0 0FCF −4,325 −454746746746746746746 746 746 1,746800Cost of Capital 10.00% PV(FCF) −4,325 −413617561510463421383 348 316 673280NPV −164.6Net Working Capital Calculation810119 Year 01234567Receivables at 15% −750 1500150015001500150015001500 1500 1500 15000Payables at 10% 350 −700−700−700−700−700−700−700 −700 −700 −7000Inventory 1000 1000100010001000100010001000 1000 1000 00NWC 600 1800180018001800180018001800 1800 1800 8000Sensitivity Analysis: New SalesNew Sales (000s) 8 9 10 10.143 11 122142NPV −2472 −1318 −165 0 989Sensitivity Analysis: Cost of Goods Sold69.545%69% 70%71%COGS 67% 68%NPV 921 559 0 197 −165−526Incremental Effects(with vs. without XC-900)Year 0 1 2 3 4 5 6 7 8 9 10 11Sales Revenues −5,00010,00010,00011,38411,38411,38411,38411,38411,38411,38411,384Cost of Goods Sold 3,500−7,000−7,000−7,969−7,969−7,969−7,969−7,969−7,969−7,969−7,969S, G, & A Expenses −2,000−2,000−2,000−2,000−2,000−2,000−2,000−2,000−2,000−2,000Depreciation −400−400−400−400−400−400−400−400−400−400EBIT −1,5006006001,0151,0151,0151,0151,0151,0151,0151,015Taxes at 35% 525−210−210−355−355−355−355−355−355−355−355Unlevered Net Income −975390390660660660660660660660660Depreciation 400400400400400400400400400400Capital Expenditures −4,000Add. to Net Work. Cap. −600−1,2000−1110000001,000911FCF −5,575−4107909491,0601,0601,0601,0601,0601,0602,060911Continued100 Berk/DeMarzo/Harford • Fundamentals of Corporate FinanceIncremental Effects(with vs. without XC-900)Year 0 1 2 3 4 5 6 7 8 9 10 11Cost of Capital 10.00%PV(FCF) −5,575−373 653713724658598544494450 794319NPV 0.0Net Working Capital Calculation234567891011Year 0 1Receivables at 15% −7501500 15001708170817081708170817081708 17080Payables at 10% 350−700 −700−797−797−797−797−797−797−797 −7970Inventory 10001000 10001000100010001000100010001000 00NWC 6001800 18001911191119111911191119111911 9110New Sales8 9 10 10.40 11 12NPV −652 −326 0 129 326 652Cost of Goods Sold67% 68% 68.76% 69.00% 70% 71%NPV 1203 802 498 401 0 −40123.Real options must have positive value because they are only exercised when doing so wouldincrease the value of the investment. If exercising the real option would reduce value, managerscan allow the option to go unexercised. Thus, having the option but not the obligation to act isvaluable.24. The XC-900 allows Billingham the option to expand production starting in year 3. If it would bebeneficial to expand production, Billingham will increase production with the XC-900. If itwould be better if production remains the same, Billingham is under no obligation to utilize allof the XC-900 production capacity.25. This provides Billingham the option to abandon the investment.。
Group Assignment 2Capital Budgeting DecisionDec.19.2013BE1108Group Members: 刘茹冰蔡熤A/Q1:Payback period in capital budgeting refers to the period of time required torecoup the funds expended in an investment, or to reach the break-even point. For example, a $1000 investment which returned $500 per year would have a two-year payback period. Payback period intuitively measures how long something takes to "pay for itself." All else being equal, shorter payback periods are preferable to longer payback periods. Payback period is popular due to its ease of use.Net present value In finance, the net present value (NPV) or net presentworth (NPW)of a time series of cash flows, both incoming and outgoing, is defined as the sum of the present values (PVs) of the individual cash flows of the same entity.In the case when all future cash flows are incoming (such as coupons and principal of a bond) and the only outflow of cash is the purchase price, the NPV is simply the PV of future cash flows minus the purchase price (which is its own PV).NPV can be described as the “difference amount” between the sums of disco unted: cash inflows and cash outflows. It compares the present value of money today to the present value of money in the future, taking inflation and returns into account.Profitability index (PI), also known as profit investment ratio (PIR) and valueinvestment ratio (VIR), is the ratio of payoff to investment of a proposed project. It is a useful tool for ranking projects because it allows you to quantify the amount of value created per unit of investment.The internal rate of return on an investment or project is the "annualized effective compounded return rate" or "rate of return" that makes the net present value (NPV as NET*1/(1+IRR)^year) of all cash flows (both positive and negative) from a particular investment equal to zero. It can also be defined as the discount rate at which the present value of all future cash flow is equal to the initial investment or in other words the rate at which an investment breaks even.In more specific terms, the IRR of an investment is the discount rate at which the net present value of costs (negative cash flows) of the investment equals the net present value of the benefits (positive cash flows) of the investment.IRR calculations are commonly used to evaluate the desirability of investments orprojects. The higher a project's IRR, the more desirable it is to undertake the project.Assuming all projects require the same amount of up-front investment, the project with the highest IRR would be considered the best and undertaken first.A firm (or individual) should, in theory, undertake all projects or investments available with IRRs that exceed the cost of capital. Investment may be limited by availability of funds to the firm and/or by the firm's capacity or ability to manage numerous projects.The Modified Internal Rate of Return (MIRR) is a financial measure of an investment's attractiveness.[1][2] It is used in capital budgeting to rank alternative investments of equal size. As the name implies, MIRR is a modification of the internal rate of return (IRR) and as such aims to resolve some problems with the IRR.While there are several problems with the IRR, MIRR resolves two of them.Firstly, IRR assumes that interim positive cash flows are reinvested at the same rate of return as that of the project that generated them.[3] This is usually an unrealistic scenario and a more likely situation is that the funds will be reinvested at a rate closer to the firm's cost of capital. The IRR therefore often gives an unduly optimistic picture of the projects under study. Generally for comparing projects more fairly, the weighted average cost of capital should be used for reinvesting the interim cash flows.Secondly, more than one IRR can be found for projects with alternating positive and negative cash flows, which leads to confusion and ambiguity. MIRR finds only one value.A/Q2:Payback period as a tool of analysis is often used because it is easy to apply and easy to understand for most individuals, regardless of academic training or field of endeavor. When used carefully or to compare similar investments, it can be quite useful. As a stand-alone tool to compare an investment to "doing nothing," payback period has no explicit criteria for decision-making (except, perhaps, that the payback period should be less than infinity). The time value of money is not taken into account.The payback period is considered a method of analysis with serious limitations and qualifications for its use, because it does not account for the time value of money, risk, financing, or other important considerations, such as the opportunity cost. Whilst the time value of money can be rectified by applying a weighted average cost of capital discount, it is generally agreed that this tool for investment decisions should not be used in isolation. Alternative measures of "return" preferred by economists are net present value and internal rate of return. An implicit assumption in the use of payback period is that returns to the investment continue after the payback period. Payback period does not specify any required comparison to other investments or even to not making an investment.NPV is a central tool in discounted cash flow (DCF) analysis and is a standardmethod for using the time value of money to appraise long-term projects. Used for capital budgeting and widely used throughout economics, finance, and accounting, it measures the excess or shortfall of cash flows, in present value terms, above the cost of funds.If... It means...Then...NPV > 0 the investment wouldadd value to the firmthe project may be acceptedNPV < 0 the investment wouldsubtract value fromthe firmthe project should be rejectedNPV = 0 the investment wouldneither gain nor losevalue for the firmWe should be indifferent in the decision whether to accept orreject the project. This project adds no monetary value.Decision should be based on other criteria, e.g., strategicpositioning or other factors not explicitly included in thecalculation.Rules for selection or rejection of a project:If PI > 1 then accept the projectIf PI < 1 then reject the projectBecause the internal rate of return is a rate quantity, it is an indicator of the efficiency, quality, or yield of an investment. This is in contrast with the net present value, which is an indicator of the value or magnitude of an investment.An investment is considered acceptable if its internal rate of return is greater than an established minimum acceptable rate of return or cost of capital. In a scenario where an investment is considered by a firm that has equity holders, this minimum rate is the cost of capital of the investment (which may be determined by the risk-adjusted cost of capital of alternative investments). This ensures that the investment is supported by equity holders since, in general, an investment whose IRR exceeds its cost of capital adds value for the company (i.e., it is economically profitable).The rate of return that equates the present value of a project’s cash inflows with the present value of its cash outflows i.e. it sets out the net present value equal to zero. Internal rate of return is basically used to measure the efficiency of capital investment. Internal rate of return is generally required low cost of capital to accept the project.Given a collection of pairs (time, cash flow) involved in a project, the internal rate of return follows from the net present value as a function of the rate of return.A rate of return for which this function is zero is an internal rate of return.The period is usually given in years, but the calculation may be made simplerif is calculated using the period in which the majority of the problem is defined(e.g., using months if most of the cash flows occur at monthly intervals) andconverted to a yearly period thereafter.Any fixed time can be used in place of the present (e.g., the end of one interval of an annuity); the value obtained is zero if and only if the NPV is zero.In the case that the cash flows are random variables, such as in the case of a life annuity, the expected values are put into the above formula.Often, the value of cannot be found analytically. In this case, numericalmethods or graphical methods must be used.Like the internal rate of return, the modified internal rate of return cannot be validly used to rank-order projects of different sizes, because a larger project with a smaller modified internal rate of return may have a higher present value.However, there exist variants of the modified internal rate of return which can be used for such comparisons.Page 299Q1:Construct a spreadsheet to calculate the payback period, internal rate of return, modified internal rate of return, and net present value of the proposed mine. A:year 1=-500000000+6000000=-440000000Year 2=-440000000++90000000=-350000000Year 3=-350000000+170000000=-180000000Year 4=-180000000+230000000=500000005000000-80000000=-30000000Year 5=-30000000+205000000=175000000Payback period is 4.15 years.Internal rate of return :-500000000+60000000/(1+r)+90000000/(1+r)^2+170000000/ (1+r)^3+230000000/(1+r)^4+205000000/(1+r)^5+140000000/(1+r)^6+110000000/(1 +r)^7+70000000/(1+r)^8-80000000/(1+r)^9=0Irr=18.87percentModified internal rate of return=14.748%,Finance rate=.12Reinvest rate=.12Npv=115109801.56Q2:Based on your analysis, should the company open the mine? A:payback period=4.85Irr=.1887>.12Mirr=.14748Npv is positiveIt should open the mine.。
Chapter 11: The Basics of Capital BudgetingI. What is Capital Budgeting?The process of determining what capital projects to acceptProject Classification is the starting point for determining the appropriate discount rate Replacement to maintain current operationsReplacement to reduce costsExpansion of existing products or marketsExpansion into new products or marketsPure research & development (example: pharmaceutical firms)Exploration (example: energy firms)Safety and /or environmental (government mandated) projectsII. Decision CriteriaWhat are the major investment decision criteria?Net Present Value - NPVInternal Rate of Return - IRRModified Internal Rate of Return - MIRRPayback Period - PaybackDiscounted Payback Period – Discounted PaybackProfitability Index - PIWhat are they used for?To evaluate the cash flows from capital investment projectsTo make the accept or reject decisionA. The NPV Rule:1. Why Is Net Present Value the Best Decision Criteria?- It considers the time value of money(TVM)… a dollar today is worth more than a dollar in the future- It considers all cash flows during the project’s entire life- NPV lets you know exactly how much value is being added by the project- You can set the appropriate require rate of return (discount rate or hurdle rate) depending on a project’s risk2. Calculating Net Present Value (NPV:NPV =CF0+ CF1 + CF2 + ... + CF tt3. The NPV decision (accept/reject) rule:- Accept the project (investment) if NPV > zero- Reject the project if NPV < zero4. What does a positive NPV mean?- The PV of cash inflows > PV of cash outflows- The value of the company is being increased by the amount of NPV- The project meets the required rate of return…and then someA friend asks you to invest $20,000 and promises to pay you $26,000 at the end of 2 years. Your required rate of return is 15%. Do you take the offer?NPV =CF0+ CF2NPV = -20,000 + 26,000 => -20,000 + 19,6601.15 2NPV = $-340 You should reject your friend’s offer!* If this were a capital investment project, acceptance would reduce the value of the company by $340!* Acceptance of the project would not increase the value of the company by $6,000! The key variable here is the required rate of return (or discount rate).The required rate of return (RRR) is:* The hurdle rate* The cost of capital (funds)* The best rate of return the company could expect on other projects of similar risk Note:In a competitive market, positive NPV projects are considered rare and require diligent effort to uncoverTwo projects with identical cash outflows (investment =$1,000) but different timing of cash inflows. Discount rate = 10%NPV for project S: (Large cash inflows come sooner)0 1 2 3 4|---------------|---------------|---------------|--------------|Net CF -1,000 500 400 300 100NPV(S) = $78.82NPV for project L: (Large cash inflows come later)0 1 2 3 4|---------------|---------------|---------------|--------------|Net CF -1,000 100 300 400 500NPV(L) = -$19.12B. The Payback Rule:Time period required for a project to generate enough cash inflows to recover the initial cost.The Payback decision (accept/reject) rule:- Accept if payback period < maximum acceptable payback period.- Reject if payback period > maximum acceptable payback period.Advantages- Easy to understand: the shorter the payback period, the better- Quick indicator of the liquidity risk of the project (how long funds will be tied up) Disadvantages- Ignores time value of money- Ignores cash flows beyond acceptable payback date- Acceptable payback date is usually an arbitrary cutoff point. Risk is not quantified in a required rate of return. The liquid ity risk is simply a “rule ofthumb”Project S:0 1 2 3 4|---------------|---------------|---------------|---------------|Net CF -1,000 500 400 300 100 Cumulative -1,000 -500 -100 200 300NCFPayback = years before + uncovered cost at end of yearfull recovery NCF during following year= 2 + 100/300= 2.33 yearsIf acceptable payback period is 2.33 or more years, you accept project SC. The Discounted Payback Rule:Time period required for a project to generate enough discounted cash inflows to recover the initial cost.The Discounted Payback decision (accept/reject) rule:- Accept if discounted payback period < maximum acceptable payback period.- Reject if discounted payback period > maximum acceptable payback period. Advantages- Easy to understand: the shorter the payback period, the better- Quick indicator of the liquidity risk of the project (how long funds will be tied up) - Does consider the time value of moneyDisadvantages- Ignores cash flows beyond acceptable payback date- Acceptable payback date is usually an arbitrary cutoff point.Project S: Assume a 10 percent discount rate0 1 2 3 4|---------------|---------------|---------------|---------------|Net CF -1,000 500 400 300 100PVNCF -1,000 454 331 225 68Cumulative -1,000 -546 -215 10PVNCFPayback = years before + uncovered cost at end of yearfull recovery NCF during following year= 2 + 215/225= 2.96 yearsIf acceptable payback period is 2.96 or more years, you accept project SD. Internal Rate of ReturnThe IRR is similar to a bond’s yield to maturity. It is the rate that makes the present value of cash inflows (CIF) equal to the present value of cash outflows (COF). Thus, it is the rate of return that results in a zero NPV when it is used as the discount rate.NPV = CF0+ CF1 + CF2 + ... + CF t(1 + r)1 (1 + r)2 (1 + r)t0 = CF0+ CF1 + CF2 + ... + CF t(1 + IRR) 1(1 + IRR) 2(1 + IRR)tIRR Decision Rule- Accept the project if IRR > req’d rate of return (discount rate)- Reject the project if IRR < req’d rate of return (discount r ate)Advantages- Considers TVM- Considers all cash flows- Easy to understandDisadvantages- May use unreasonable discount rate- Can conflict with NPV if projects are mutually exclusiveIRR Examples:IRR for Project S0 1 2 3 4Project S|---------------|---------------|---------------|---------------|-1,000 500 400 300 1000 = -1000 + 500 + 400 + 300 + 100(1+Irr) 1 (1+Irr) 2 (1+Irr) 3 (1+Irr)4Solve for the IRR. That is the discount rate that solves this equation and makes the answer (NPV) equal to zero.IRR for Project S = 14.49%IRR for Project L0 1 2 3 4Project L|---------------|---------------|---------------|----------------|-1,000 100 300 400 5000 = -1000 + 100 + 300 + 400 + 500(1+Irr) 1 (1+Irr) 2 (1+Irr) 3 (1+Irr)4IRR for Project L =9.27%The IRR is the most popular method, after NPV, for evaluating cash flows and is almost as good.Problems with IRR:There are problems with using IRR rather than NPV with you are choosing between mutually exclusive projects:- Independent projects: When evaluating multiple projects and any, none, or all of them can be accepted. Acceptance of any project has no bearing on the acceptance or rejection of another.- Mutually exclusive projects: When evaluating multiple projects and only one can be accepted. Acceptance of one project means rejection of the other(s).There is never a conflict between IRR and NPV criterion when evaluating independent projects. But when choosing between mutually exclusive projects, the IRR choice may conflict with the NPV choice under certain conditions.The Scale Problem: A potential conflict exists when there are significant differences in the size of the cash flows. An example would be if comparing a project with a $100,000 initial investment (COF) with another project with a $1,000,000 initial investment.The Timing Problem: A potential conflict exists when the timing of the cash flows for two projects are radically different. This can result in a conflict between the NPV choice and the IRR choice at low discount rates.Multiple IRRs: Projects with non-normal (non-conventional) cash flows may have multiple IRRs. A normal (or conventional) cash flow is a cash outflow at the beginning of a project, followed by cash inflows thereafter.The NPV Profile: NPV graphed against the discount rateRecall the NPV & IRR acceptance rules:NPV: Accept the project if NPV > zeroIRR: Accept the project if IRR > RRRNPVCash Flows-1000$300 500400300100IRR0 r.1449Any project with a positive NPV will also have an IRR that exceeds the discount rate (required rate of return).NPV Profiles for Mutually Exclusive Projects:NPV Cash FlowsExample: IRR vs NPV for Mutual Exclusive ProjectsCash FlowsA B-10,000 -10,00010,000 1,0001,000 1,0001,000 12,000IRR for A _____________ IRR for B is ___________ NPV at 0% ____________ NPV at 0% ____________ NPV at 10% ___________ NPV at 10% ___________ NPV at 15% ___________ NPV at 15% ___________ Which project is acceptable if they are independent? Why?Which project is acceptable if they are mutually exclusive? Why? E. Modified Internal Rate of Return- Accept the project if M IRR > req’d rate of return (discount rate) - Reject the project if M IRR < req’d rate of return (discount rate) Advantage: Let’s you decide the reinvestment rate!Cost = Terminal Value TGiven: Cost, TVSolve: MIRRF. Profitability Index (PI)PI = (PV of Cash Inflows)/(PV of Cash Outflows)The PI is the ratio of the PV of the project’s cash inflows to the PV of the project’s cash outflows.PI for Project SPVCIF S= 500 + 400 + 300 + 100 = 1,078.82(1+.10)1 (1+.10)2 (1+.10)3 (1+.10)4PVCOF S= 1,000PI S= 1,078.82/1,000 = 1.07882PI Decision Rule- Accept if PI > 1.00- Reject if PI < 1.00Advantages- Considers TVM- Considers all cash flows- Uses reasonable discount rate- Useful when faced with capital rationing.Disadvantages- Cannot distinguish projects of vastly different scale- May conflict with NPV when evaluating mutually exclusive projectsProfitability Index vs NPV for Mutually Exclusive Projects0 1|---------------------|Cash FlowsProject A -$10 $15Project B -$1,000 $1,250A BNPV at .10 $ 3.64 $136.36PI at .10 1.364 1.136According to NPV, you choose B.According to PI, you choose A.。