Panel estimation for income inequality and CO 2emissions:A regional analysis in
China
Chuanguo Zhang ?,Wei Zhao
School of Economics,Xiamen University,Xiamen 361005,PR China
h i g h l i g h t s
We investigated the impact of income and its inequality on China’s CO 2emissions. Income growth increases China’s CO 2emissions.
The effects of income growth on CO 2emissions vary across regions.
Income inequality impacts on CO 2emissions in Eastern and Western regions.
a r t i c l e i n f o Article history:
Received 24February 2014
Received in revised form 13September 2014Accepted 15September 2014Available online 2October 2014Keywords:
Income inequality CO 2emissions
Environmental Kuznets Curve
a b s t r a c t
With rapid economic growth,China is facing tremendous pressures of emission–reduction and serious income inequality issues.The existing research is concerned with the relationships between income inequality and CO 2emissions in recent years,but little attention has been paid to the regional differences in China.This paper investigated the impact of income and its inequality on CO 2emissions at the national and regional levels using the panel data from 1995to 2010in China.The empirical results show that income growth increases China’s CO 2emissions.The effects of income growth on CO 2emissions vary across regions.Further,the impact of income inequality on CO 2emissions in the Eastern region is greater than that in the Western region.This research reveals that a more equitable income distribution may help control CO 2emissions in developing China,and there is a win–win situation of income redistribution and emission–reduction.Our ?ndings merit particular attention from policy makers in China.
ó2014Elsevier Ltd.All rights reserved.
1.Introduction
China has undergone rapid economic growth since the 1980s,and has passed Japan to become the world’s second-largest econ-omy.However,with rapid economic growth,China is facing serious challenges of massive carbon emissions;its emissions increased from 0.671billion metric tons in 1995to 2.248billion metric tons in 2010,and will increase to 10.300billion metric tons by 2035[2].The massive carbon emissions have not only caused ecological deterioration,a serious threat to sustainable development,but also brought tremendous international pressures of emission–reduc-tion [13].
Meanwhile,China is also facing serious income inequality issues.The Gini coef?cient,a rich-poor index,reached 0.47in China in 2012,higher than the warning level of 0.40set by the United Nations [43].Although income inequality is a common phenome-non in the process of rapid economic growth,fairer income distribution is a fundamental move to safeguard equity and justice as well as social stability and harmony.If the income gap continues to widen,it will become conducive to internal contradictions and social in stability.
As an inherent requirement of ‘‘building a harmonious society’’,China needs to develop an economy with emission–reduction strat-egy,and to solve the problems of equity and ef?ciency in order to prevent the country from stepping into the ‘‘middle-income trap’’.These issues have drawn nationwide attention in China.In the Out-line of the 12th Five-Year Plan,China aims to reduce CO 2emissions per unit of GDP by 17%compared with the 2010level.Income distri-bution reform was eventually introduced in February 5,2013after a ten year investigation process that started in 2004.Increased atten-tion to policy has provided renewed stimulus to investigating nexus between income disparity and emission–reduction in China.
In the existing literature,the relationships between income inequality and CO 2emissions have been discussed [23,18,12].Some scholars hold the view that income inequality is detrimental to carbon reduction efforts,while others maintain the effect is uncertain and time-varying.A consensus has not been reached in
https://www.doczj.com/doc/fd9515274.html,/10.1016/j.apenergy.2014.09.0480306-2619/ó2014Elsevier Ltd.All rights reserved.
?Corresponding author.Tel.:+8659213720898826;fax:+865922186366.
E-mail address:cgzhang@https://www.doczj.com/doc/fd9515274.html, (C.Zhang).
academic circles.Furthermore,China has vast territory and large regional differences,but little of the existing research is carried out with consideration for regional differences in China[15].
Our study investigated the relationship between income inequality and CO2emissions in China by whole and regional anal-yses based on the theoretical framework of Environmental Kuznets Curve(EKC),with a panel data covering28provinces in China over the period1995–2010.Considering regional differences in China, we divided the provincial database into three subsamples:the Eastern region,the Central region and the Western region.This paper aims to investigate whether the relationship between income inequality and CO2emissions differs across regions,and whether income redistribution goes hand in hand with emission–reduction in China.Our research merits particular attention from policy makers in China.
Some scholars are convinced that an imbalanced income distri-bution is detrimental to the improvement of environmental qual-ity.The pioneering study was published by Boyce[5]who argued that the greater inequalities of power and wealth lead to more environmental degradation resulting from an unequal income dis-tribution.Joan[17]also concluded that the imbalance of income distribution harms the improvement of environmental quality. Later,Torras and Boyce[37]and Magnani[24]introduced the pub-lic good choice approach to explain how the income inequality affects society’s environmental quality demand,and Marsiliani and Renstrom[25]conducted a similar study through the go-between theory,since the demand of the environment-goods is more?exible,the relative increased go-betweens with high level of income will consume more environment-friendly goods. Gawande et al.[11]adopted the GINI coef?cient to measure the gap in income distribution and con?rmed that a greater gap in
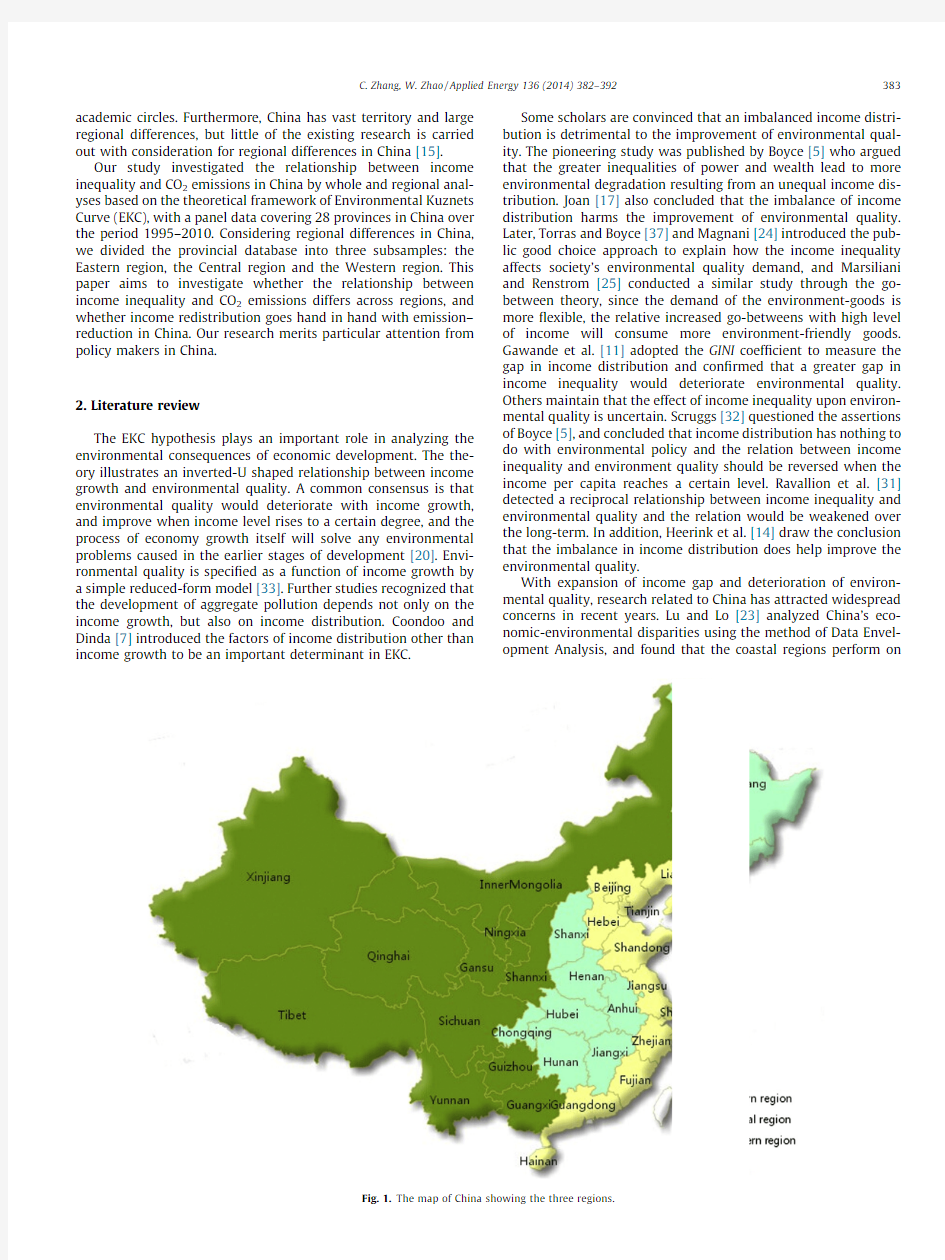
Fig.1.The map of China showing the three regions.
C.Zhang,W.Zhao/Applied Energy136(2014)382–392383
average better than the inland regions.Jun et al.[18]structured the econometric model and concluded that there is a negative relation-ship between income inequality and environmental quality.Golley and Meng[12]proposed that the redistribution of income from rich to poor households would reduce aggregate urban household emissions based on Chinese survey data.
In summary,the consensus regarding the relationship between income inequality and environmental quality has not been reached in academia.Most studies concentrate on investigating the rela-tionship between income inequality and carbon emissions from a national perspective without consideration of regional differences. This work is different from previous research in three aspects:First of all,this paper examined the determinants of CO2emissions using the Gini coef?cient as one explanatory variable with Chinese panel data.Secondly,we built a non-linear regression model based on EKC theory,and the model contained income inequality as an explanatory variable to reveal the effect on CO2emissions.Finally, the analysis in this paper was carried out both on whole country and on three regional levels.We divided the provincial database into three subsamples:the Eastern region(including Beijing,Tian-jin,Hebei,Liaoning,Shanghai,Jiangsu,Zhejiang,Fujian,Shandong and Guangdong provinces),the Central region(including Shanxi, Anhui,Jilin,Heilongjiang,Jiangxi,Henan,Hubei and Hunan prov-inces),and the Western region(including Sichuan,Guizhou,Yun-nan,Shannxi,Gansu,Qinghai,Ningxia,Xinjiang,Guangxi and Inner Mongolia provinces)(Fig.1).
3.Methodology
The EKC is a common theoretical framework used to investigate the relationship between economic growth and environmental problems.Torras and Boyce[37]assumed that the inequality power may be associated with the levels of pollution.Furthermore, Heerink et al.[14]con?rmed that income distributional issues can be brought explicitly in the discussion of EKC theory.Recent stud-ies[7,12]focus more on the pollution levels impacted by the income inequality factor.For example,Jun et al.[18]found income inequality can be used as an explanatory factor in EKC.The pollu-tion levels,taken as the environmental damage variable,are spec-i?ed as a function of income level.The equation can be written in the following form:
POL?b
0tb1y ktb2y2
k
tb3y3
k
tb4V kte ke1T
where POL denotes pollution levels,y is income per capita,and V is a vector of other variables.In particular,according to the EKC,the reduction in emissions at higher levels of income is driven by changes of other variables.Referring to Jun et al.and Du et al. [18,9],we use GDP per capita,Gini-coef?cient,composition of industry,technological improvements,rate of urbanization as the independent variables.To analyze the impact of income inequality on CO2emissions in China,our model takes the speci?cation as:
ln TC it?a itb1PGDP ittb2ePGDP itT2tb3ePGDP itT3th1GINI it th2EI itth3STR itth4URB ittf ite2T
where TC means total carbon emissions,an indicator of environ-mental quality;PGDP is GDP per capita;GINI denotes Gini-coef?-cient,measuring the degree of income inequality in EKC, introduced by Torras and Boyce[37];EI(energy intensity)is used to measure the technology improvement[2];STR(industry struc-ture)is the share of the industry sector in GDP,for usually the energy intensive industry emits more carbon and taking account of the share of industry can help us to capture possible variations in industry compositions over time;URB is a variable which mea-sures urbanization by using the percentage of non-agriculture pop-ulation.Transforming TC into logs,we focused on the log-level because the log-levels deliver substantially higher adjusted R2val-ues than the other equations,with signi?cant coef?cients of all the variables[12].This paper adopted the non-equal calculation method proposed by Thomas et al.[36]to calculate the GINI coef?-cients.Formulations are as follows:
GINI?
1
l
X N
i?2
X ià1
j?1
P i j y iày j j p je3TGINI?
X N
i?1
W i y
i
t2
X Nà1
i?1
W ie1àS iTà1e4T
where l stands for the expected value of the total income,N is the total population of the group divided,y i is the average income,P i is the proportion of the population of the i group in the whole,W i is the proportion of the whole population grouped in the whole and S i is the accumulation of y i from1to i.
As for the GINI coef?cient of the total residents,we calculated the urban and rural GINI coef?cient,respectively,for the income data in China are divided into separate group,urban and rural areas.Thus,we got GINI coef?cient for the total residents by the method of Sundrum[35]as follows:
GINI?p
u
l l
l GINI utp r
l l
l GINI rtp u p r
l
r
àl u
l
e5T
where GINI u and GINI r are the urban and rural GINI coef?cients, respectively;p u and p r are the proportion of urban population and rural population,respectively;l,l u and l r are the value of the income per capita of the whole,urban and rural residents,respectively.
Before estimating the model,we did the basic tests in two steps. First,to verify the stationary of the data series,several panel unit root tests were applied following the research of Coondoo and Dinda[7],including the ADF test,the Phillips–Perron test(PP) [30],the Levin,Lin and Chu test(LLC)[21]and Im,Pesaran and Shin (IPS)test[16].Second,to investigate the long-run equilibrium rela-tionship between the integrated variables,panel co-integration test was adopted[29].
We estimated the impact of income inequality on CO2emissions for the whole sample and the three regions in six different estima-tion methods:FE,White,Newey-West,DK,PCSE and FGLS,generat-ing24models.Considering of heterogeneity bias,the FE estimation, a within estimator being consistent and valid for?xed effects model,was applied following the Robust Hausman test.Moreover, group-wise heteroskedasticity,autocorrelation and cross-sectional independence may exist within the dataset,so White,Newey–West and DK were used to determine more reliable estimation methods when the classic hypotheses were violated.By the White[42]and Newey–West[28]tests for panel-data models,we con?rmed the presence of heteroskedasticity and autocorrelation in the all mod-els.DK[8]was carried out to detect cross-sectional correlation.In addition,FGLS(the feasible generalized least squares)and PCSE (the linear regression with panel-corrected standard errors)were applied to deliver more reliable estimators as reference.FGLS is suitable in panel when T>N and the standard errors would under-estimate true variability[4],while PCSE is for panel when N>T and the estimated coef?cients would be with Prais–Winsten adjusted regression.Both FGLS and PCSE as reference models are supplied.
4.Data description
4.1.Data source
We used a balanced panel dataset of28provinces in China over the period1995–2010.The data of GDP was collected from China Statistic Yearbook,was standardized to a constant price.The data of the provincial demographics and the urban population were
384 C.Zhang,W.Zhao/Applied Energy136(2014)382–392
collected from China Statistical Yearbook and China Compendium of Statistics,respectively.The share of industry sector in GDP was drawn from China Compendium of Statistics.In addition,the data of energy use were provided by China Energy Statistical Yearbook. And the data of CO2emissions was calculated according to the for-mula provided by the Intergovernmental Panel on Climate Change (IPCC)(2006)(Provided by website:http://www.ipcc-nggip.ige-s.or.jp/).Table1gives de?nition of the variables:
4.2.Data description
Figs.2and3re?ect GDP per capita and CO2emissions of the Eastern,Central and Western regions as well as the whole country from1995to2010.Both GDP per capita and CO2emissions in China rose rapidly during1995to2010.GDP per capita in the Eastern region grew fastest,followed by the Central and Western regions,with a gradually widening gap.CO2emissions increased gradually before2002,and accelerated thereafter.The Eastern region had more emissions than the Central or Western region, showing that the region with higher income also produced more CO2emissions in China.This is in line with the view of Clarke-Sather et al.[6]that CO2emissions in more developed regions of China are still more than those in less developed regions.It is also notable that the share of CO2emissions in the Western region changed from20.9%in1995to24.8%in2010,with highest increase rate among three regions.
Fig.4illustrates the tendency of GINI coef?cient of the Eastern, Central and Western regions as well as the whole country from 1995to2010.Income inequality in three regions showed a similar pattern of upward?uctuations,with varying slightly after2002 and then decreasing in2010.And income inequality in the Western region is higher than that in the Central and Eastern regions.
Table1
De?nition of variables and acronyms.
Variable Units of measure De?nition
Total CO2emissions(TC)10,000tons Total CO2emissions
GDP Per capita(PGDP)Yuan per capita(1952prices)GDP divided by population at the end of the year
Gini-coef?cient(GINI)—Measure difference of income distribution
Energy intensity(EI)Tce per10,000Yuan Total energy use divided by GDP
Share of industry sector(STR)Percent The ratio of industry sector value added in GDP
Urbanization(URB)Percent The percentage of the urban population in total population
The data of Xizang,Hainan,Hong Kong,Macao and Taiwan are
excluded.
C.Zhang,W.Zhao/Applied Energy136(2014)382–392385
5.Empirical results
As shown in Tables A–D in appendix,ADF,PP,LLC and IPS tests cannot reject the null hypothesis at levels.We applied the same tests to the?rst differences,and all the statistics reject null of no unit roots,so all time series in the panel are?rst difference station-ary.The long-term relationships among variables at the whole country and the three regions levels are in Table2.
As reported from Tables3–6,all combined F-stats robustly reject the null hypothesis.At the national level,all the three stats are signi?cant at the level of1%,illustrating the existence of group-wise heteroskedasticity,within-correlation and cross-sec-tional dependence.The Wald-stat and F-stat are signi?cant while the CD-stat is not at the level of1%in the Eastern region.For the Central and the Western regions,all stats are signi?cant.As for the estimation results,we focus on DK estimation(model4,16
Table2
Panel co-integration test.
Statistics Whole country Eastern region Central region Western region
Panel v-Statisticà3.1170***à1.4840à1.7170*à3.3550***
Panel q-Statistic 3.7260*** 2.9150*** 2.5820** 2.0940**
Panel pp-Statisticà12.3270***à5.9840***à2.5310**à21.0550***
Panel ADF-Statisticà5.2640***à6.1680**à3.7370***à7.5330***
Group q-Statistic 5.7970*** 4.2230*** 3.2850*** 3.2940***
Group pp-Statisticà19.4770***à7.6650***à6.8340***à25.2670***
Group ADF-Statisticà3.4090***à6.3460***à4.5410***à7.0140***
*Means signi?cant at con?dence level10%.
**Means signi?cant at con?dence level5%.
***Means signi?cant at con?dence level1%.
Table3
Panel estimation:carbon emissions in whole country.
FE(1)White(2)N–W(3)DK(4)PCSE(5)FGLS(6)
PGDP 3.243e-04*** 3.243e-04*** 3.243e-04*** 3.243e-04*** 3.585e-04*** 3.526e-04***
(1.510e-05)(3.120e-05)(3.880e-05)(1.070e-05)(2.820e-05)(1.150e-05)
(PGDP)2à1.750e-08***à1.750e-08***à1.750e-08***à1.750e-08***à2.020e-08***à1.990e-08***
(1.060e-09)(2.130e-09)(2.610e-09)(1.610e-09)(2.020e-09)(6.910e-10)
(PGDP)3 2.910e-13*** 2.910e-13*** 2.910e-13*** 2.910e-13*** 3.310e-13*** 3.260e-13***
(2.060e-14)(4.090e-14)(4.920e-14)(2.920e-14)(4.010e-14)(1.180e-14)
GINI 2.4953*** 2.4953*** 2.4953*** 2.4953*** 1.2869***0.8707***
(0.2786)(0.3432)(0.4616)(0.1821)(0.5141)(0.1417)
EI0.0419***0.0419***0.0419***0.0419***0.0260***0.0274***
(0.0055)(0.0087)(0.0117)(0.0069)(0.0095)(0.0021)
STR0.0179***0.0179***0.0179***0.0179***0.0042**0.0033***
(0.0059)(0.0064)(0.0065)(0.0056)(0.0019)(0.0007)
URB-0.0010-0.0009-0.0009-0.00090.00140.0007**
(0.0011)(0.0015)(0.0021)(0.0011)(0.0011)(0.0003)
Cons 6.8908*** 6.8908*** 6.3237*** 6.8908*** 6.8914***7.1122***
(0.1369)(0.2079)(0.1606)(0.1064)(0.1783)(0.0824)
Province——Yes Yes Yes Yes Year——————R20.86000.86000.86000.9898
Robust Hausman test F-stat=2.900e+13***
Heteroskedasticity test chi2(28)=1478.6400***
Autocorrelation test F(1,27)=69.4990***
Cross-sectional independence test CD=13.6710***
Obs.448448448448448448
**Means signi?cant at con?dence level5%.
***Means signi?cant at con?dence level1%.Figures in parentheses are the standard errors.
386 C.Zhang,W.Zhao/Applied Energy136(2014)382–392
and22),while putting emphasis on N-W estimation for the Eastern region(model9).Reference models are supplied when coef?cients in DK or Newey–West are failed in t-tests.We choose PCSE for national case(model5)and FGLS for three regions(model12,18 and24).
5.1.Whole analysis
The empirical results of panel estimation at the national level are shown in Table3.It can be seen that apart from the coef?cient of urbanization,those of other variables are statistically signi?cant at the1%level(model4).The coef?cient of GDP per capita(3.243e-04)is signi?cantly positive,implying that CO2emissions will increase when China’s GDP per capita is improved.The square and cubic coef?cients of GDP per capita are estimated at the same time.The coef?cient of square is negative,while the cubic is posi-tive,showing that the income levels rise corresponds to a non-monotonic but eventually continuous increase in CO2emissions.
The coef?cient of GINI is2.4953,implying that a fall of1unit in GINI coef?cient will cause a reduction of approximate2.5%in CO2
Table4
Panel estimation:CO2emissions in the Eastern region.
FE(7)White(8)N-W(9)DK(10)PCSE(11)FGLS(12)
PGDP 2.972e-04*** 2.972e-04*** 2.972e-04*** 2.972e-04*** 2.840e-04*** 2.722e-04***
(1.430e-05)(1.510e-05)(1.080e-05)(9.310e-06)(1.720e-05)(7.080e-06)
(PGDP)2à1.330e-08***à1.330e-08***à1.330e-08***à1.330e-08***à1.240e-08***à1.180e-08***
(8.490e-10)(9.950e-10)(1.320e-09)(6.330e-10)(1.070e-09)(3.560e-10)
(PGDP)3 1.980e-13*** 1.980e-13*** 1.980e-13*** 1.980e-13*** 1.730e-13*** 1.710e-13***
(1.540e-14)(1.960e-14)(1.440e-14)(1.350e-14)(1.950e-14)(1.790e-15)
GINI 2.0056*** 2.0056*** 2.0056*** 2.0056***0.8578**0.8416***
(0.4229)(0.4334)(0.3641)(0.4183)(0.3890)(0.1410)
EI0.1470***0.1470***0.1470***0.1470***0.0912***0.0855***
(0.0135)(0.0146)(0.0179)(0.0257)(0.0175)(0.0077)
STR0.0161***0.0161***0.0161***0.0161***0.0153***0.0137***
(0.0028)(0.0033)(0.0025)(0.0026)(0.0026)(0.0008)
URB0.00230.00230.00230.00230.0027**0.0021***
(0.0019)(0.0017)(0.0012)(0.0008)(0.0012)(0.0005)
Cons 6.5923*** 6.5923*** 6.5923*** 6.5923*** 6.3556*** 6.5404***
(0.1524)(0.1380)(0.1299)(0.2231)(0.1824)(0.1088)
Province——Yes Yes Yes Yes Year——————
R20.95210.95210.95210.9960
Robust Hausman test F-stat=3.600e+12***
Heteroskedasticity test chi2(28)=30.9500***
Autocorrelation test F(1,27)=130.0650***
Cross-sectional independence test CD=0.9590
Obs.160160160160160160
**Means signi?cant at con?dence level5%.
***Means signi?cant at con?dence level1%.Figures in parentheses are the standard errors.
Table5
Panel estimation:CO2emissions in the Central region.
FE(13)White(14)N–W(15)DK(16)PCSE(17)FGLS(18)
PGDP 3.109e-04*** 3.109e-04*** 3.109e-04*** 3.109e-04*** 3.068e-04*** 3.386e-04***
(3.680e-05)(4.910e-05)(7.100e-05)(3.200e-06)(4.850e-05)(3.170e-05)
(PGDP)2à2.730e-08***à2.730e-08***à2.730e-08***à2.730e-08***à2.470e-08***à2.880e-08***
(5.100e-09)(4.380e-09)(6.350e-09)(5.470e-09)(7.250e-09)(4.770e-09)
(PGDP)37.970e-13***7.970e-13***7.970e-13***7.970e-13*** 5.970e-13**7.260e-13***
(2.120e-13)(1.540e-13)(2.130e-13)(1.930e-13)(2.940e-13)(1.930e-13)
GINI0.31590.31590.31590.31590.05800.2038***
(0.3661)(0.3306)(0.3797)(0.4744)(0.3916)(0.1875)
EI0.030***0.0309***0.0309**0.0309**0.0256***0.0247***
(0.0058)(0.0098)(0.0123)(0.0147)(0.0084)(0.0052)
STR0.00140.00140.00140.0014-0.0006-0.0013***
(0.0019)(0.0025)(0.0027)(0.0021)(0.0011)(0.0005)
URB0.0301***0.0301***0.0301***0.0301***0.0287***0.0258***
(0.0027)(0.0035)(0.0049)(0.0021)(0.0036)(0.0018)
Cons7.810***7.811***7.8109***7.8109***8.2968***8.3461***
(0.1531)(0.1548)(0.3084)(0.2122)(0.2783)(0.1571)
Province——Yes Yes Yes Yes Year——————
R20.91590.91590.91590.9955
Robust Hausman test F-stat=3.300e+12***
Heteroskedasticity test chi2(28)=919.7600***
Autocorrelation test F(1,27)=59.5830***
Cross-sectional independence test CD=5.3380***
Obs.128128128128128128
**Means signi?cant at con?dence level5%.
***Means signi?cant at con?dence level1%.Figures in parentheses are the standard errors.
C.Zhang,W.Zhao/Applied Energy136(2014)382–392387
emissions.When income inequality falls,China’s CO2emissions tend to go down.So an equalizing redistribution of income,ceteris paribus,would decrease CO2emissions.
The results indicate that a rise of1unit in energy intensity and industry structure will cause an increase of0.0419%and0.0178%in CO2emissions,respectively.Energy intensity together with indus-try structure is signi?cant in pushing up CO2emissions.Urbaniza-tion is failed to pass t-test in model(4)and(5).
5.2.Regional analysis
China has vast territory and large regional differences among the Eastern,Central and Western regions.So we extended our anal-ysis to region level in order to reveal the differences between income inequality and CO2emissions in three regions.
As shown in Table4,all variables in the Eastern region are sta-tistically signi?cant in N–W model at con?dence level of1%,except for urbanization.GDP per capita is with a coef?cient of2.972e-04, lower than that of the whole country.The coef?cient of GINI is 2.0056,the highest among three regions.One unit drop in GINI coef?cient would decrease about2%CO2emissions in the region. Energy intensity explains CO2emissions well in the region with parameter of0.1470.Industry structure has strong explanatory power with parameter of0.0161,but fails to affect CO2emissions signi?cantly in the other two regions.The coef?cient of urbaniza-tion is still not signi?cant in model9,but passes the t-test in model 12at the level of1%.
The Central region is quite different from the whole country and the Eastern region(Table5).The coef?cient of GINI is not statisti-cally signi?cant in model16,but it is signi?cant in FGLS(model 18)with the parameter of0.2038,the smallest among three regions.It indicates that there is a weak relationship between income inequality and CO2emissions in the Central region and the impact of GINI coef?cient on CO2emissions differs across regions.The coef?cients of GDP per capita and energy intensity are3.109e-04and0.0309,respectively.The urbanization increases CO2emissions with the coef?cients of0.0301,while industry struc-ture has insigni?cant effect on CO2emissions.
In the Western region,as shown in Table6,the coef?cient of industry structure fails to pass t-test,but it is signi?cant in FGLS. Other explanatory variables are statistically signi?cant.The coef?-cient of GDP per capita is signi?cantly positive with parameter of 8.338e-04,followed by one in the Central region(3.109e-04)and in the Eastern region(2.972e-04).GINI coef?cient is with a param-eter of0.9722,meaning that one unit drop in GINI coef?cient will decrease CO2emissions by0.9722%,similar to the case of the East-ern region and the whole country.The coef?cient of energy inten-sity is with parameter of0.0574.Urbanization coef?cient appears to be extraordinary with the signi?cantly negative coef?cient(-0.0047),meaning that an increase of1%in urbanization will reduce 0.0047%CO2emissions.In the Western region,urbanization helps to reduce CO2emissions.
6.Discussion
We found several interesting phenomena from our empirical results.
The?rst?nding is that income growth increases CO2emissions in China.This positive relationship has also been proved by Coon-doo and Dinda[7],Jun et al.[18],Golley and Meng[12,22],whose research found that there is a positive relationship between income growth and CO2emissions.With rapid economic growth, China,the largest developing country,stepped into the process of industrialization and urbanization.In2011,the industry sector has dominated half of the gross output and the urban population reached50%for the?rst time,directly accelerating energy con-sumption and CO2emissions[27].Moreover,China’s energy ef?-ciency is still three times lower than that of the US,and?ve times lower than that of Japan.The energy composition relies heavily on fossil energy with88.3%on fossil fuels and70.4%on coal [44].In China,when the economy increases by1%,CO2emissions go up about15million tons.A similar monotonic relationship
Table6
Panel estimation:CO2emissions in the Western region.
FE(19)White(20)N–W(21)DK(22)PCSE(23)FGLS(24)
PGDP8.338e-04***8.338e-04***8.338e-04***8.338e-04***8.696e-04***8.439e-04***
(8.400e-05)(7.950e-05)(1.090e-04)(7.520e-05)(9.250e-05)(4.370e-05)
(PGDP)2à9.730e-08***à9.730e-08***à9.730e-08***à9.730e-08***à1.040e-07***à1.020e-07***
(1.910e-08)(1.760e-08)(2.320e-08)(1.940e-08)(2.100e-08)(1.140e-08)
(PGDP)3 4.330e-12*** 4.330e-12*** 4.330e-12*** 4.330e-12*** 4.670e-12*** 4.490e-12***
(1.360e-12)(1.220e-12)(1.560e-12)(1.250e-12)(1.420e-12)(8.190e-13)
GINI0.9722**0.9722*0.9722**0.9722**0.34330.3794***
(0.3948)(0.4959)(0.4881)(0.3575)(0.4367)(0.2122)
EI0.0574***0.0574***0.0574***0.0574***0.0513***0.0498***
(0.0075)(0.0092)(0.0150)(0.0092)(0.0085)(0.0031)
STR0.00440.00440.00440.00440.00350.0063***
(0.0047)(0.0046)(0.0059)(0.0049)(0.0045)(0.0019)
URBà0.0047***à0.0047***à0.0047***à0.0047**à0.0027**à0.0026***
(0.0012)(0.0011)(0.0016)(0.0017)(0.0012)(0.0004)
Cons7.0504***7.0504***7.0504***7.0504***7.6427***7.5956***
(0.2536)(0.2369)(0.2600)(0.2095)(0.2488)(0.1254)
Province——Yes Yes Yes Yes Year——————R20.92850.92850.92850.9912
Robust Hausman test F-stat=1.0000e+14***
Heteroskedasticity test chi2(28)=112.5300***
Autocorrelation test F(1,27)=5.8240**
Cross-sectional independence test CD=3.1500***
Obs.160160160160160160
*Means signi?cant at con?dence level10%.
**Means signi?cant at con?dence level5%.
***Means signi?cant at con?dence level1%.Figures in parentheses are the standard errors.
388 C.Zhang,W.Zhao/Applied Energy136(2014)382–392
between CO2emissions and income growth has been found in Tur-key[1].However,it is not applicable to all cases that income growth will enhance CO2emissions.According to the EKC hypoth-esis,the relationship between income growth and environmental degradation takes the form of an inverted U-shape,and further income growth is expected to overcome the environmental degra-dation occurred in earlier phases of development[19].It has been proved in the group of OECD countries conducted by Galeotti et al.
[10].The developed areas take the lead in stepping into the down-ward section of the EKC[38],as an expected negative relationship existing in US also con?rms the view[3].
The second?nding is that the impact of income on CO2emis-sions declines continuously from Western region to Central and Eastern regions.This is in accordance with the?ndings of Lu and Lo[23]and Wang and Wei[40].In our opinion,it may be attribut-able to technical progress and human capital.First,the income growth appears to provide incentives for investments in technol-ogy innovation[41].Technical progress,promoting the optimiza-tion of industrial structure,leads to a decrease in CO2emissions effectively[46].By2010,the number of patent applications granted in the Eastern region was562,521pieces,far greater than that in the Central region(84,010)and the Western region(72,753) [45].The level of innovation in China has a gradient distribution from the Eastern region to the Central and Western regions.Sec-ond,the accumulation of human capital is the key to solving the dilemma between income growth and environmental quality [18].The investment in human capital is crucial for economic growth and enhances the mindfulness of energy-saving.By2010 the total stock of human capital in the Eastern region was 183,349units,greater than that in the Central region(128,597) and the Western region(104,324)[45].The total stock of human capital also shows a tendency decreased from the Eastern region to the Central and Western regions.
The third?nding is that the impact of income inequality on CO2emissions in the Eastern China is greater than that of the Western region,while that in the Central region is insigni?cant. Reducing income inequality has a signi?cant impact on CO2 emissions in the Eastern and Western regions.This?nding coin-cides with the view of Meng et al.[26]who con?rmed that an equalizing income growth across regions may reduce emissions. However,it is in contrast with the conclusion by Heerink et al.
[14]that the imbalance in income distribution may improve environmental quality.In our opinion,it can be interpreted by the go-between theory[24].Since the demand of the environ-ment-goods is more?exible,as the income grows,the structure of goods shall be changed to be environment-friendly.As income continues to rise,the income distribution tends to be equal,the relative income of the go-between shall be increased and they would pay more to environment-friendly goods,and environ-mental quality shall be improved.This is in line with the cases of the Eastern and Western regions.We?nd that a more equaling income distribution and a high income level exist in the Eastern region,inducing relatively more typical go-betweens with focus on environmental products.It is similar to a prior conclusion reached by Scruggs[32]that the rich would pay more attention to environmental quality.On the contrary,the Western region, with a greater income distribution gap and a lower income level, has the limited amount of go-betweens willing to consume environmental-friendly products.Also the excessive inequality negatively affects the diffusion of innovations,which harms the development of environmental technologies[39].As for the Central region,the in?uence of income inequality on CO2 emissions is insigni?cant.Other causes such as energy market integration[34],the change of industrial structure,human capital [18]and urbanization may as well remarkably affect environ-mental quality.7.Conclusion and policy implications
Using panel data covering28provinces of China over the period 1995–2010,this paper analyzed the impact of the income and income inequality on CO2emissions with the consideration of regional differences based on the EKC theory.Our results con-cluded that income growth increases CO2emissions in China.The in?uences of income growth on CO2emissions vary across regions. The impact of income inequality on CO2emissions in the Eastern region is greater than that in the Western region.Reducing income inequality has a signi?cant impact on CO2emissions in the Eastern and Western regions.
These results not only contribute to advancing the existing lit-erature,but also deserve particular attention for policy-making. First,China should develop in a more sustainable way.Considering the economic growth potential,China’s CO2emissions are on upward trend.It requires China focus more on quality of economic development.Some efforts,such as low-carbon economy pilot demonstration,environmental taxation reform and trading emis-sions permits are worth exploring in order to control emissions. Other policies related to energy conservation,emission–reduction and climate adaptation should be made following the principle of fairness.Second,policy measures of emission–reduction should allow for regional disparities.The Eastern region,with cleaner technologies and higher energy ef?ciency,has a comparative advantage in emission–reduction.The Central and Western regions face more dif?culties in emission–reduction than the Eastern region.The two regions should be given special consideration when new policies are designed,such as the practice of green tax system,carbon emissions limits and carbon emissions trading. Finally,income redistribution should be further highlighted.Our results reveal that income redistribution from the rich to the poor is bene?cial to environmental improvement.So a more equitable income distribution is a wise response in the developing China, and there is a win–win situation of income redistribution and emission–reduction.In China,income redistribution reform still lies in the guidance and principle,and is lacking of the detailed rules for implementation.To curb rising income inequality,multi-ple measures of income redistribution reform should be taken,spe-ci?cally in aspect of distinguishing tax regulation for low-income and high-income earners,standardized senior executive compen-sation and state-owned enterprises dividends.
Some limitations also exist in our paper.Our analysis only pro-vides an initial interpretation of the impact of income inequality on CO2emissions at the province level.And the mechanisms for income inequality affecting CO2emissions processes are still unknown.In addition,this study is constrained to the years from 1995to2010,due to the lack of availability of statistics.Future research considering dynamics should identify,at what level of income inequality,CO2emissions would reduce in the Eastern, Central and Western regions.
Acknowledgments
We would like to thank two anonymous referees for their detailed and constructive comments.We are also grateful to the Editor,Prof.Jerry Yan,for his encouragement and high ef?ciency.
This research is supported by the Fundamental Research Funds for the Central Universities(No.20720140001)and also supported by Program for New Century Excellent Talents in University of Ministry of Education of China(No.NCET-12-0327).
Appendix A.
Tables A–D.
C.Zhang,W.Zhao/Applied Energy136(2014)382–392389
References
[1]Akbostanc?E,Türüt-As??k S,Tun?G_I.The relationship between income and
environment in Turkey:is there an environmental Kuznets curve?Energy Policy2009;37:861–7.
[2]Auffhammer M,Carson RT.Forecasting the path of China’s CO2emissions using
province-level information.J Environ Econ Manage2008;55(3):229–47. [3]Baek J,Gweisah G.Does income inequality harm the environment?Empirical
evidence from the United States.Energy Policy2013;62:1434–7.
[4]Beck N,Katz JN.What to do(and not to do)with time-series cross-section data.
Am Polit Sci Rev1995;89(3):634–47.
[5]Boyce JK.Inequality as a cause of environmental degradation.Ecol Econ
1994;11(3):169–78.
[6]Clarke-Sather A,Qu J,et al.Carbon inequality at the sub-national scale:a case
study of provincial-level inequality in CO2emissions in China1997–2007.
Energy Policy2011;39(9):5420–8.
[7]Coondoo D,Dinda S.Carbon dioxide emission and income:a temporal analysis
of cross-country distributional patterns.Ecol Econ2008;65(2):375–85.
[8]Driscoll JC,Kraay AC.Consistent covariance matrix estimation with spatially
dependent panel data.Rev Econ Statist1998;80(4):549–60.
[9]Du L,Wei C,et al.Economic development and carbon dioxide emissions in
China:provincial panel data analysis.China Econ Rev2012;23(2):371–84. [10]Galeotti M,Lanza A,et al.Reassessing the environmental Kuznets curve for
CO2emissions:a robustness exercise.Ecol Econ2006;57(1):152–63.
[11]Gawande K,Berrens RP,et al.A consumption-based theory of the
environmental Kuznets curve.Ecol Econ2001;37(1):101–12.
[12]Golley J,Meng X.Income inequality and carbon dioxide emissions:the case of
Chinese urban households.Energy Econ2012;34(6):1864–72.
[13]Ha Y,Teng F.Midway toward the2degree target:Adequacy and fairness of the
Cancún pledges.Appl Energy2013;112:856–65.
[14]Heerink N,Mulatu A,et al.Income inequality and the environment:
aggregation bias in environmental Kuznets curves.Ecol Econ 2001;38(3):359–67.
[15]Herrerias MJ,Joyeux R,et al.Short-and long-run causality between energy
consumption and economic growth:evidence across regions in China.Appl Energy2013;112:1483–92.
[16]Im KS,Pesaran MH,et al.Testing for unit roots in heterogeneous panels.J
Econo2003;115(1):53–74.
[17]Joan M.Distributional issues in ecological economics.Rev Soc Econ
1995;53(4):511–28.
[18]Jun Y,Zhong-kui Y,et al.Income distribution,human capital and
environmental quality:empirical study in China.Energy Proc 2011;5:1689–96.
[19]Kaika D,Zervas E.The environmental Kuznets curve(EKC)theory.Part B:
critical issues.Energy Policy2013;62:1403–11.
[20]Krueger AB,Grossman GM.Environmental impacts of a North American free
trade agreement.National Bureau Econo Res1991.[21]Levin A,Lin C,et al.Unit root tests in panel data:asymptotic and?nite-sample
properties.J.Econ.2002;108(1):1–24.
[22]Liu W,Spaargaren G,et al.Energy consumption practices of rural households
in north China:basic characteristics and potential for low carbon development.Energy Policy2013;55:128–38.
[23]Lu W,Lo S.A closer look at the economic-environmental disparities for
regional development in China.Euro J Oper Res2007;183(2):882–94.
[24]Magnani E.The environmental Kuznets curve,environmental protection policy
and income distribution.Ecol Econ2000;32(3):431–43.
[25]Marsiliani L,Renstrom TI.Time inconsistency in environmental policy:tax
earmarking as a commitment solution.Econo J2000;110(462):123–38. [26]Meng L,Guo JE,et al.China’s regional CO2emissions:characteristics,inter-
regional transfer and emission reduction policies.Energy Policy 2011;39(10):6136–44.
[27]Michieka NM,Fletcher J,et al.An empirical analysis of the role of China’s
exports on CO2emissions.Appl Energy2013;104:258–67.
[28]Newey WK,West KD.Hypothesis testing with ef?cient method of moments
estimation.Int Econo Rev1987;28(3):777–87.
[29]Pedroni P.Fully modi?ed OLS for heterogeneous cointegrated panels.Adv
Econo2001;15:93–130.
[30]Phillips PC,Perron P.Testing for a unit root in time series regression.
Biometrika1988;75(2):335–46.
[31]Ravallion M,Heil M,et al.Carbon emissions and income inequality.Oxford
Econ Papers2000;52(4):651–69.
[32]Scruggs LA.Political and economic inequality and the environment.Ecol Econ
1998;26(3):259–75.
[33]Sha?k N.Economic development and environmental quality:an econometric
analysis.Oxford Econ Papers1994;46:757–73.
[34]Sheng Y,Shi X.Energy market integration and equitable growth across
countries.Appl Energy2013;104:319–25.
[35]Sundrum RM.Income distribution in less developed countries.Psychology
Press;1992.
[36]Thomas V,Wang Y,et al.2001.Measuring education inequality:Gini
coef?cients of education,World Bank-free PDF.
[37]Torras M,Boyce JK.Income,inequality,and pollution:a reassessment of the
environmental Kuznets curve.Ecol Econ1998;25(2):147–60.
[38]Vincent JR.Testing for environmental Kuznets curves within a developing
country.Environ Develop Econ1997;2(4):417–31.
[39]Vona F,Patriarca F.Income inequality and the development of environmental
technologies.Ecol Econ2011;70(11):2201–13.
[40]Wang K,Wei Y.China’s regional industrial energy ef?ciency and carbon
emissions abatement costs.Applied Energy2014;130(1):617–31.
[41]Wang Z,Yin F,et al.An empirical research on the in?uencing factors of
regional CO2emissions:evidence from Beijing city,China.Appl Energy 2012;100:277–84.
[42]White H.A heteroskedasticity-consistent covariance matrix estimator and a
direct test for heteroskedasticity.Econometr:J Econ Soc1980;48(4):817–38.
Table C
Results of panel unit root tests in the Central region.
Variables Levels First difference
LLC IPS ADF PP LLC IPS ADF PP TCà0.5870 2.3550 6.7430 5.7730à5.1710***à3.2160***36.7820***32.3360***
PGDP11.337015.2730 1.88500.2910à0.5060 1.6350*11.2140*18.3980*
GINI 1.20500.801015.849028.0670à6.3220***à4.1290***43.1400***83.1340*** EIà7.6020***à4.0510***42.5770***45.9310***à6.8770***à4.0620***44.3150***43.9100*** STRà1.1320à0.178019.189020.7690à7.2090***à5.1370***53.0420***69.6990*** URBà2.053**à2.2370**31.8170**25.8770*à6.5080***à4.2410***45.1330***53.0950***
*Means signi?cant at con?dence level10%.
**Means signi?cant at con?dence level5%.
***Means signi?cant at con?dence level1%.
Table D
Results of panel unit root tests in the Western region.
Variables Levels First difference
LLC IPS ADF PP LLC IPS ADF PP TCà1.8950** 1.964016.8890 4.5650à4.6260***à3.5060***45.5040***55.0840***
PGDP9.982017.25600.14600.22700.3290à0.4320*41.6600***56.5040*** GINI 2.69100.404016.786017.4790à5.5350***à3.8510***48.1650***73.3280*** EIà5.2800***à4.1080***48.4980***29.1580*à1.5150**à1.2580***27.5120**62.8450*** STR0.4530 1.960011.364011.8180à4.2730***à2.5920***43.5810***59.5420*** URB 2.6630 3.8250 6.0390 5.9090à5.4690***à2.5420***36.8380**37.3180**
*Means signi?cant at con?dence level10%.
**Means signi?cant at con?dence level5%.
***Means signi?cant at con?dence level1%.
C.Zhang,W.Zhao/Applied Energy136(2014)382–392391
[43]Yue X,Li S,et al.How large is income inequality in China:assessment on
different estimates of Gini coef?cient.China Econ J2013;6(2–3):113–22. [44]Zhang C,Xu J.Retesting the causality between energy consumption and GDP in
China:evidence from sectoral and regional analyses using dynamic panel data.
Energy Econ2012;34(6):1782–9.[45]Zhang C,Lin Y.Panel estimation for urbanization,energy consumption and CO2
emissions:a regional analysis in China.Energy Policy2012;49:488–98. [46]Zhou X,Zhang J,et al.Industrial structural transformation and carbon dioxide
emissions in China.Energy Policy2013;57:43–51.
392 C.Zhang,W.Zhao/Applied Energy136(2014)382–392
PH10户外全彩LED显示屏 设 计 方 For personal use only in study and research; not for commercial use
案 书 For personal use only in study and research; not for commercial use For personal use only in study and research; not for commercial use For personal use only in study and research; not for commercial use 目录
第一章简介 (3) 第二章屏体概述 (4) 第三章屏体结构说明 (5) 第四章系统主要参数 (8) 第五章系统报价……………………………………… 10 第六章编辑播放软件………………………………… 11 第七章节目制作软件………………………………… 13 第八章系统可靠性及维护性………………………… 14 第九章工期………………………………………… 17 第十章安装、调试、验收售后服务 (17) 第十一章工程案例图片………………………………… 22 第十二章 LED显示屏基础知识………………………… 27
1、控制板 ?控制系统采用超大规模可编程门阵列器件,大大的简化控制电路设计,系统性能强,稳定性高。 ?采用硬件控制非线性校正技术,LED点阵恒流驱动方式,显示色彩均匀,清晰度高。 ?本系统的灰度等级为256级,三基色可显示16.7M 种色。 ?采用数字信号差分传输方式,使显示屏长距离控制,信号不失真,不延时。
教育心理学的名词解释 1、教学:从心理学角度,可把教学看作是企求诱导学习的一种活动系统或工作制度。 2、课:课是教学的一个基本单位,指在一定的时间内,教师和学生相互作用达到教学目的。它包括三个要素,即一段时间、教师和学生及师生相互作用。 3、正式的学生群体含义:即根据上级正式文件或学校内部正式规定而建立的各种学生群体组织。分类:团结的班集体,散聚的班集体,离散的班集体。 4、教师对学生期望:可以是一种潜移默化的作用,从而有助于学生学习的进步。教师期望的这种效应就是著名的“罗森塔尔效应”、也叫“皮格马利翁效应”。 5、学习目标:行为目标,是对学习者通过教学以后将能做什么的一种明确的、具体的表述。美国俄亥俄州立大学的泰勒教授是学习目标之父。 6、发展的概念:是随着生理年龄的推移,作为经验和内部相互作用的结果而在个体的整个体系内产生的机能构造上的变化过程。这是一种向着更高级的适应发展的不可逆过程。发展的方向:头—尾梯度;近末稍梯度。顺序:感觉运动向主观的直观的“前概念水平”;接着可能在具体的情境中进行逻辑运算;更进一步又发展到形式的、抽象水平上的逻辑运算。发展的一般趋势:综合的分化、平衡化、概念化、社会化、个性化。
7、组织:促使过程系统化和组成连贯系统倾向。调节环境倾向称之为适应。图式:一个有组织的,可重复的行为或思维模式。 8、同化:是儿童使新的感知事物或刺激时间与现有的行为模式,即皮亚杰所谓的图式一体化的过程。 9、顺应:当主题不能利用原有的图示接受或解释新的刺激时,其认知结构随新刺激影响而改变的过程。 10、学习:广义“学习是指学习者在某一特定的情境中由重复经验而英气的对于那个情境的行为的变化,而这种行为的变化是不能更具先天的反应倾向、成熟或学习者的暂时状态来解释的。”“学习是人类倾向或才能的一种变化。这种变化要持续一段时间,而且,不能把这种变化简单地归之于成长的过程。”“学习是人及动物在生活中获得个体的行为经验的过程。”狭义的学习:特指人类的学习。学习这种现象的关键:a要有变化的发生b变化相对持久;c变化与成长或成熟导致的变化分开d变化本身并不具备价值意义,学习不等于进步e是行为变化的过程,而非学习后表现出的结果。学生学习的特点:A间接性学习为主,直接性学习为辅。B组织计划性。C有效性。D年龄差异性。E面向未来特征。 11、消退:条件反射形成后,如果条件刺激不再伴随无条件刺激出现,也就是说不再强化,条件反射的强度将逐渐减低,最后会降低到条件反射不再发生的程度。 12、恢复:消退现象发生后,如个体得到一段时间休息,条件刺激再度出现,这时条件反射可能又会自动地恢复。这种未经强化而条件反射自动重现的现象就被称为恢复。
一、名词解释 1、法律规范是国家立法机关制定或认可的、具体规定权利义务及法律后果的行为规则。 2、推定行为是指当事人用语言文字以外的有目的、有法律意义的积极活动来表达他的意志。 3、要物(实践)法律行为是指除当事人的意思表示之外,还需要以实物的交付为成立要件的法律行为。如保管合同、仓储合同、质押合同等。 4、委托代理是指按照被代理人委托授权而产生代理权的代理行为,也称授权代理或意定代理。 5、撤销权是指当债务人有放弃其到期债权、赠与或低价转让等行为,对债权人造成损害的,债权人可以依法请求人民法院撤销债务人所实施的行为。 6、代理是指代理人在代理权限内,以被代理人的名义进行民事活动,其权利义务后果直接归属于被代理人的一种法律关系。 7、表见代理是指无权代理人因与本人有一定关系,而使第三人信其有代理权,因而与他进行民事行为。 8、预期违约又称先期违约,是指在合同履行期限到来之前,一方虽无正当理由但明确表示其在履行期到来后将不履行合同,或者其行为表明在履行期到来后将不可能履行合同。 9、要约是指当事人一方以订立合同为目的,而向对方提出确定的意思表示,即订约提议。 10、承诺是指受要约人明确同意要约的意思表示,即接受提议。 11、合同是指民事法律关系中平等主体的自然人、法人和其他经济组织之间设立、变更、终止民事权利义务关系的协议。 12、要约邀请是指希望他人向自己发出要约而作出的意思表示,也称要约引诱。 13、合同解除是指合同有效成立后,当具备合同解除条件时,因当事人一方或双方的意思表示而使合同权利义务终止的一种法律行为。 14、不可抗力是指不能预见、不能避免并不能克服的客观情况。 15、格式合同又称标准合同,是指合同的条款由一方当事人预先拟定,另一方当事人只能全部接受或一概拒绝,不能就个别条款进行商洽的合同。 16、抵押(权)是指债务人或第三人不转移对财产的占有,而将该财产作为债权的担保,即当债务人不履行到期债务时,债权人享有对该部分财产进行变现并就其价款优先受偿(的权利)。 17、质押(权)是指债权人为担保债权而根据合同占有债务人或第三人的财产,当债务人到期不履行债务时,能够以该财产折价或以拍卖、变卖该财产的价款优先受偿(的权利)。 18、留置权是指债权人因合同约定占有债务人的动产,如果债务人不履行到期债务,债权人可以留置已经合法占有的债务人的动产,并就该动产优先受偿的权利。 19、公司章程是公司内部组织机构安排和各项活动的基本准则和纲领性文件。 20、公司资本是指公司成立时章程规定的,由股东出资构成的财产总额。 21、法定资本制:设立公司时,必须在公司章程中载明公司的资本总额,并在公司成立时由发起人认足或者缴足的一种资本制度。 22、公司债券是指公司依照法定程序发行的、约定在一定期限还本付息的有价
概述 LED 显示屏是集光电子技术,微电子技术,计算机技术和视频技术为一体的高科技产品,它的发光部分由 LED (即光发二极管)拼装组成的,其优点是耗电量少,亮度高,工作电压低,驱动简单,寿命长,性能稳定。显示屏面积可以根据需要由单元模块任意拼装,响应速度快。 LED 显示屏的出现弥补了以往磁翻板,霓虹灯等信息发布媒体效果的缺陷。以其变化丰富的色彩,图案,实时动态的显示模式,完美的多媒体效果和强大的视觉冲击力,将信息、文字、图片、动画及视频等多种方式显示出来,成为信息传播的划时代产品,在铁路、民航、体育场馆、会议厅堂、高速公路、广场、大型商场、银行、证券市场以及多种监控调度中得到了广泛的应用。 LED 电子显示屏是一种显示文字、图像、二维或三维动画及电视、录像、 VCD 等视频信号的理想的公众信息显示媒体,作为当代高科技发展的产物,它与广告牌、灯箱、霓虹灯等传统宣传媒体比较,具有无可比拟的优势: 1、可实时播放无限的信息(每秒钟高达 60 幅图像); 2、是目前世界上各种宣传媒体中亮度最高的;3、图像清晰、视觉大、功耗低、 寿命极长等。现已在城市的各种行政事业单位得到了广泛的应用,在提高形象和知名度及渲染单位主办各项活动的气氛等方面起到了良好的作用。 1、起到方便公众的作用。 2、起到政务公开的作用。 3、起到宣传相关法规、条例的作用。 4、起到普及知识的作用。 5、起到公告板的作用。 6、起到公益广告的作用。通过显示屏幕可播放天气预报、《文明市民公约》及重要新闻等。 7、起到烘托气氛的作用。通过显示屏幕可播放上级领导及各种贵宾莅临参观、指导的欢迎词,各种重大节日的庆祝词等。 系统实现设计方案 1、LED 生产流程 2、LED 外观设计 公司针对每块显示屏安装的环境,对其进行独特的造型设计,在设计阶段我们认真分析项目的需求,通过与客户的沟通,了解项目的需求关键,根据我们丰富的 LED 大屏幕制作经验以及原厂商的支持、参与,我们制定整个项目的设计方案,确保该方案能够满足系统的功能要求,并具有高实用性、高可靠性、高观赏性。我们的设计原则是功能、结构、外形三位一体,协调统一。既要保证显示屏的功能完善、结构合理、外观现代、大气,同时又要与周围环境很好的融合与呼应,让整个显示屏在所安装的环境中独具匠心。 3、系统软件组成及功能 3.1 系统软件组成系统软件主要由节目编辑软件、播放软件、自动化控制软件、远程通讯软件等几部分组成。软件功能见系统功能部分。
名词解释0、心理学:是研究人的行为和心理活动规律的科学。 1、教育心理学:是一门研究学校情境中学与教的基本心理规律的科学。 2、教学内容:教学内容是学与教的过程中有意传递的主要信息部分,一般表现为教学大刚、教材和课程。 3、教学媒体:是教学内容的载体,是教学内容的表现形式,是师生之间传递信息的工具。 4、教学环境:教学环境包括物质环境和社会环境两个方面。在教育心理学看来,教学环境不仅是课堂管理研究的主要范畴,也是学习过程研究和教学设计研究不能忽视的重要内容。 5、教学过程:教师设计教学情境,组织教学活动,与学生进行信息交流,从而疏导学生的理解、思考、探索和发现的过程,使其获得知识、技能和态度。 6、学习过程:学习过程指学生在教学情境中通过教师、同学以及教学信息相互作用获得知识、技能和态度的过程。 7、观察法:是指研究者通过感官或借助一定的科学仪器,在一定的时间内有目的、有计划地记录、描述客观对象的表现来收集研究资料的方法。 8、心理发展:所谓心理发展是指个体从出生、成熟、衰老直至死亡的整个生命进程中所发生的一系列心理变化。 9、学习准备:学习准备是学生原有的知识水平或心理发展水平对新的学习的适应性,即学生在学习新知识时,那些增进或妨碍学习的个人生理、心理发展的水平和特点。 10、关键期:这是个体早期生命中一个比较短暂的时期,在此期间,个体对某种刺激特别敏感,过了这一时期,同样的刺激对之影响很小或没有影响。
11、守恒:是指指儿童认识到客体在外形上发生了变化,但其特有的属性不变。 12、最近发展区:前苏联心理学家维果斯基认为,儿童有两种发展水平:一是儿童的现有水平,二是即将达到的发展水平。这两种水平之间的差异,即最近发展区。 13、人格:又称个性,是指决定个体的外显行为和内隐行为并使其与他人的行为有稳定区别的综合心理特征。 14、自我认识:个体对自己的心理特点、人格特征、能力及自身社会价值的自我了解与自我评价。 15、认知方式:又称认知风格,系指个体在对信息加工过程中表现出来的个体差异,它是一个人在感知、记忆和思维过程中经常采用的、受到偏爱的和习惯化了的态度和风格。 16、学习:广义的学习指人和动物在生活过程中,凭借经验而产生的行为或行为潜能的相对持久的变化。 17、人的学习:是在社会生活实践中,以语言为中介,自觉地、积极主动地掌握社会和个体的经验的过程。 18、学生的学习:是在教师的指导下,有目的、有计划、有组织、有系统地进行的,是在较短的时间内接受前人所积累的科学文化知识,并以此来充实自己的过程。 19、桑代克提出的一种学习理论,他把人和动物的学习定义为刺激与反应之间的联结,联结是通过盲目尝试、逐步减少错误而形成的,即通过试误形成的。尝试—错误说提出了效果律、练习律、准备律三条学习规律。 20、完形—顿悟说:是由格式塔心理学家苛勒等人提出的学习理论,他们认为学习不是盲目尝试,而是对情境的一种突然领悟和理解,是在主体内部构造完形的过程。
以下资料选自王轶主编:《民法练习题集》(第二版),中国人民大学出版社,2008. 一、名词解释 1紧急避险,是侵权民事责任的免责事由之一,是指为了使公共利益、本人或者他人的财产、人身或者其他合法权益免受正在发生的危险,而不得已采取的致他人较小损害的行为。其构成要件如下: (1)危险的紧迫性。所谓紧迫性,即合法权益正遭受危险。(2)避险措施的必要性。所谓必要性,是指避险人在不得已的情况下采取避险措施。不采取该措施就不足以使合法权益免受正在遭受的危险,不足以保护较大的合法权益。 (3)避险行为的合理性。所谓合理性,是指避险行为适当并不得超过必要的限度。必要限度要求避险行为造成的损害应当小于危险可能造成的损害。 2特殊侵权行为,是指当事人因与自己有关的行为、物件、事件或者其他特别原因致人损害,依照民法上的特别责任条款或第其
特点在于:者民事特别法的规定应当承担民事责任的行为。.一,特殊侵权行为适用严格责任或者公平责任。第二,特殊侵权行为由法律直接规定。此处的法律包括民法的特别规定和民事特别法的规定。第三,特殊侵权行为在举证责任的分配上适用倒置原则,即由加害人就自己没有过错或者存在法定的抗辩事由承担举证责任。第四,法律对特殊侵权行为的免责事由作出了严格规定。第五,特殊侵权行为的责任主体和行为主体存在分离现象。3严格责任是侵权责任的归责原则之一,是指基于法律的特别规定,受害人能够证明所受损害是加害人的行为或物件所致,即推定加害人存在过错并应当承担民事责任,加害人能够证明存在法定抗辩事由的除外。严格责任的特点在于:第一,免除受害人对加害人的过错所承担的举证责任。第二,实行举证责任倒置,由被告就自己没有过错承担举证责任。第三,严格责任的适用有明确的限制,即主要适用于《民法通则》规定的几种特殊侵权行为,法律对严格责任的免责事由作出了严格的规定,主要包括受害人的过错、第三人的过错、不可抗力等。 4共同危险行为,又称为准共同侵权行为,是指两个或者两个以上的行为人实施可能造成他人损害的危险行为并实际致人损害,而无法确定加害人的侵权行为。由于无法确定加害人,法律推定各行为人的行为与损害后果之间都存在因果关系。因此,各行为人都是加害人,并承担连带责任。根据法律规定,如果加害人可以举证证明推翻因果关系的推定,即加害人能够证明损害后果
心理:是感觉、知觉、记忆、思维、情感、意志和气质、能力、性格、等心理现象的总称。 个性:个性是个体带有倾向性的本质的,比较稳定的心理特征的总和,其中包括气质、性格、能力等。 气质:气质是人的个性心理特征之一,指某个人典型地表现于心理过程的强度、速度和稳定性以及指向性特点等 动力方面的特点。 挫折:当个人从事有目的的活动时,在环境中遇到阻碍或干扰,其动机不能满足时的情绪状态。 群体:由相互依赖、相互影响的人为了某种共同目标,按照一定方式结合在一起的集合体。 需要:人们对某种目标的渴求或欲望 期望:是指一个人根据以往的经验在一定时间里希望达到目标或满足需要的一种心理活动。 情感:情感是人脑的机能,是人们对客观事物的一种态度的体验,是对事物好恶的一种倾向 性格:在一个人的生理素质的基础上,在社会实践活动中逐渐形成发展和变化的,并且具有一定复杂性、独特性、 整体性和持续性 社会认知:是指个体在社会环境中对自己及他人的心理特征和行为进行感知、判断和解释以作进一步反应的 心理过程。
组织文化:是一个组织由其价值观、信念、仪式、符号、处事方式等组成的其特有的文化形象 群体压力:是群体利用群体规范对其成员产生的一种影响力。 群体规范:群体规范是为保障群体目标的实现、群体活动的一致性,统一群体的信念,价值观和行为而建立 的约束群体成员的行为准则。 从众行为:是指在群体压力下,个人改变自己的态度,放弃自己原先的意见,在行为上表现出与大多数人相 符的现象。 群体凝聚力:是群体成员之间相互吸引并愿意留在群体中的程度。 五种理论:麦格雷戈《管理理论X或Y抉择-----企业的人性面》一文,反对X理论(对泰勒制的总结和概括),主张Y 理论。 超Y理论 梅约在《工业文明中人的问题》提出人群关系理论 日裔美国人威廉.大卫提出Z理论 五种人性假设:1965埃德加.施恩在《组织心理学》提出经济人假设,社会人假设(大题或者选择题),自我实现人假设和复杂人假设。1982迪尔和肯尼迪针对Z理论提出了文
1.年龄特征:是个体心理发展各年龄阶段所表现出来的一般的、典型的、本质的特征。心理年龄特征是心理的基本特点。心理年龄特征是个体在一定年龄阶段心理发展水平的标尺,它是从许多同龄人心理发展的事实中通过概括并与不同年龄个体的心理特征进行比较而被确认的。 2.图式:是指支配儿童行动的心理模式,儿童通过这种认知结构感性地适应并组织他们周围的环境。皮亚杰认为儿童在出生时就具有一些与环境相互作用,从环境中获取意义的固有倾向,即原初的图式,如吮吸就是一种最初的图式。 3.同化:就是把新感知的材料或经验纳入已有的图式中以理解新事物的过程。 4.顺应:改变已有图式来理解新经验的过程称为顺应。 5.客体永久性:是指儿童脱离了对物体的感知而仍然相信该物体持续存在的意识。如和乳儿做“藏猫儿”游戏时,你藏起来,不见了,他还用眼睛到处寻找。儿童大约在9—12月获得客体永久性。 6.最近发展区:是维果斯基用来解释儿童怎样学习的另一个重要概念。这种儿童在指导下借助成人的帮助所能达到解决问题的水平与在独立活动中所达到的解决问题的水平之间的差异就是“最近发展区”。 7自我同一性:对我是谁、我存在的意义是什么、我要完成什么样的使命的认定 8学习风格:指学习者在完成学习任务是表现出来的一贯的、典型的、独具个人特色的学习策略和学习倾向。 9认知风格:认知风格又称认知方式,指的个体感知,记忆、思维、解决问题、决策以及信息加工的典型方式。 10泛化:条件反射建立后,条件刺激和类似刺激都会引发条件反应,这种现象就称为泛化。11分化:条件建立后,为了避免有机体对所形成的条件反射发生泛化,需要通过辨别学习,是有机体对某些刺激做出反应,而对其他反应不作出反应。这一过程就称为分化。 12消退:指的是在没有无条件刺激的伴随下,多次单独呈现出条件刺激,使得条件反射逐渐减弱甚至消失的过程。 13、准备律:情境与反应间的联结是否能够建立,取决于个体身心的准备状态。若个体处于准备反应的状态下,此时引发反应会让其获得满足;若个体没有准备却让其作出反应,或个体处于准备状态下却不让其反应,都会引起不良的学习后果。准备律实际上体现了学习的动机原则,个体的准备状态作为学习的先行条件,是十分重要的。(P 103) 14.效果律:情境与反应的联结是否能建立,依反应之后是否能获得满足的效果而定,即“满意或不舒适的程度越高,刺激—反应联结就越加强或越减弱”。(P104) 15.练习律:对于已形成的联结,经常练习会增强联结(使用律),不用则会使联结减弱甚至消失(失用律)。不用的时间越长,则联结的力量减弱越甚;练习的时间越近,则联结的保持时间越长。(P104) 16.观察学习:观察学习主要经历四个过程,即注意过程、保持过程、动作再现过程、动机过程。注意过程是观察者对榜样进行知觉的过程。榜样和榜样行为的特点,观察者的特点,以及观察者和榜样的关系都会影响这一过程。保持过程是观察者对榜样示范信息的储存。观察者对所观察到的行为在记忆中以言语或图像等符号形式进行储存,此阶段对进行编码的符号系统的选择显得极为重要。动作再现过程是观察者根据储存的信息亲身再现榜样行为。观察者对榜样信息的储存和提取会对榜样信息的储存和提取会对这一过程的顺利产生影响。动机过程是上述三个过程后,学习者可能会将所观察到的行为表现出来。而这四个过程紧密联系不可分割。(P118) 17.普雷马克原理:也叫祖母原则,指用高频的活动作为低频活动的有效强化物。简单地说,每个人都有一个强化等级,在强化等级中,处于较高一级的强化物比处于较低一级的强化物更容易引发操作行为,所以处于较高一级的活动可以强化处于较低一级的活动。(P108) 18. 潜伏学习:托尔曼将这种动物在未获得强化之前就已经获得但没有表现出来的学习称为“潜伏学习”。补充实验结果说明(外在的刺激物和强化物不是学习产生的必要条件,没有强化也会出现学习,只是这时学习的效果没有表现出来而已。(P 133) 19学习共同体:所谓学习共同体,是指一个由学习者及其助学者共同构成的团体。在尊重个
A 一、概念解释 1、侵权行为法 2、侵权请求权竞合 3、单独责任 4、抗辩事由 5、直接责任 6、定期xx赔偿 二、简答题 1、侵权行为法的渊源 2、一般侵权行为的构成要件 3、我国侵权行为的主要责任方式 4、共同侵权行为及其类型 5、人身损害赔偿的一般范围 6、如何正确认识精神损害的表现 三、论述题 1、侵权行为的归责原则 2、侵权行为法的目的 四、法条分析题 我国民法通则第一百零六条第二款规定:
公民、法人由于过错侵害国家的、集体的财产,侵害他人财产、人身的,应当承担民事责任。没有过错,但法律规定应当承担民事责任的,应当承担民事责任。 试分析本条法规的基本含义,说明该条文的在我国侵权行为法中的意义,并指出其不足之处。 五、案例分析 案例分析: 陈志光夫妇到某餐厅吃饭,一对母女带着一只狗坐在陈志光夫妇的对面,点来了饭菜,让狗在饭桌上吃,小狗则吃得津津有味。陈志光夫妇认为自己的人格尊严受到了损害,要求餐厅老板解决,没有得到满意的答复,遂向法院起诉,要求餐厅老板赔偿精神损害。 分析本案并回答以下问题 1、本案被告是否构成侵权行为,为什么? 2、本案如何判决(请说明责任方式),为什么? 参考答案要点 一、 1、侵权行为法是指有关侵权行为的认定、制裁,以及对侵权损害后果如何补救的民事法律规范的总和。 2、侵权请求权与依其他民事规范产生的请求权是由同一法律事实发生,形成的侵权请求权与其他请求权的竞合。 任方式的侵权责任形态。 4、抗辩事由是指被告针对原告的诉讼请求而提出的证明原告诉讼请求不成立或不完全成立的事实。
5、直接责任是指违法行为人由于自己的过错造成的他人人身损害和财产损害由自己承担的侵权责任形态。 6、定期金赔偿是指侵权责任人按照确定的时间、确定的货币数额或计算方法和给付方式,向受害人承担赔偿责任的方式。 二、 1、宪法、民法基本法、民事单行和特别法、其他法律文件中的民法规范、最高人民法院的司法解释。行政规章和地方法规、习惯以及基本法理也可以参考。 2、一般侵权行为的构成要件是: 行为的违法性、损害结果的发生、行为与损害之间的因果关系、行为主观上具有过错。 3、返还财产、恢复原状、赔偿损失、停止侵害、消除影响、恢复名誉、赔礼道歉、排除妨碍、消除危险。 4、共同侵权行为是指两个以上的行为人,给予共同的过错侵害他人合法民事权益,应当承担连带责任的侵权行为。类型有: 典型的共同侵权行为、共同危险行为、视为共同侵权行为和合伙致人损害。 5、人身损害的常规赔偿、劳动能力丧失的赔偿、致人死亡的赔偿、扶养来源的损害赔偿、抚慰金赔偿。 6、精神损害表现在精神利益的损害和精神痛苦。精神利益的损害是指精神利益本身的贬损、降低或者减少,精神痛苦是指受害人的精神状态发生沮丧、焦躁等等各种痛苦。 三、 1、侵权责任的归责原则
户外全彩LED广告屏投资效益分析报告 一、LED大屏幕简介 户外LED大屏幕广告是21世纪广告业发展的趋势,是具有音视频功能的户内外广告展示设备,属国际领先的高科技产品。该设备外观新颖独特,其面积可随意调整,不仅能播放音视频广告节目,而且四面还可装固定灯箱广告位,现各地政府都鼓励推行使用户外LED屏,陆续取消帆布广告、灯箱广告审批。户外LED屏是帆布广告、灯箱广告的理想替代产品,能为您带来巨大的社会效益和丰富的经济效益。 二、主要特点 1.户外全彩LED显示屏广泛应用在公共场所、广告宣传、城市道路网、城市停车场、铁路、地铁等交通引导系统、高速公路等。 2.采用VGA同步技术,大屏内容与CRT同步,更换广告内容简洁方便;超大画面、超强视觉、亮度高、寿命长。 3.色彩丰富,显示方式变化多样(图形、文字、三维、二维动画、电视画面等)。 4.外观新颖独特,可提升城市科技水平,丰富城市居民文化生活,居民更易接收。 三、户外全彩LED显示屏广告优势 1、具有流动性、强制性、针对性、实效性等特点。 2、节目优势。自制节目,即时播放,内容丰富。不仅仅有广告,还有节目。包括专题、专栏、综艺、动画、广播剧、电视剧,节目间隙插播广告。 3、地段优势。主要安装在商场等人流量集中的地段,其中LED全彩大屏幕更是安装在地标性地段,其传播效应更震撼、更具强制性 现代社会是一个讲求视觉经济的社会,商品销售注重的是先入为主,谁能在第一时间内争取到潜在顾客,并把自己的商品信息传递到目标客户那里,谁也就抓住了第一商机。 LED多媒体广告信息屏是21世纪新型户外广告媒体。可轮番地在画面上显示色彩纷呈的图形与文字,能在较短的时间里展示多个不同的厂家、不同牌号的商品信息,具有动感、多变、新颖别致、反复播放等特点,能够引起受众的极大兴趣,达到了良好的广告效果。 它具有以下特点: 1、亮度超高。LED显示屏显示的内容都能让顾客在很远的地方看见,特别是在晚上,超高的亮度、独特的商品信息更能引人前往,让你的店面比其他店面引来更多的顾客,也就相当于引进了更多的财富。 2、可变性强。LED屏幕是通过控制LED灯泡的发光规则改变内容,不向霓虹灯那样,一旦固定就不可改变。通过电脑你可以随时更改你的商品信息,从欢迎顾客的欢迎词到五一、圣诞的促销信息,甚至是利用彩色LED显示屏显
精品文档 三、名词解释 1、管理心理学:管理心理学是研究管理过程中人的心理现象、心理过程及其发展规律的科学。它探讨、揭示管理活动中个体心理、群体心理、组织行为和领导心理和行为的规律,找出激励人的行为动机的各种途径与方法,以求最大程度上的发挥人的潜能,提高人的工作效率,以实现组织目标。 2、态度:态度就是个体对某一对象所持有的稳定的认知评价、情感和行为倾向。态度是刺激与个体行为反映的中介变量。态度决定着人们的工作行为和生活方式,是预测个体行为的较好指标之一 3、心理健康:所谓心理健康是指在身体、智能以及情感上与他人的心理健康不相矛盾的范围内,将个人的心境发展到最佳状态。 4、心理压力:简称压力,心理压力是指个体在环境中受到种种刺激因素的影响而产生的一种紧张情绪 5、群体士气:指员工对群体的认同感和满意感,愿意为达到群体的目标奋斗的精神状态。士气是群体存在和发展的重要动力之一,是提高群体工作效率的重要保证。 6、从众:指个人的观念与行为由于群体的引导或压力,而向与多数人相一致的方向变化的现象, 个体的行为表现出与群体行为一致的现象称为从众行为。 7、群体规范:是群体所确定的每个成员都必须遵守的行为标准。它常常是一个可以接受或容忍的范围,而不是一些细则,它常常是约定俗成的,不成文的,而不是通过一定的程序正式规定的 8、强化:是指通过不断改变环境的刺激因素来达到增强、减弱或消除某种行为的过程。 9、群体凝聚力:群体凝聚力就是群体对其成员的吸力,群体成员间的心理亲和力,也称为内聚力。 10、第一印象:第一印象是一种原初印象。在与陌生人交往的过程中,所得到的有关对方的最初印 象称为第一印象。第一印象并非总是正确,但却总是最鲜明、最牢固的,并且决定着以后双方交 往的过程? 11、胃亡力:能力是个性的组成部分,是直接影响活动效率,使个体顺利完成活动所必须具备的心理特征。 12、领导方格图理论:方格图理论也是分析领导行为的二维方法,一维为纵轴称为“对人的关心程度” 一维为横轴称为“对生产的关心程度” ,再将横轴与纵轴划分为1至9个标度,作为衡量关心人和关心生产程度的标准。 13、组织结构:组织结构是管理主体形式管理职能,经过设计而形成的相对稳定的结构模式。组织内外环境变化,是组织结构变化的决定性条件。
遇到信托法问题?赢了网律师为你免费解惑!访问>> https://www.doczj.com/doc/fd9515274.html, 特殊侵权行为的名词解释 根据侵权行为的性质不同,我国侵权责任法将侵权行为会为一般侵权行为与特殊侵权。如果有特殊侵权的,是需要承担相应的特殊侵权责任的。那么,特殊侵权行为的名词解释是怎样的呢?今天,赢了网小编整理了以下内容为您答疑解惑,希望对您有所帮助。 特殊侵权行为,是指由法律直接规定,在侵权责任的主体、主观构成要件、举证责任的分配等方面不同于一般侵权行为。应适用民法上特别责任条款的致人损害的行为 特殊侵权行为类型:
(一)国家机关公职人员致人损害的民事责任 国家机关公职人员在执行职务中给他人造成的损害,只有在法律有规定,而且是在执行职务不当的条件下,才由国家机关承担民事责任。国家机关公职人员利用职权故意使他人受到损害的,由公职人员自己承担民事责任。国家机关公职人员不是在执行职务中给他人造成损害的,也由他自己承担民事责任。 (二)雇佣活动或雇佣关系中侵权行为的民事责任 从事雇佣活动,是指从事雇主授权或者指示范围内的生产经营活动或者其他劳务活动。雇员的行为超出授权范围,但其表现形式是履行职务或者与履行职务有内在联系的,应当认定为从事雇佣活动。根据《人身损害赔偿解释》第9条规定,雇员在从事雇佣活动中致人损害的,雇主应当承担赔偿责任;雇员因故意或者重大过失致人损害的应当与雇主承担连带赔偿责任。雇主承担连带赔偿责任的,可以向雇员追偿。 (三)帮工活动中侵权行为的民事责任 为他人无偿提供劳务的帮工人,在从事帮工活动中致人损害的,被帮工人应当承担民事赔偿责任。被帮工人明确拒绝帮工的,不承担赔偿。
概述 LED显示屏是集光电子技术, 微电子技术, 计算机技术和视频技术为一体的高科技产品, 它的发光部分由LED( 即光发二极管) 拼装组成的, 其优点是耗电量少, 亮度高, 工作电压低, 驱动简单, 寿命长, 性能稳定。显示屏面积能够根据需要由单元模块任意拼装, 响应速度快。 LED显示屏的出现弥补了以往磁翻板, 霓虹灯等信息发布媒体效果的缺陷。以其变化丰富的色彩, 图案, 实时动态的显示模式, 完美的多媒体效果和强大的视觉冲击力, 将信息、文字、图片、动画及视频等多种方式显示出来, 成为信息传播的划时代产品, 在铁路、民航、体育场馆、会议厅堂、高速公路、广场、大型商场、银行、证券市场以及多种监控调度中得到了广泛的应用。 LED电子显示屏是一种显示文字、图像、二维或三维动画及电视、录像、VCD等视频信号的理想的公众信息显示媒体, 作为当代高科技发展的产物, 它与广告牌、灯箱、霓虹灯等传统宣传媒体比较, 具有无可比拟的优势: 1、可实时播放无限的信息( 每秒钟高达60幅图像) ; 2、是当前世界上各种宣传媒体中亮度最高的; 3、图像清晰、视觉大、功耗低、寿命极长等。现已在城市的各种行政事业单位得到了广泛的应用, 在提高形象和知名度及渲染
单位主办各项活动的气氛等方面起到了良好的作用。 1、起到方便公众的作用。 2、起到政务公开的作用。 3、起到宣传相关法规、条例的作用。 4、起到普及知识的作用。 5、起到公告板的作用。 6、起到公益广告的作用。经过显示屏幕可播放天气预报、《文明市民公约》及重要新闻等。 7、起到烘托气氛的作用。经过显示屏幕可播放上级领导及各种贵宾莅临参观、指导的欢迎词, 各种重大节日的庆祝词等。 系统实现设计方案 1、LED生产流程 2、LED外观设计 公司针对每块显示屏安装的环境, 对其进行独特的造型设计, 在设计阶段我们认真分析项目的需求, 经过与客户的沟通, 了解项目的需求关键, 根据我们丰富的LED大屏幕制作经验以及原厂商
组织变革:所谓组织变革是指通过对组织的结构进行调整修正,使其适应不断变化的外部环境和内部条件的过程。 组织发展:所谓组织发展是指运用组织行为学的理论和方法,对组织进行有计划的、系统的改革,以便促使整个组织更新和发展的过程,其目的在于提高组织的效能。 绩效考核:所谓绩效考核是对组织或个人的工作成绩和效果进行全面的考察与核定的程序、方式、方法的总称。 组织形象战略:所谓组织形象战略是“将企业经营理念和个性性质,通常统一的视觉设计加以整和传达,使公众产生一致认同感和价值观,从而创造最佳经营环境的一种商品经营之道”。 家族主义:所谓家族主义就是把家庭的伦理道德移植到集团中,而企业管理活动的目的和行为又都是为了保持集团的协调、维护集团的利益、充分发挥集团的力量 组织文化:所谓组织文化是在长期的生存和发展中所形成的,为本组织所特有的,且为组织多数成员共同遵循的最高目标、价值标准、基本信念和行为规范等的总和及其在组织活动中的反映。 组织设计:所谓组织设计是指对组织活动和组织结构的设计过程,是把任务、责任、权力的利益进行有效组合和协调的活动。 环境:所谓环境是指外部的竟争、购销状况与市场需求,也包括整个社会文化背景的要求与影响。 组织的目标:所谓组织的目标是在企业管理中,目标可能是外界实在的对象,也可能是理想的或精神的对象。
组织:所谓组织是一个有共同目标和一定边界的社会实体和活动过程及活动系统。 决策:所谓决策就是作出决定,是人们在改造世界的过程中,寻找并实现某种最优化预定目标的活动。 管理坐标图:所谓管理坐标图是一种采用图示和量表方式来衡量一个企业领导人的管理方式 领导:所谓领导是对群体或个体施加心理影响,使之努力实现组织目标并与环境保持一致的过程。而施加心理也许的人是领导。 人际关系:所谓人际关系,管理心理学则认为,它是组织环境中人与人之间的交往和联系。它既包括心理关系,也包括行为关系。它是一群相互认同、情感相互包容、行为相互近似的人与人之间联结成的关系。 沟通:所谓沟通,就是信息交流,它可以是通讯工具之间的信息交流, 如电报、电话等。 信息沟通:所谓信息沟通,是指在管理中发生的、两个或两个以上的人或群体,通过一定的联络渠道,传递和交换各自的意见、观点、思想、情感与愿望,从而达到相互了解、相互认识的过程。 群体凝聚力:所谓群体凝聚力或称群体内聚力,是指群体对其成员的吸引力,以及群体成员之间的相互吸引力两个方面。 集体主义自决:所谓集体主义自决指的是以集体主义思想为指导,对群体的意见经过独立分析后所作出行为反应。 群体压力:所谓群体压力,是指当一个人在群体中与多数人的意见或行为不一致时,所感受到的心理压力。
侵权行为是民事主体违反民事义务,侵害他人合法权益,依法应当承担民事责任的行为。无过错责任原则指在法律有特别规定的场合,以已经发生的损害结果为价值判断标准,与该损害结果有因果关系的行为人,不问有无过错,都要承担侵权民事责任的归责原则。 侵权责任法是规定侵权行为及其法律责任的法律规范的总和。 侵权责任关系,是因行为人自己的加害行为或准侵权行为侵害受害人的受到侵权责任法保护的民事权益而产生的以损害赔偿为主要内容的民事法律关系。 侵权的民事责任简称为侵权责任,是指赔偿义务人对自己的加害行为或者准侵权行为造成的损害等后果依法所应当承担的各种民事责任形式之总和。 归责,是指行为人因其行为和物件致他人损害的事实发生后,应以什么依据使其负责。 归责原则,是指确定侵权行为人承担侵权民事责任的一般准则。即在损害事实发生的情况下,确定侵权行为人对其行为所造成的损害是否需要承担民事责任的原则。 过错责任原则以过错作为价值判断标准,判断行为人对其行为造成的损害应否承担侵权责任的归责原则。即在损害发生的情况下,与此相关的行为人谁有过错谁就应承担民事责任,没有过错的行为人不应承担民事责任。 过错推定责任的含义:行为人致人损害时,如果不能证明自己没有过错,就要推定其有过错并承担侵权责任。 无过错责任原则指在法律有特别规定的场合,以已经发生的损害结果为价值判断标准,与该损害结果有因果关系的行为人,不问有无过错,都要承担侵权民事责任的归责原则。 公平责任原则是指加害人和受害人都没有过错,在损害事实已经发生的情况下,以公平考虑作为价值判断标准,根据实际情况和可能,由当事人双方公平地分担损失的归责原则。 见义勇为因防止、制止他人民事权益被侵害而使自己受到损害的,由侵权人承担责任。侵权人逃逸或者无力承担责任,被侵权人请求补偿的,受益人应当给予适当补偿。 一般侵权责任的构成要件,是指承担一般侵权责任的各种作为必要条件的因素。 损害广义的理解中损害包括人身损害与财产损害,狭义的理解中损害则专指财产损害,人身损害称为非财产损害或精神损害。不过,现一般都用广义。 加害行为是一般侵权行为的构成要件之一。加害行为是行为人实施的加害于受害人民事权益的不法行为。既包括加害人自己侵害他人受到侵权责任法保护的民事权益的行为,也包括雇员、被监护人等致人损害或物件致人损害的事实状况。 侵权责任法上的因果关系是指损害结果与造成损害的原因之间的关联性。 过错是指加害人的一种可归责的心理状况,表现为故意和过失两种形式 侵权的民事责任方式指所承担的侵权责任的具体表现形式。 损害赔偿是指赔偿义务人通过支付一定数额金钱的方式承担对受害人的损害予以救济的责任。 惩罚性赔偿是指超过实际损害的范围判决加害人或者对损害负有赔偿义务的人对受害人予以额外的金钱赔偿,以示对加害人的惩罚。 广义的责任抗辩,是指在侵权案件中,被告针对原告的指控和请求,提出的一切有关免除或者减轻其民事责任的主张。 狭义的责任抗辩,仅指被告针对原告的指控和请求,通过提出抗辩事由而免除或者减轻其民事责任的主张。 正当防卫是对正在进于不法侵害的行为人采取造成一定损害的方法,以防防止公共利益,本人或他人的人身和其他权利免遭侵害的有限度的行为。 紧急避险为了使国家、公共利益、本人或者他人的人身、财产和其他权利免受正在发生的危险,不得已采取的紧急避险行为,造成损害的,不负刑事责任 数人共同侵权责任数个独立的责任主体对同一损害后果承担侵权责任的形式
户外P5全彩LED显示屏应用概述及参数 1.视频播出功能 1)、可以直接接入播放有线电视节目; 2)、播放摄像机,清晰、无闪烁的实进显示视频图像,实现各种节目的现场直播; 3)、播放录像机、影碟机(TV、VCD、DVD、LD)等视频节目,满足文件活动的基本需求; 4)、可以播放AVI、MOV、MPG、DAT、VOB等五种格式的文件; 5)、亮度、对比度、饱和度、色度可以通过软件调节; 6)、具有重叠(VGA+VIDE)、影像(Video)、VGA三种显示模式; 7)、具有Video影像压缩控制功能 8)、具有移动补偿功能 9)、有一路音频信号提供给功放使用,并预留至少2路摄像视频输入接口 10)、具有及微机同步显示功能,即所谓的所见即所得; 11)、不会有“拖尾”、“频闪”、“水波纹”等现像 2.信息发布功能 1)、可以显示各种计算机信息、图形、图画及二、三维动画等,具有丰富的播放方式,显示滚动信息、通知、标语口号等,存储数据信息容量大; 2)、有多种中文字体和字型可供选择,还可以输入英文、法文、德文、希腊文、俄文及日文等诸多的外文; 3)、播出系统具有多媒体软件,可灵活输入及播出多种信息;可播放文本信息,播放形式可滚点、滚行、引入引出模式、可上移、左移,消息可循环播出。字体、字号可任意选择、可设置播放速度,另外多条消息可同时播出、或及动画、图像同时播出。 4)、可进行日期、时间显示或字符串、表达式显示; 5)、用于国家政策、法规及服务承诺的宣言; 6)、天气预报的播放; 7)、其他公众信息的发布; 3.控制及网络功能
(1)、通过控制微机实现对大屏幕电力控制柜的自动远端控制,对大屏幕进行远程操作等;(2)、配有网络接口可以及计算机联网,同时播出网络信息,实现网络控制; (3)显示系统结构图 全彩色LED显示屏系统拓扑图 4.显示屏参数 显示屏类型PH5户外表贴全彩色LED视频显示屏 屏体组成发光像素数量40000个 发光点构成1R1PG1PB(1红1纯绿1纯蓝) 发光点间距5mm 发光器件 红管台湾晶元 绿管台湾晶元 蓝管台湾晶元 发光点尺寸5㎜×5㎜ 屏体尺寸高2560mm×宽1440mm 屏体分辨率512*288
护理学基础重点名词解释 1、护理学(nursing)是一门研究维护、增进、恢复人类身心健康的护理理论、 知识、技术及其发展规律的应用科学。 2、护理(nursing)诊断和处理人类对现存的或潜在的健康问题的反应。 3、健康(health)WHO指出:健康不仅是没有疾病和虚弱,还要有完整的生理、心理和社会的安适状态。 4、安适(wellness)安适是生命充满活力和完美感觉的主观感受,是能客观描述的一种状态,存在不同胡水平,并能绘制成一线形连续体。即生理安适、社会安适、情感安适、智能安适、精神安适。 5、疾病是指机体的某部分、器官或系统的结构和功能的异常或紊乱。 疾病(现代疾病观认为的疾病)是机体在内外因素作用下而引起的一定部位的结构形态、代谢和机能的变化,表现为损伤与抗损伤的整体病理过程,是机体内外环境动态平衡状态的破坏或机体偏离正常状态的过程。 6、患病(illness)是不健康的主观体验,是个体生理、心理、智能、社会、发展或精神功能的良好体验减退或受损的状态。 7、疾病行为(illness behavior)是指人们在患病时采取的应对疾病所致的机体功能改变的一般性行为,它伴随疾病而存在,与疾病的发生、发展和转归有直接或间接的关系。 8、健康促进(health promotion)是指在人与环境相互作用过程中,采取行动提高生活质量。其目的是发挥健康潜能,促进健康行为,提高健康水平。 WHO 指出:健康促进是赋予人们提高控制和改善自身健康能力的过程。 9、健康保护(health protection)或疾病预防是人们采取行动预防和对抗疾病的过程。它以问题为导向,采取发现问题、改善环境和行为及提高身体抵抗力的方法,消除、减缓或改变疾病过程。 10、初级预防保健(primary prevention)又称一级预防,是最积极有效的预防措施,始于疾病或功能障碍出现之前,包括健康促进和健康保护或疾病预防两个方面。 11、二级预防保健(secondary prevention)又称为发病学预防,由有组织的、直接的健康普查或大众教育组成,目的在于促进疾病的早期诊断,早期治疗,从而尽可能逆转疾病的病理过程、尽早阻止疾病的进展和限制伤残的发生。
P6户外表贴全彩LED显示屏 设 计 方 案 书 项目联系人:钟文金 联系电话: 设计公司: 深圳市科彩芯光电科技有限公司 设计日期: 2017年6月2日 一、企业介绍 1.公司概括: 深圳市科彩芯光电科技公司初成立于2012年,主营室内外LED全彩显示屏,是LED显示屏应用领域综合服务供应商、深圳知名LED显示屏OEM/ODM供应商。 从最初的生产LED模组、器件,发展到具有行业领先技术研发实力的LED全彩显示屏,科彩芯专注于服务一系列的专业化市场:广告传媒、地产商圈、各类高级卖场、体育场馆、大型活动与娱乐、市政工程等,为之提供形态各异的LED应用产品解决方案。今天,科彩芯的LED显示屏产品,被广泛运用于全球数十个国家,不断在国内外树立样板,逐渐成为业界颇具竞争力的知名品牌。 科彩芯光电秉承“诚信!负责!共荣!”、“终身合作!”的经营理念,多年来在国内外成功树立近1000多个典型案例!公司的信誉和服务得到业届一致好评,
LED显示屏领域未来领先企业之一!诚信是我们的形象,沟通协作是我们的服务宗旨。公司一直本着“客户至上,质量第一”的理念,依托雄厚的财力和济济人才,致力在高端LED领域坚持创新,坚持领先,为世界和中国光电子高科技的发展,为国家半导体照明工程作出贡献。我们热诚欢迎海内外客商亲临指导,交流,携手共创LED应用产业美好未来! 深圳市科彩芯光电研发制造的LED应用产品种类齐全、产品结构多样化,其中: ◆ LED显示屏系列涵盖户内和户外,包括:1、租赁产品;2、广告牌;3、高速公路牌;4、异型彩屏;5、球场屏;广泛应用于各种公共场所,如商业广场、政府机构、体育场馆、交通设施、金融构等所在,在国内市场占据着行业主导地位。 深圳市科彩芯光电以“认真、严格、主动、高效”的服务风格,在全球范围内承诺并履行着对客户专业的服务与指导。有一支服务国际的专业技术队伍,关注于对客户的工艺流程答疑,个性化方案解决;作好备品备件的匹配、网络沟通、上门检修排难等综合性专业而精深的服务工作,使产品服务体现个性化、全方位、长周期、少缺陷,从而赢得客户的信心、放心、诚心与开心! 价格优势:拥有市场同一产品中最具竞争力的价格,同时拥有相同甚至更佳的品质; 性能优势:均匀性好,一致性程度高,视角大,可实现单色单灯维修; 质量优势:材料到成品,研发到生产的全程可控性,成为产品质量可靠性的保证; 服务优势:同等条件下更加完善的服务,同样的服务,具备更加全面的合作。 2. 公司掠影: 办公区 SMT生产车间