A practical use of CFD for ventilation of underground works
- 格式:pdf
- 大小:1.90 MB
- 文档页数:12
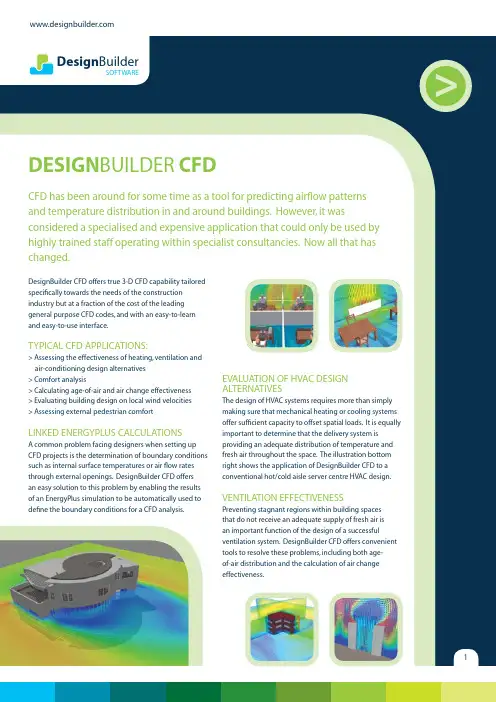
DESIGN BUILDER CFDCFD has been around for some time as a tool for predicting airflow patterns and temperature distribution in and around buildings. However, it was considered a specialised and expensive application that could only be used by highly trained staff operating within specialist consultancies. Now all that has changed.DesignBuilder CFD offers true 3-D CFD capability tailoredspecifically towards the needs of the constructionindustry but at a fraction of the cost of the leadinggeneral purpose CFD codes, and with an easy-to-learnand easy-to-use interface.TypICAL CFD AppLICATIONS:>Assessing the effectiveness of heating, ventilation andair-conditioning design alternatives>Comfort analysis>Calculating age-of-air and air change effectiveness>Evaluating building design on local wind velocities>Assessing external pedestrian comfortLINkED ENERgypLUS CALCULATIONSA common problem facing designers when setting up CFD projects is the determination of boundary conditions such as internal surface temperatures or air flow rates through external openings. DesignBuilder CFD offersan easy solution to this problem by enabling the results of an Energyplus simulation to be automatically used to define the boundary conditions for a CFD analysis. EvALUATION OF HvAC DESIgN ALTERNATIvESThe design of HvAC systems requires more than simply making sure that mechanical heating or cooling systems offer sufficient capacity to offset spatial loads. It is equally important to determine that the delivery system is providing an adequate distribution of temperature and fresh air throughout the space. The illustration bottom right shows the application of DesignBuilder CFD to a conventional hot/cold aisle server centre HvAC design.vENTILATION EFFECTIvENESSpreventing stagnant regions within building spacesthat do not receive an adequate supply of fresh air isan important function of the design of a successful ventilation system. DesignBuilder CFD offers convenient tools to resolve these problems, including both age-of-air distribution and the calculation of air change effectiveness.THERmAL COmFORTAn accurate assessment of occupancy thermal comfort is essential for successful building design. Comfort can vary considerably from one side of a room to another depending on factors such as the location of supply diffusers, radiators, computer equipment, etc. DesignBuilder CFD offers a number of tools for effective distributed comfort analysis including:> Fanger pmv and ppD > Operative temperature > mean radiant temperatureANALySIS OF WIND EFFECTvarious aspects of building design can have a significant effect on local wind velocity and in some cases can result in unacceptable levels of pedestrian comfort. External wind analysis can be conducted with DesignBuilder CFD, which uses ASHRAE wind profiles to determine wind velocities at different heights above ground.EASE OF USESetting up a CFD project is really straightforward with DesignBuilder CFD because it uses the same geometric model as other DesignBuilder applications such asEnergyplus. Features such as automatic grid generation further simplify the process.SpECTACULAR pRESENTATION TOOLSThe wide range of tools provided for the graphical display of results can be used to create powerful and impressive presentations. CFD results can also be displayed within rendered images of the building model.Display tools include:> 3D velocity vectors> Linear and filled contours > 3D contoursAvAILABILITyDesignBuilder software is available in English, Spanish, French, german and Italian language versions through an international distribution network.For more information visit ENQUIRIESSoftware or training enquiries should be directed to sales@ or +44 (0) 1453 755500DesignBuilder Software Ltdpalace Chambers, 41 London Rd, Stroud gloucestershire gL5 2AJ United kingdom。
THE 2007 SAMREC CODE FOR REPORTING OF EXPLORATION RESULTS, MINERAL RESOURCES AND MINERAL RESERVESGLOSSARY OF TERMSThe terms set out below shall, unless the context otherwise indicates, apply in relation to this Code._ _ _ _ _ _FOREWORD1. The SOUTH AFRICAN CODE FOR THE REPORTING OF EXPLORATION RESULTS,MINERAL RESOURCES AND MINERAL RESERVES (the SAMREC Code or the Code) sets out minimum standards, recommendations and guidelines for Public Reporting of Exploration Results, Mineral Resources and Mineral Reserves in South Africa. It has been drawn up by the Working Group of the SSC Committee under the joint auspices of the Southern African Institute of Mining and Metallurgy (SAIMM) and the Geological Society of South Africa (GSSA). The SSC consists of representatives of the SAIMM, the GSSA, the South African Council for Natural Scientific Professions (SACNASP), the Geostatistical Association of South Africa (GASA), the South African Council for Professional Land Surveyors and Technical Surveyors (PLATO), the Association of Law Societies of South Africa, the General Council of the Bar of South Africa, the Department of Minerals and Energy (DME), the JSE Limited (JSE), the Council for Geoscience, _ _ _ _ _ _the South African Council of Banks, the Minerals Bureau, the Chamber of Mines of South Africa (COM), and the University of the Witwatersrand.The first version of the SAMREC Code was issued in March 2000 and adopted by the JSE in their Listings Requirements later that same year. The Code has been adopted by the SAIMM, the GSSA, SACNASP, ESSA and PLATO, and is binding on members of these organisations.For background information and the history of the development of the Code please refer to the SAMREC Code, March 2000. This 2007 edition supersedes the first edition.Concurrently with the evolution of the SAMREC Code, the Committee for Mineral Reserves International Reporting Standards (CRIRSCO), initially a committee of the Council of Mining and Metallurgical Institutions (CMMI), has, since 1994, been working to create a set of standard international definitions for the reporting of Mineral Resources and Mineral Reserves.As a result of the CRIRSCO/CMMI initiative, considerable progress has been made towards widespread adoption of globally consistent reporting standards. These are embodied in similar Codes, guidelines and standards published and adopted by the relevant professional bodies around the world.The definitions in this edition of the SAMREC Code are either identical to, or not materially different from, those existing international definitions.INTRODUCTION2. The Code is applicable to the reporting of all styles of solid mineralisation or economic deposit.Certain commodities, namely Coal and Diamonds, have specific additional reporting requirements and these are dealt with from Clause 41 onwards. The Code does not apply to Oil, Gas or Water.In this second edition of the SAMREC Code, the Code is predominantly presented in normal typeface. Definitions are highlighted in bold text, and also form part of the Code. Guidelines are in italics and are placed after the respective Code clauses to provide assistance and guidance to readers when interpreting the Code.The SSC recognises that further reviews and revisions of the Code may be required. Additional information, rules, lists and best practice guidelines will be published on the SAMREC website from time to time, after due process has been followed.SCOPE3. The Code sets out a required minimum standard for the Public Reporting of Exploration Results,Mineral Resources and Mineral Reserves. References in the Code to Public Report or Public Reporting pertains to those reports detailing Exploration Results, Mineral Resources and Mineral Reserves prepared for the purpose of informing investors or potential investors and their advisers.Although the Code is a required minimum standard for Public Reporting, the SSC committee recommends its adoption as a minimum standard for other reporting.Public Reports are all reports prepared for the purpose of informing investors or potential investors and their advisers and include but are not limited to: company annual reports,quarterly reports and other reports included in JSE circulars, or as required by the Companies Act. The Code also applies to the following reports if they have been prepared for the purposes described in Clause 3: environmental statements; information memoranda; expert reports; technical papers; website postings; and public presentations.For companies issuing annual reports, or other summary reports, the inclusion of allmaterial information relating to Exploration Results, Mineral Resources and MineralReserves is recommended. In cases where summary information is presented it shouldbe clearly stated that it is a summary, with a reference attached giving the location of theCode-compliant Public Reports or Public Reporting on which the summary is based.Companies and other entities are encouraged to provide information, which is ascomprehensive as possible, in their Public Reports.It is recognised that companies may be required to issue reports for more than oneregulatory jurisdiction, with differing compliance standards as contained in this Code. It isrecommended that such reports include a statement alerting the reader to this.Reference in the Code to …documentati on‟pertains to internal company documentsprepared as a basis for, or in support of, a Public Report.It is recognised that situations may arise where such supporting documentation,prepared by Competent Persons for internal company or similar non-public purposes,may not specifically be compliant with the Code. In such situations, it is recommendedthat the documentation includes a prominent statement to this effect.Users of the Code, and those compiling reports which comply with the Code, should beguided by its intent, which is to provide a minimum standard for Public Reporting, and toensure that such reporting contains all relevant information which investors and theirprofessional advisers would expect to find in the report, for the purpose of making areasoned and balanced judgement regarding the Exploration Results, Mineral Resourcesand Mineral Reserves being reported on.4. The Code takes into account issues of a global nature whilst addressing certain circumstancesunique to South Africa. The following principles should be considered in the application of the Code:Materiality: A Public Report contains all the relevant information which investors and their professional advisors would reasonably require, and expect to find, for the purpose of making a reasoned and balanced judgement regarding the Exploration Results, Mineral Resources and Mineral Reserves being reported on.Transparency: The reader of a Public Report must be provided with sufficient information, the presentation of which is clear and unambiguous, to understand the report and not be misled.Competency: The Public Report is based on work that is the responsibility of suitably qualified and experienced persons who are subject to an enforceable Professional Code of Ethics.The author of the Public Report should be satisfied that his work has not been undulyinfluenced by the organisation, company or person commissioning a report or any reportthat may be deemed a Public Report, that all assumptions are documented, and thatadequate disclosure is made of all material aspects that the informed reader mayrequire, to make a reasonable and balanced judgement thereof.5. The Code is applicable to all solid minerals for which Public Reporting of Exploration Results,Mineral Resources and Mineral Reserves is required. Minerals are defined as any substance occurring naturally in or on the earth, in or under water or in tailings or dumps, and having been formed by or subjected to a geological process and includes sand, stone, rock, gravel, clay, soil and any mineral occurring in stockpiles or in residue deposits, but excludes water, oil and gas.6. Table 1 provides a list of the main criteria which should be considered and reported upon, ifrelevant, when reporting on Exploration Results, Mineral Resources and Mineral Reserves.COMPETENCE AND RESPONSIBILITY7. Documentation detailing Exploration Results, Mineral Resources and Mineral Reserves fromwhich a Public Report is prepared, must be prepared by, or under the direction of, and signed bya Competent Person.8. A Public Report concerning a company’s Exploration Results, Mineral Resources and MineralReserves is the responsibility of the company acting through its Board of Directors. Any such report must be based on, and fairly reflect, the Exploration Results, Mineral Resources and Mineral Reserves report(s) and supporting documentation prepared by a Competent Person. A Public Report shall disclose the name of the Competent Person(s), his/her qualifications, professional affiliations and relevant experience. The Competent Person’s written approval is required for his contribution to the report.Where any specific documentation is referred to in a Public Report, the written approval of the author must be obtained as to the form, content and context in which that documentation is to be included in the Public Report.9. A ‘Competent Person’ is a person who is registered with SACNASP, ECSA or PLATO, or isa Member or Fellow of the SAIMM, the GSSA or a Recognised Overseas ProfessionalOrganisation (ROPO). A complete list of recognised organisations will be promulgated by the SSC from time to time. The Competent Person must comply with the provisions of the relevant promulgated Acts.10. A Competent Person must have a minimum of 5 (five) years experience relevant to the style ofmineralisation and type of deposit or class of deposit under consideration and to the activity which that person is undertaking. If the Competent Person is estimating or supervising the estimation of Mineral Resources, the relevant experience must be in the estimation, assessment and evaluation of Mineral Resources. If the Competent Person is estimating, or supervising the estimation of Mineral Reserves, the relevant experience must be in the estimation, assessment, evaluation and assessment of the economic extraction of Mineral Reserves. Persons being called upon to sign as a Competent Person must be clearly satisfied in their own minds that they are able to face their peers and demonstrate competence in the commodity, type of deposit and situation under consideration.The key qualifier in the definition of a Competent Person is the word …relevant‟.Determination of what constitutes relevant experience can be difficult and commonsense should be exercised. For example, in estimating vein gold mineralisation,experience in a high-nugget, vein-type mineralisation such as tin, uranium etc. willprobably be relevant, whereas experience in massive-type deposits may not be.Furthermore, a person, considered competent in evaluating and reporting on alluvial golddeposits, should have considerable experience in this type of mineralisation, because ofthe characteristics of gold in alluvial systems, the particle sizing of the host sediment,and the low grades being quantified. Experience with placer deposits containing mineralsother than gold may not necessarily provide relevant experience.The key word …relevant‟ could also mean that it is not always necessary for a person tohave five years experience in each and every type of deposit in order to act as aCompetent Person if that person has relevant experience in other deposit types. Forexample, a person with twenty years experience in Mineral Resource evaluation in avariety of metalliferous hard-rock deposit types may not require five years specificexperience in porphyry copper deposits in order to act as a Competent Person. Relevantexperience in the other deposit types would count towards the required experience inrelation to porphyry copper deposits.In addition to experience in the style of mineralisation, a Competent Person reportingMineral Resources should have sufficient knowledge of sampling and assayingtechniques relevant to the deposit under consideration and to be aware of problemswhich could affect the reliability of the data. Some appreciation of extraction andprocessing techniques applicable to that deposit type would also be important.It is important that the Lead Competent Person(s) accepting overall responsibility for aMineral Resource or Mineral Reserve report which has been prepared in whole or in partby others is satisfied that the work of the other contributors is acceptable and that theconstituent parts of the report have been signed off by such contributors.The Lead Competent Person undertaking Mineral Resource or Mineral Reservereporting should accept full responsibility for the report and should not treat theprocedure merely as a …rubber-stampi ng‟ exercise.Estimation of Mineral Resources may be a team effort (i.e. involving one person or ateam collecting the data and another person or team preparing the Mineral Resourceestimate). Estimation of Mineral Reserves is commonly a team effort involving a numberof technical disciplines. It is recommended that, where there is a clear division ofresponsibilities within a team, each person should accept responsibility for, his or herparticular contribution. For example, one person could accept responsibility for thecollection of Resource data, another for the Resource estimation process, another for themining study and the Lead Competent Person(s) acting as project leader(s) shouldaccept responsibility for the overall report.11. Complaints made in respect of the Public Report of a Competent Person will be dealt with underthe disciplinary procedures of SSC, or under the relevant ROPO agreement.REPORTING TERMINOLOGY12. Public Reports dealing with Exploration Results, Mineral Resources and Mineral Reserves mustuse one the terms Proved or Probable Mineral Reserves, Measured, Indicated and Inferred Mineral Resources and Exploration Results as set out in Figure 1.Figure 1 sets out the framework for classifying tonnage and grade estimates so as to reflect different levels of geoscientific confidence and different degrees of technical and economic evaluation. Mineral Resources can be estimated on the basis of geoscientific information withsome input from other relevant disciplines. Mineral Reserves, which are modified Indicated and Measured Mineral Resources (shown within the dashed outline in Figure 1), require consideration of the Modifying Factors affecting extraction.Measured Mineral Resources may convert to either Proved Mineral Reserves, or may convert to Probable Mineral Reserves if there are uncertainties associated with modifying factors which are taken into account in the conversion from Mineral Resources to Mineral Reserves. This relationship is demonstrated by the broken arrow in Figure 1. Although the trend of the broken arrow includes a vertical component, it does not, in this instance, imply a reduction in the level of geoscientific knowledge or confidence. In such a situation these modifying factors should be fully explained.The term ‘Modifying Factors’is defined to include mining, metallurgical, economic, marketing, legal, environmental, social and governmental considerations.Figure 1 Relationship between Exploration Results, Mineral Resourcesand Mineral ReservesREPORTING GENERAL13. Public Reporting concerning a company’s Exploration Results, Mineral Resources and MineralReserves must include a description of the style and nature of mineralisation.14. A company must disclose relevant information concerning the status and characteristics of amineral deposit which could materially influence the economic value of that deposit, and promptly report any material changes in its Exploration Results, Mineral Resources and Mineral Reserves.15. When reporting on commodity-specific requirements for Coal Resources and Coal Reserves, usemust be made of Clauses 41 to 53, which contain amendments and additions, and such will take precedence over all common clauses.16. When reporting on commodity-specific requirements for Diamond Resources and DiamondReserves, use must be made Clauses 54 to 62 which contain amendments and additions, and such will take precedence over all common clauses.17. Throughout the Code, where appropriate, ‘quality’ may be substituted for ‘grade’, ‘volum e’ maybe substituted for ‘tonnage’. In this Code any reference to the singular shall include a reference to the plural, where appropriate.REPORTING OF EXPLORATION RESULTS18. Exploration Results include data and information generated by exploration programmes that maybe of use to investors. The Exploration Results may or may not be part of a formal declaration of Mineral Resources or Mineral Reserves.19. In Public Reports, that part of Exploration Results’ data and information relating to mineralisationnot classified as a Mineral Resource or Mineral Reserve must be described as a deposit and must contain sufficient information to allow a considered and balanced judgement of the significance of the results. This must include all relevant exploration information, including the location of the deposit. Such reporting must not be presented so as to unreasonably imply that potentially economic mineralisation has been discovered.Reporting of selected information such as isolated assays, isolated drill holes, assays of panned concentrates or supergene enriched soils or surface samples, without placing them in perspective, is unacceptable.Where assay and analytical results are reported, this must be done using one of thefollowing methods, selected as the most appropriate by the Competent Person: by listingall results, along with sample intervals (or size, in the case of bulk samples), or byreporting weighted average grades of mineralised zones, indicating clearly how thegrades were calculated.Exploration information should include the interpretation of geological continuity,sampling results, locations etc. Table 1, at the end of this Code, is a checklist guidelinefor those preparing reports on Exploration Results, Mineral Resources and MineralReserves and should used as a reference. The checklist is not prescriptive and, asalways, relevance and materiality are overriding principles that determine whatinformation should be publicly reported.20. It is recognised that it is common practice for a company to comment on and discuss itsexploration in terms of target size and type. Any such information relating to exploration targets must not be expressed or misrepresented as an estimate of Mineral Resources or Mineral Reserves. The term Resource(s) or Reserves(s) must not be used in this context. Any statement referring to potential quantity and grade of the target must be expressed as ranges and must include a detailed explanation of the basis for the statement, and a proximate statement that the potential quantity and grade is conceptual in nature, that there has been insufficient exploration to define Mineral Resource and that it is uncertain if further exploration will result in the determination of a Mineral Resource.REPORTING OF MINERAL RESOURCES21. A ‘Mineral Resource’ is a concentration or occurrence of material of economic interest inor on the earth’s crust in such form, quality and quantity that there are reasonable and realistic prospects for eventual economic extraction. The location, quantity, grade, continuity and other geological characteristics of a Mineral Resource are known, or estimated from specific geological evidence, sampling and knowledge interpreted from an appropriately constrained and portrayed geological model. Mineral Resources are subdivided, and must be so reported, in order of increasing confidence in respect of geoscientific evidence, into Inferred, Indicated or Measured categories.A deposit is a concentration [or occurrence] of material of possible economic interest inor on the earth’s crust, that may include mineralised material that cannot be estimated with sufficient confidence to be classified in the Inferred category. Portions of a deposit that do not have reasonable and realistic prospects for eventual economic extraction are not included in a Mineral Resource.For each category of Mineral Resource the basis of classification must be disclosed (refer to Table 1).The term Mineral Resource covers in situ mineralisation as well as dumps or tailings,which have been identified and estimated through exploration/assessment and samplingfrom which Mineral Reserves may be derived by the application of modifying factors.Any material assumptions made in determining the …reasonable and realistic prospectsfor eventual economic extracti on‟ should be clearly stated in the Public Report.The term …reasonable and realistic prospects for eventual economic extracti on‟ implies ajudgement (albeit preliminary) by the Competent Person(s) in respect of technical andeconomic factors likely to influence the prospect of economic extraction, including theapproximate mining parameters. In other words, a Mineral Resource is not an inventoryof all mineralisation drilled or sampled, regardless of cut-off grades, likely miningdimensions, location or continuity. It is a realistic inventory of mineralisation which, at thetime of reporting and under assumed and justifiable technical and economic conditions,might become economically extractable.Portions of a mineral deposit that do not have reasonable and realistic prospects foreventual economic extraction must not be included in a Mineral Resource.Interpretation of the word …eventual‟in this context may vary depending on thecommodity, mineral involved or legal tenure. For example, for many coal, iron ore,bauxite and other bulk minerals or commodities, it may be reasonable to envisage…eventual economic extractio n‟ as covering time periods in excess of 50 years. Howeverfor other deposits, application of the concept would normally be restricted to perhaps 20to 30 years and frequently to much shorter periods of time.Certain reports (e.g. exploration reports to government and other similar reports notintended primarily for providing information for investment purposes) may require fulldisclosure of all mineralisation including some material that does not have reasonableand realistic prospects for eventual economic extraction. Estimates of these portions ofthe mineral deposit that do not qualify as Mineral Resources must not be described assuch.Any adjustment made to the data for the purpose of making the Mineral Resourceestimate, for example by cutting or factoring grades, or any other relevant assumptions,should be clearly stated and described in the Public Report.Where considered appropriate by the Competent Person(s) Mineral Resource estimatesmay include mineralisation below the selected cut-off grade to ensure that the MineralResource comprises bodies of mineralisation of adequate size and continuity to properlyconsider the most appropriate approach to mining, including any dilution orcontamination resulting from the requirements of any minimum mining width.Documentation of Mineral Resource estimates should clearly define any such inclusionsand Public Reports should include commentary on the matter if considered material.22. An ‘Inferred Mineral Resourc e’ is that part of a Mineral Resource for which volume and/ortonnage, grade and mineral content can be estimated with a low level of confidence. It is inferred from geological evidence and sampling and assumed but not verified geologically and/or through analysis of grade continuity. It is based on information gathered through appropriate techniques from locations such as outcrops, trenches, pits, workings and drill holes that may be limited in scope or of uncertain quality and reliability.An Inferred Mineral Resource has a lower level of confidence than that applying to an Indicated Mineral Resource.Where Inferred Mineral Resources are extrapolated beyond data points, the proportionextrapolated must be described and disclosed.This category is intended to cover situations where a mineral concentration oroccurrence has been identified and limited measurements and sampling completed, butwhere the data is insufficient to allow the geological and/or grade continuity to beconfidently interpreted. Due to the uncertainty which may be attached to some InferredMineral Resources, it cannot be assumed that all or part of an Inferred Mineral Resourcewill necessarily be upgraded to an Indicated or Measured Mineral Resource as a resultof continued exploration.23. It is accepted that mine design and mine planning may include a proportion of Inferred MineralResources. If this category is considered in mine design, planning and/or economic studies, the results of which are publicly reported, full disclosure and the effect on the results of the studies must be stated. Inferred Mineral Resources may only be included in mine design, mine planning, and/or economic studies provided that there exists a mine plan and a statement of Mineral Reserves, which states that Inferred Mineral Resources have been used. Where a materialamount of mining in the mine plan includes Inferred Mineral Resources. a comparison of the results with and without these Inferred Mineral Resources must be shown, and the rationale behind their inclusion must be explained.Modifying factors and assumptions that were applied to the Indicated and Measured Mineral Resources to determine the Mineral Reserves must be equally applied to the Inferred Mineral Resources.Inferred Mineral Resources cannot be converted to Mineral Reserves, and must not be stated as part of the Mineral Reserve.24. An ‘Indicated Mineral Resource’is that part of a Mineral Resource for which tonnage,densities, shape, physical characteristics, grade and mineral content can be estimated with a reasonable level of confidence. It is based on exploration, sampling and testing information gathered through appropriate techniques from locations such as outcrops, trenches, pits, workings and drill holes. The locations are too widely or inappropriately spaced to confirm geological and/or grade continuity but are spaced closely enough for continuity to be assumed.The Indicated Mineral Resource has sufficient confidence for mine design, mine planning, and/or economic studies.An Indicated Mineral Resource has a lower level of confidence than that applying to aMeasured Mineral Resource, but has a higher level of confidence than that applying toan Inferred Mineral Resource.Confidence in the estimate is sufficient to allow the appropriate application of technical and economic parameters and to enable an evaluation of economic viability.25. A ‘Measured Mineral Resource’ is that part of a Mineral Resource for which tonnage, densities,shape, physical characteristics, grade and mineral content can be estimated with a high level of confidence. It is based on detailed and reliable exploration, sampling and testing information gathered through appropriate techniques from locations such as outcrops, trenches, pits, workings and drill holes. The locations are spaced closely enough to confirm geological and grade continuity.A Measured Mineral Resource has sufficient confidence for mine design, mine planning,production planning, and/or detailed economic studies.A Measured Mineral Resource requires that the nature, quality, amount and distributionof data are such as to leave no reasonable doubt in the opinion of the CompetentPerson(s), that the tonnage and grade of the mineralisation can be estimated to withinclose limits and that any variation within these limits would not materially affect potentialeconomic viability.This category requires a high level of confidence in, and understanding of, the geologyand the controls on mineralisation.26. The Competent Person(s) responsible for the Resource estimate must determine the appropriateMineral Resource category based upon the quantity, distribution and quality of data available and the level of confidence attached to the data with reference to Table 1. The method of determining these confidence levels must be disclosed. Resource classification guidelines are included in Table 1.。
架空层地面构造做法The construction of fictional underground structures involves a multitude of considerations and approaches. From the architectural design to the engineering techniques employed, every aspect must be meticulously planned and executed to ensure the safety, functionality, and aesthetic appeal of the structure. In this discussion, we will explore the various aspects of constructing a fictional underground layer, taking into account the structural design, materials used, ventilation systems, lighting, and accessibility.One of the key considerations in constructing afictional underground layer is the structural design. The design should take into account the purpose of the layer, whether it is a residential area, a research facility, or a secret hideout. The layout should be carefully planned to optimize the use of space and facilitate efficient movement within the layer. Additionally, the design should incorporate safety features such as reinforced walls,emergency exits, and fire suppression systems.When it comes to materials, the choice should be based on factors such as strength, durability, and resistance to environmental factors. Reinforced concrete is commonly used due to its strength and ability to withstand pressure. However, other materials such as steel, glass, and composite materials can also be employed depending on the specific requirements of the layer. It is important to strike a balance between functionality and aesthetics to create an inviting and visually appealing environment.Ventilation is another crucial aspect of constructing a fictional underground layer. Proper ventilation ensures a constant supply of fresh air, removes pollutants, and regulates temperature and humidity levels. Mechanical ventilation systems, such as air conditioning and air filtration units, can be installed to maintain a comfortable and healthy environment. Natural ventilation methods, such as the use of skylights and air shafts, can also be incorporated to reduce reliance on artificial systems.Lighting is essential to create a welcoming and functional underground space. Natural light can be introduced through the use of light wells, skylights, or reflective surfaces. Artificial lighting systems, such as LED lights, can be strategically placed to provide adequate illumination while minimizing energy consumption. Lighting fixtures should be chosen to complement the overall design aesthetic and enhance the ambiance of the space.Accessibility is a critical factor in designing an underground layer. Entrances and exits should be easily accessible and well-marked to ensure smooth movement in and out of the layer. Elevators, ramps, and staircases should be designed to accommodate individuals with disabilities and facilitate the transportation of heavy equipment or materials. Additionally, the layer should be equipped with appropriate security measures, such as surveillance cameras and access control systems, to ensure the safety and privacy of its occupants.In conclusion, constructing a fictional undergroundlayer requires careful consideration of various factors, including structural design, materials, ventilation systems, lighting, and accessibility. The design should optimize the use of space, incorporate safety features, and strike a balance between functionality and aesthetics. The choice of materials should be based on strength, durability, and resistance to environmental factors. Ventilation systems should ensure a constant supply of fresh air and regulate temperature and humidity levels. Lighting should becarefully planned to create a welcoming and functional environment. Lastly, accessibility should be prioritized to facilitate smooth movement and ensure the safety andcomfort of the layer's occupants.。
高大空间展览温室自然通风CFD模型构建彭淑英; 缪智昕【期刊名称】《《制冷与空调(四川)》》【年(卷),期】2019(033)005【总页数】8页(P542-549)【关键词】展览温室; 自然通风; 数值模拟; 多孔介质【作者】彭淑英; 缪智昕【作者单位】上海勘测设计研究院有限公司上海 200434【正文语种】中文【中图分类】TU831CFD是解析建筑环境工学中的各种问题和环境设计的强有力的工具[1]。
近几年CFD技术在设施园艺领域的应用主要集中在温室微气候模拟方面。
它以流体质量、动量和能量三大守恒方程为数值计算的理论依据,结合流体湍流模型对温室内气流模式和温湿度、浓度等因子的空间分布进行二维或三维模拟和预测,并将结果可视化;可以灵活地设定模拟因素的可变及不变;对一些可变因素,如外界气候条件,温室类型及尺寸等,可以任意进行变换。
其它的研究方法需要完美的试验设计,精密的仪器及准确的测量才能得到可信的结果,CFD方法则能节省时间、劳动力及花费[2]。
自然通风是利用温室内外温差与风力作用造成室内外空气压差,而进行室内外空气交换以排除室内余热余湿以及提供植物生长所需的二氧化碳的技术措施。
这种通风方式基本上不消耗或很少消耗动力能源。
尽管利用自然通风改善建筑热湿环境多年来得到了广泛应用,但如何通过合理设计进出风口的位置、面积来改善高大空间热湿环境等方面仍存在许多问题有待于进一步研究,而CFD方法是解决这一问题的有效方法,利用CFD方法可以预测高大空间的温湿度场从而进一步优化改善其热湿环境。
本文拟采用CFD方法数值模拟某高大空间展览温室自然通风的温湿度场,并采集了现场测试数据对仿真结果进行了验证。
该展览温室为江苏省连云港蔷薇湖生态保护区展览温室,位于东经118.24°,北纬33.59°。
温室有3个圆形组成,总面积为5225.6m2。
温室左侧圆顶地面半径为30m,高22m;中间圆顶地面半径为20m,高16m;右侧圆顶地面半径为22m,高19m;中间圆顶地面圆心与左侧圆顶地面圆心相距37.992m,两圆心连线与正南方向夹角为25.18°,右侧圆顶地面圆心与中间圆顶地面圆心相距34.61m,与正南方向夹角为87.97°。
井下煤仓日常巡查制度及流程英文版Routine Inspection System and Process for Underground Coal BunkersIntroductionThe safety of underground coal bunkers is paramount in ensuring the smooth operation of mining activities. Regular inspections are crucial to identify potential hazards, ensure compliance with safety standards, and mitigate risks. This article outlines the routine inspection system and process for underground coal bunkers.Routine Inspection SystemInspection Frequency: Underground coal bunkers should be inspected at least once daily, with additional inspections conducted during periods of high activity or inclement weather.Inspection Team: The inspection team should consist of experienced mine inspectors, safety personnel, and technicalexperts. They should be familiar with the latest safety standards and procedures.Inspection Checklist: A comprehensive checklist should be used to ensure that all critical areas and components are inspected. This checklist should cover structural integrity, ventilation systems, fire safety measures, and any other relevant safety aspects.Inspection ProcessPre-Inspection Preparation: Before commencing the inspection, the team should gather all necessary equipment, including torches, gas detectors, and communication devices. They should also review the latest safety procedures and guidelines.Visual Inspection: The team should conduct a thorough visual inspection of the bunkers, noting any visible damage, leaks, or other irregularities. This includes checking for cracks, bulging, or any other structural deformities.Equipment Inspection: All safety equipment, such as fire extinguishers, ventilation systems, and gas detectors, should be inspected to ensure they are in good working condition.Reporting and Follow-Up: Any issues or hazards identified during the inspection should be immediately reported to the mine management. Follow-up measures should be taken to address these issues promptly, ensuring the safety of personnel and operations.ConclusionThe routine inspection system and process for underground coal bunkers are critical in maintaining the safety of mining operations. By adhering to a strict inspection schedule, using a comprehensive checklist, and ensuring the prompt reporting and resolution of issues, mines can significantly reduce the risks associated with underground coal bunkers.中文版井下煤仓日常巡查制度及流程引言井下煤仓的安全对于确保采矿活动的顺畅进行至关重要。
会建造住所的动物英文版Animals That Construct DwellingsIn the animal kingdom, there are various species that exhibit remarkable abilities to construct their own dwellings. These structures serve as homes, nests, or shelters, providing protection and security for animals and their offspring. This article will explore some of the fascinating creatures that possess the skills to build their own habitats.1. BeaverBeavers are renowned for their impressive engineering skills. Using their strong jaws and sharp teeth, they fell trees and manipulate branches to construct intricate dams. These dams create deep ponds that serve as the beavers' homes. The ponds also serve as protection against predators, while the beavers' lodges provide a dry and safe living space.2. WeaverbirdWeaverbirds are small but mighty when it comes to constructing nests. They use grass, leaves, and even thin strips of bark to weave intricate and elaborate nests. These nests are often suspended from tree branches, providing protection from predators. The male weaverbirds take pride in their nest-building, as the quality and complexity of their nests play a crucial role in attracting potential mates.3. TermiteTermites are famous for their ability to construct elaborate mounds. These mounds can vary in size, ranging from small nests to toweringstructures reaching several meters in height. Made from a mixture of soil, saliva, and termite excrement, these mounds provide excellent ventilation and structural stability. The intricate network of tunnels within the mound allows termites to navigate and maintain a controlled environment.4. AntAnts are highly organized insects that construct complex underground colonies. These colonies serve as both dwellings and social structures for the ant community. The tunnels and chambers are constructed using a combination of soil, pebbles, and organic matter. The chambers within the colony serve various purposes, such as nurseries for larvae, storage for food, and even designated areas for waste disposal.5. Orb-weaver SpiderOrb-weaver spiders are known for their spectacular and intricately woven webs. These silken structures are crafted by the spiders to serve as traps for unsuspecting prey. The patterns and designs of the webs vary between species and are often constructed in locations that maximize the chances of capturing insects. The complexity of these webs is a testament to the spiders' ability to produce silk and their remarkable spatial awareness.6. BowerbirdBowerbirds are renowned for their unique ability to construct elaborate structures known as "bowers." These bowers are built using twigs, leaves, and other natural materials, carefully arranged to create visually appealing displays. Male bowerbirds construct these bowers as part of their courtshipbehavior, aiming to attract females through their impressive construction skills.7. CaddisflyCaddisflies are insects that construct protective cases to shield themselves from predators and harsh environmental conditions. The larvae of these insects use silk and natural debris, such as twigs, pebbles, and sand, to create these cases. Each species of caddisfly designs its case differently, utilizing various materials to ensure camouflage and protection.In conclusion, the animal kingdom is filled with incredible creatures capable of constructing their own dwellings. From beavers' dams to weaverbirds' nests, the ability to build habitats showcases the resourcefulness and adaptability of these animals. Such construction not only serves as protection but also plays a crucial role in their survival and reproduction.。

第1篇The construction of residential housing projects is a vital component of urban development, providing much-needed accommodation for growing populations. This article outlines the key aspects of a typical residential housing construction project, focusing on the planning, execution, and completion stages.Project PlanningThe planning phase of a residential housing project is crucial for its success. It involves several critical steps:1. Site Selection: The first step is to identify a suitable location for the project. Factors such as accessibility, proximity to amenities, and environmental considerations are taken into account.2. Feasibility Study: A feasibility study is conducted to assess the project's viability. This includes analyzing market demand, economic feasibility, and potential risks.3. Design and Engineering: The architectural design and engineering plans are developed, ensuring compliance with local building codes and regulations. This stage involves collaboration between architects, engineers, and other professionals.4. Budgeting and Financing: A detailed budget is prepared, outlining the costs of construction, materials, labor, and other expenses. Financing options are explored, including loans, grants, or private investments.5. Regulatory Approvals: All necessary permits and approvals from local authorities are obtained, including zoning variances, environmental impact assessments, and building permits.Project ExecutionOnce the planning phase is complete, the project moves into the execution phase, which includes the following steps:1. Site Preparation: The construction site is cleared, and any necessary infrastructure, such as roads and utilities, is installed.2. Foundations: The foundations are laid, providing a stable base forthe structure. This involves excavation, grading, and the installationof reinforcing steel and concrete.3. Superstructure: The superstructure, including walls, floors, and roofs, is constructed. This phase involves the use of various construction materials, such as brick, concrete, and steel.4. Interior and Exterior Finishing: The interior and exterior walls are finished, including the application of paint, tiles, and otherdecorative elements. Windows, doors, and fixtures are installed.5. Mechanical, Electrical, and Plumbing (MEP): The MEP systems are installed, including heating, ventilation, and air conditioning (HVAC), electrical wiring, and plumbing.6. Quality Control: Throughout the construction process, quality control measures are implemented to ensure that the project meets the required standards and specifications.Project CompletionThe completion phase of a residential housing project involves the following steps:1. Final Inspections: All aspects of the project are inspected to ensure compliance with building codes and regulations. This includes electrical, plumbing, and structural inspections.2. Handover: Once the project is deemed complete, it is handed over to the client or developer. This includes the transfer of ownership and the provision of all necessary documentation.3. Maintenance and Warranty: The construction team provides maintenance services and warranties for a specified period to address any issuesthat may arise after the handover.4. Occupancy: The residents move into their new homes, and the projectis considered successful if it meets the expectations of the stakeholders.ConclusionThe construction of residential housing projects is a complex and multifaceted process that requires careful planning, execution, and management. By adhering to strict quality standards and regulatory requirements, developers and construction teams can ensure the successful completion of these projects, contributing to the growth and development of urban areas.第2篇The housing construction project is a crucial component of urban development, aiming to provide affordable and quality housing for the growing population. This article provides a comprehensive overview of the housing construction process, highlighting the key stages, challenges, and considerations involved in the project.1. Planning and Design PhaseThe first stage of any housing construction project is the planning and design phase. This involves:- Site Selection: Identifying a suitable location for the project, considering factors such as accessibility, proximity to amenities, and environmental impact.- Urban Design: Creating a layout that maximizes space utilization, ensures proper ventilation, and enhances the aesthetic appeal of the area.- Architectural Design: Developing detailed architectural plans that include floor plans, elevations, and structural designs.- Regulatory Compliance: Ensuring that the project adheres to local building codes, zoning laws, and environmental regulations.2. Site PreparationOnce the design phase is complete, the site preparation begins:- Demolition: If the site is occupied by existing structures, these must be demolished safely and responsibly.- Soil Excavation: Excavating the soil to create the foundation for the buildings.- Utilities Installation: Laying the necessary infrastructure for water supply, electricity, and drainage systems.3. Foundation and StructureThe foundation and structure are the backbone of any housing project:- Foundation Construction: Laying the foundation, which could be shallow or deep, depending on the soil conditions and design requirements.- Frame Construction: Erecting the frame using materials such as concrete, steel, or wood, ensuring structural integrity and stability.- Interior and Exterior Walls: Building the interior and exterior walls, which could be load-bearing or non-load-bearing, depending on the design.4. Electrical, Plumbing, and HVAC SystemsThe installation of essential services is a critical part of the construction process:- Electrical Systems: Installing electrical wiring, outlets, switches, and lighting fixtures.- Plumbing Systems: Setting up water supply and drainage systems, including taps, toilets, and sinks.- HVAC Systems: Installing heating, ventilation, and air conditioning systems to ensure a comfortable indoor environment.5. Interior FinishingThe interior finishing phase involves:- Painting and Wall Covering: Applying paint or wall coverings to enhance the aesthetic appeal of the interiors.- Flooring: Installing tiles, carpets, or wooden flooring.- Cabinetry and Fixtures: Installing kitchen cabinets, bathroom fixtures, and other fittings.6. Landscape and InfrastructureThe final touches include:- Landscape Design: Creating a visually appealing landscape around the housing complex, including gardens, walkways, and recreational areas.- Infrastructure: Ensuring the completion of all necessary infrastructure, such as street lighting, signage, and parking facilities.7. Quality Control and SafetyThroughout the construction process, quality control and safety are paramount:- Regular Inspections: Conducting regular inspections to ensure compliance with building codes and standards.- Safety Measures: Implementing safety protocols to protect workers and prevent accidents on the construction site.8. Project Completion and HandoverOnce all construction work is completed, the housing project is handed over to the client or homeowner:- Final Inspections: Conducting final inspections to ensure that the project meets all requirements.- Handover Documentation: Providing all necessary documentation,including warranties and maintenance guidelines.The housing construction project is a complex and multifaceted endeavor that requires careful planning, coordination, and execution. Byfollowing these stages and addressing the various challenges, developers can ensure the successful completion of a project that contributes tothe overall well-being of the community.第3篇In recent years, the demand for housing has been on the rise, driven by the growing population and the increasing affordability of mortgages. As a result, the construction industry has been bustling with activity, particularly in the field of residential buildings. This essay provides a comprehensive overview of a typical housing construction project, highlighting the key stages, challenges, and benefits involved.1. Planning and DesignThe first and most crucial stage of any housing construction project is the planning and design phase. This stage involves several key activities:- Site Selection: The location of the housing project is paramount. Factors such as accessibility, proximity to amenities, and environmental considerations are taken into account.- Architectural Design: The architectural team designs the building, including the layout, floor plans, and exterior aesthetics.- Structural Engineering: Structural engineers ensure that the building is safe and can withstand various environmental conditions.- Local Regulations: Compliance with local building codes and regulations is essential to ensure the project's legality.2. Land Acquisition and PreparationOnce the design is finalized and approved, the next step is to acquire the land. This may involve purchasing the land or leasing it from the government. After acquiring the land, the following activities are carried out:- Site Clearing: Trees, debris, and other obstacles are removed to prepare the site for construction.- Excavation and Foundation Work: Excavation for footings and foundations is done, and the necessary underground utilities are installed.3. ConstructionThe actual construction phase involves the following key activities:- Framing: The framework of the building, including walls, floors, and roofs, is constructed.- Mechanical, Electrical, and Plumbing (MEP): Installation of heating, ventilation, air conditioning, electrical, and plumbing systems.- Finishing Work: Completion of interior and exterior finishing, including painting, flooring, and fixture installation.- Quality Control: Regular inspections and quality checks are conducted to ensure the building meets the required standards.4. ChallengesHousing construction projects face several challenges, including:- Weather Conditions: Adverse weather can delay construction and increase costs.- Resource Availability: The availability of skilled labor, construction materials, and equipment can impact the project timeline.- Regulatory Compliance: Navigating through various local and national regulations can be time-consuming and costly.- Budget Constraints: Unforeseen expenses can lead to budget overruns.5. BenefitsDespite the challenges, housing construction projects offer numerous benefits:- Economic Growth: Construction projects create jobs and stimulate economic activity.- Affordable Housing: Increasing the supply of affordable housing can improve the living conditions of low-income families.- Infrastructure Development: Housing projects often lead to the development of local infrastructure, such as roads, schools, and healthcare facilities.ConclusionHousing construction projects are complex and multifaceted endeavorsthat require careful planning, coordination, and execution. By overcoming the challenges and leveraging the benefits, these projects can contribute significantly to the economic and social well-being of a community. As the demand for housing continues to grow, the construction industry must adapt and innovate to meet the evolving needs of society.。
"Underground Garages: InternationalPerspectives"1. Design InnovationsUnderground garages in countries like the United States and Canada are pushing the boundaries of design. These facilities often incorporate green building principles, with features like natural lighting, ventilation systems, and even rooftop gardens that blend seamlessly with the urban environment.2. Space UtilizationIn densely populated cities like London and Tokyo, underground garages are marvels of space utilization. These cities have mastered the art of maximizing limited space, creating multilevel parking structures that stretch deep beneath the surface.3. Security and SafetyEuropean countries, such as Germany and France, place a strong emphasis on security and safety in their underground garages. Stateoftheart surveillance systems, welllit areas, and clear signage are standard features, ensuring thatdrivers and their vehicles are wellprotected.4. Automated Parking Systems5. Environmental Considerations6. Community Integration"Underground Garages: International Perspectives" (Continued)7. Urban Planning Strategiescities such as Amsterdam and Copenhagen have integrated underground garages into their urban planning strategies to maintain the historic beauty of their city centers. These garages are often constructed beneath public squares or parks, preserving the integrity of the city's surface landscape while providing muchneeded parking spaces.8. Accessibility and InclusivityIn the United Kingdom, underground garages are designed with accessibility in mind. They feature wide parking bays, clear signage, and elevators that cater to all users, including those with disabilities. This focus on inclusivity ensures that these facilities are usable everyone.9. Disaster ResilienceIn earthquakeprone regions like California and Japan, underground garages are built to withstand natural disasters. They incorporate flexible designs and materials that can absorb seismic activity, protecting both the structure itself and the vehicles within.10. Economic ViabilityIn major financial hubs like New York and Dubai, the economic viability of underground garages is a critical factor. These cities have seen the value in premium parking spaces, with some underground garages offering luxury amenities and valet services to attract highend users.11. Historical PreservationIn cities with rich histories like Rome and Athens, underground garages are often designed to coexist with archaeological sites. Constructors take great care to preserve the historical remains discovered during excavation, sometimes incorporating these finds into the garage's design.12. Public Transportation IntegrationIn cities like Montreal and Moscow, underground garages serve as extensions of the public transportation network. They are designed with direct connections to subway stations and bus terminals, encouraging the use of public transit and reducing overall traffic congestion.13. Energy Efficiency14. Community EngagementThe global approach to underground garages is a dynamic and evolving field, reflecting the diverse needs and innovative solutions of cities around the world. As urbanization continues, the lessons learned from theseinternational perspectives will inform and inspire the design of future underground parking solutions."Underground Garages: International Perspectives" (Continued)15. Smart Technology Integration16. Aesthetics and ArtCities like Paris and Barcelona are known for their appreciation of art and design, and this extends to their underground garages. These facilities often feature artistic installations, murals, or unique architectural elements that transform the utilitarian space into something visually appealing.17. Water ManagementIn cities prone to flooding, like Mumbai and Jakarta, underground garages are designed with sophisticated water management systems. These systems include drainage, pumping stations, and sometimes even flood barriers to protect the garage and its contents from unexpected water levels.18. Air Quality ControlIn London and Beijing, where air quality is a significant concern, underground garages are equipped withair filtration systems. These systems help to maintain clean air within the garage, reducing the amount of pollution that drivers and their vehicles are exposed to.19. Noise ReductionIn cities like Zurich and Sydney, where the quality of life is highly valued, underground garages are designed with noise reduction in mind. Soundabsorbing materials and careful engineering help to minimize the noise that vehicles generate, contributing to a quieter urban environment.20. Bicycle ParkingIn cyclingfriendly cities like Copenhagen and Amsterdam, underground garages often include dedicatedbicycle parking areas. These sections provide secure and convenient storage for bikes, encouraging more people to choose cycling as a mode of transportation.21. Emergency Preparedness22. Green Spaces and Urban AgricultureSome cities, like Chicago and Singapore, are experimenting with integrating green spaces and urban agriculture into underground garages. Rooftop gardens and vertical green walls not only beautify the space but also contribute to urban sustainability.23. Heritage InterpretationIn cities with a rich cultural heritage, such as Istanbul and Mexico City, underground garages are sometimes designed to include interpretive centers. These centersshowcase the historical significance of the site, offering a unique educational experience for visitors.The international approach to underground garages is a testament to the multifaceted nature of urban development. As cities continue to grow and evolve, the design and function of these subterranean spaces will play an increasingly important role in shaping the urban experience for residents and visitors alike.。
关于无梁楼盖地下室顶板消防车等效荷载的探讨摘要:随着社会的发展,充分利用地下空间,越来越多的车库都采用无梁楼盖结构。
无梁楼盖结构由于通风、采光效果好,而且还能大大降低层高,减少开挖,节约建设的费用,因而被广泛采用。
为达到设计更为经济、合理的目的,本人针对无梁楼盖地下室顶板上消防车活荷载的取值进行了探讨。
通过对消防车队的车轮作用方式,建立起合理的计算模型,按照荷载最不利布置原则布置消防车荷载,计算折减后的等效均布荷载值,并给出合理的设计取值。
关键词:无梁楼盖;地下室顶板;消防车活荷载;覆土层;折减Abstract: with the development of the society, make full use of underground space, more and more of the garage USES flat slab floor structure. Flat slab floor structure because of ventilation, lighting effect is good, and still can greatly reduce the layer are tall, reduce the excavation, save the cost of building, they have been widely adopted. To achieve the design more economic and reasonable goal, I for flat slab floor on the roof of the basement of fire live load value is discussed. Through to the fire of the wheels of the team function way, establish the reasonable calculation model, according to the most unfavorable load arrangement principle decorate fire truck loads, reduction of the equivalent calculation after uniformly distributed load value, and give reasonable design value.Keywords: flat slab floor; The basement roof; Fire engines live load; Overlaying soil; reduction目前大部分住宅小区及高层建筑中,都会设置1~3层的地下室用于车库使用。
介绍地铁的声音英语作文Title: The Symphony of the Subway: Exploring the Soundscape of Underground Transit。
The subway, a bustling underground network of trains, stations, and passengers, presents a cacophony of sounds that weave together to form a unique urban symphony. From the screech of brakes to the rumble of engines, thesubway's auditory landscape is a reflection of the dynamic life above ground. Let's delve into the soundscape of the subway and explore its significance in the urban environment.First and foremost, the rhythmic chug of the subway train as it glides along the tracks is perhaps the most iconic sound of underground transit. The steady beat of the wheels against the rails creates a comforting and hypnotic rhythm that lulls passengers into a state of relaxation or contemplation amidst the chaos of city life. It's a sound that signifies movement, progress, and the constant flow ofpeople and ideas within the urban landscape.Accompanying the train's rhythmic melody are the announcements echoing through the station speakers. Whether it's the robotic voice announcing the next stop or the crackling intercom updates from the conductor, these announcements serve as auditory signposts guiding passengers through the labyrinthine network of tunnels and platforms. They provide vital information, ensuring passengers stay informed and connected to their journey.As the train approaches a station, the high-pitched squeal of brakes pierces through the ambient noise, signaling the impending arrival. This sharp, metallic sound is a testament to the subway's mechanical complexity, reminding us of the intricate engineering required to keep this vast transportation system running smoothly. While it may be jarring to some, for seasoned commuters, it's simply another note in the symphony of the subway.Inside the bustling stations, the soundscape transforms yet again. The hustle and bustle of passengers shufflingthrough turnstiles, the metallic clang of gates closing, and the distant murmur of conversations blend together to create a vibrant urban symphony. Each sound, whether it's the scuffle of footsteps or the swish of departing train doors, adds to the rich tapestry of urban life unfolding underground.But amidst the chaos, there are moments of unexpected harmony. Musicians busking on station platforms fill theair with the sweet strains of music, adding a touch of culture and creativity to the subway experience. From the plaintive wail of a saxophone to the rhythmic tapping of drumsticks on buckets, these impromptu performances inject a sense of joy and spontaneity into the daily commute.Beyond the sounds of human activity, the subway is also home to a symphony of ambient noise. The low hum of ventilation systems, the distant rumble of passing trains, and the occasional drip of water echoing through the tunnels create a backdrop of urban ambiance that is both eerie and mesmerizing. It's a reminder that even in the depths of the earth, life and movement persist.In conclusion, the subway's soundscape is a symphony of urban life, a tapestry of noise that reflects the vitality and diversity of the city above. From the rhythmic chug of trains to the cacophony of station activity, each sound plays a vital role in shaping the subway experience. So the next time you descend into the depths of the underground, take a moment to listen to the symphony of the subway and appreciate the rich tapestry of sounds that surround you.。
地面停车位和地下停车位修正标准Parking is a common issue in cities around the world. With the increasing number of vehicles on the road, finding a parking spot has become a daunting task for many drivers. In densely populated areas, parking spaces are limited, leading to overcrowding and competition for available spots. This has led to the development of both ground-level and underground parking facilities to accommodate the growing demand for parking.停车是全球各个城市普遍存在的问题。
随着路上车辆数量的增加,为车辆找到一个停车位对许多司机来说变得非常困难。
在人口密集的地区,停车位有限,导致停车场拥挤并对可用车位进行争夺。
这已经促使了地面和地下停车设施的发展,以满足日益增长的停车需求。
Ground-level parking spaces are a convenient option for drivers due to their accessibility and ease of use. These parking facilities are typically located in open areas, providing drivers with quick and easy access to their vehicles. Ground-level parking lots are often equipped with lighting and security measures to ensure the safety of both vehicles and their owners. Additionally, ground-level parking is cost-effective to build and maintain compared to underground parking facilities, making them an attractive option for many businesses and property owners.地面停车位是司机们的一个方便选择,因为它们具有易达性和易用性。
外文原文:Roadheader applications in mining and tunneling industriesH. Copur1, L. Ozdemir2, and J. Rostami31Graduate Student, 2 Director and Professor, and 3 Assistant ProfessorEarth Mechanics Institute, Colorado School of Mines, Golden, Colorado, 80401 ABSTRACTRoadheaders offer a unique capability and flexibility for the excavation of soft to medium strength rock formations, therefore, are widely used in underground mining and tunneling operations. A critical issue in successful roadheader application is the ability to develop accurate and reliable estimates of machine production capacity and the associated bit costs. This paper presents and discusses the recent work completed at the Earth Mechanics Institute of Colorado School of Mines on the use of historical data for use as a performance predictor model. The model is based on extensive field data collected from different roadheader operations in a wide variety of geologic formations. The paper also discusses the development of this database and the resultant empirical performance prediction equations derived to estimate roadheader cutting rates and bit consumption.INTRODUCTIONThe more widespread use of the mechanical excavation systems is a trend set by increasing pressure on the mining and civil construction industries to move away from the conventional drill and blast methods to improve productivity and reduce costs. The additional benefits of mechanical mining include significantly improved safety, reduced ground support requirements and fewer personnel. These advantages coupled with recent enhancements in machine performance and reliability have resulted in mechanical miners taking a larger share of the rock excavation market.Roadheaders are the most widely used underground partial-face excavation machines for soft to medium strength rocks, particularly for sedimentary rocks. They are used for both development and production in soft rock mining industry (i.e. main haulage drifts, roadways, cross-cuts, etc.) particularly in coal, industrial minerals and evaporitic rocks. In civil construction, they find extensive use for excavation of tunnels (railway, roadway, sewer, diversion tunnels, etc.) in soft ground conditions, as well as for enlargement and rehabilitation of various underground structures. Their ability to excavate almost any profile opening also makes them very attractive to those mining and civil construction projects where various opening sizes and profiles need to be constructed.In addition to their high mobility and versatility, roadheaders are generally low capital cost systems compared to the most other mechanical excavators. Because of higher cutting power density due to a smaller cutting drum, they offer the capability to excavate rocks harder and more abrasive than their counterparts, such as the continuous miners and the borers.ROADHEADERS IN LAST 50 YEARSRoadheaders were first developed for mechanical excavation of coal in the early 50s. Today, their application areas have expanded beyond coal mining as a result of continual performance increases brought about by new technological developments and design improvements. The major improvements achieved in the last 50 years consist of steadily increased machine weight, size and cutterhead power, improved design of boom, muck pick up and loading system, more efficient cutterhead design, metallurgical developments in cutting bits, advances in hydraulic and electrical systems, and more widespread use of automation and remote control features. All these have led to drastic enhancements in machine cutting capabilities, system availability and the service life.Machine weights have reached up to 120 tons providing more stable and stiffer (less vibration, less maintenance) platforms from which higher thrust forces can be generated for attacking harder rock formations. . The cutterhead power has increased significantly, approaching 500 kW to allow for higher torque capacities. Modern machines have the ability to cut cross-sections over 100m2 from a stationary point. Computer aided cutterhead lacing design has developed to a stage to enable the design of optimal bit layout to achieve the maximum efficiency in the rock and geologic conditions to be encountered. The cutting bits have evolved from simple chisel to robust conical bits. The muck collection and transport systems have also undergone major improvements, increasing attainable production rates. The loading apron can now be manufactured as an extendible piece providing for more mobility and flexibility. The machines can be equipped with rock bolting and automatic dust suppression equipment to enhance the safety of personnel working at the heading. They can also be fitted with laser-guided alignment control systems, computer profile controlling and remote control systems allowing for reduced operator sensitivity coupled with increased efficiency and productivity. Figure-1 shows a picture of a modern transverse type roadheader with telescopic boom and bolting system.Mobility, flexibility and the selective mining capability constitute some of the most important application advantages of roadheaders leading to cost effective operations. Mobility means easy relocation from one face to another to meet the daily development and production requirements of a mine. Flexibility allows for quick changes in operational conditions such asFigure-1: A Transverse Cutterhead Roadheader (Courtesy of Voest Alpine)different opening profiles (horse-shoe, rectangular, etc.), cross-sectional sizes, gradients (up to 20, sometimes 30 degrees), and the turning radius (can make an almost 90 degree turn). Selectivity refers to the ability to excavate different parts of a mixed face where the ore can be mined separately to reduce dilution and to minimize waste handling, both contributing to improved productivity. Since roadheaders are partial-face machines, the face is accessible, and therefore, cutters can be inspected and changed easily, and the roof support can be installed very close to the face. In addition to these, high production rates in favorable ground conditions, improved safety, reduced ground support and ventilation requirements, all resulting in reduced excavation costs are the other important advantages of roadheaders.The hard rock cutting ability of roadheaders is the most important limiting factor affecting their applications. This is mostly due to the high wear experienced by drag bits in hard, abrasive rocks. The present day, heavy-duty roadheaders can economically cut most rock formations up to 100 MPa (~14,500 psi) uniaxial compressive strength (UCS) and rocks up to 160 MPa (~23,000 psi) UCS if favorable jointing or bedding is present with low RQD numbers. Increasing frequency of joints or other rock weaknesses make the rock excavation easier as the machine simply pulls or rips out the blocks instead of cutting them. If the rock is very abrasive, or the pick consumption rate is more than 1-pick/m3, then roadheader excavation usually becomes uneconomical due to frequent bit changes coupled with increased machine vibrations and maintenance costs.A significant amount of effort has been placed over the years on increasing the ability of roadheaders to cut hard rock. Most of these efforts have focused on structural changes in the machines, such as increased weight, stiffer frames and more cutterhead power. Extensive field trials of these machines showed that the cutting tool is still the weakest point in hard rock excavation. Unless a drastic improvement is achieved in bit life, the true hard rock cutting is still beyond the realm of possibility with roadheaders. The Earth Mechanics Institute(EMI) of the Colorado School of Mines has been developing a new cutter technology, the Mini-Disc Cutter, to implement the hard rock cutting ability of disc cutters on roadheaders,as well as other types of mechanical excavators (Ozdemir et al, 1995). The full-scale laboratory tests with a standard transverse cutterhead showed that MiniDisc Cutters could increase the ability of the roadheaders for hard rock excavation while providing for lesser cutter change and maintenance stoppages. This new cutting technology holds great promise for application on roadheaders to extend their capability into economical excavation of hard rocks. In addition, using the mini-disc cutters, a drum miner concept has been developed by EMI for application to hard rock mine development. A picture of the drum miner during full-scale laboratory testing is shown in Figure-2.Figure-2: Drum Miner CutterheadFIELD PERFORMANCE DATABASEPerformance prediction is an important factor for successful roadheader application. This deals generally with machine selection, production rate and bit cost estimation. Successful application of roadheader technology to any mining operation dictates that accurate and reliable estimates are developed for attainable production rates and the accompanying bit costs. In addition, it is of crucial importance that the bit design and cutterhead layout is optimized for the rock conditions to be encountered during excavation.Performance prediction encompasses the assessment of instantaneous cutting rates, bit consumption rates and machine utilization for different geological units. The instantaneous cutting rate (ICR) is the production rate during actual cutting time, (tons or m3 / cutting hour). Pick consumption rate refers to the number of picks changed per unit volume or weight of rock excavated, (picks / m3 or ton). Machine utilization is the percentage of time used for excavation during the projectTable-I: Classification of the Information in the DatabaseINFORMATION GROUP DETAILSGeneral Information Type/purpose of excavation (roadway, railway, sewer, mining gallery, etc.), contractor, owner, consultant, location, starting andthe Istanbul Technical University has established an extensive database related to the field performance of roadheaders with the objective of developing empirical models for accurate and reliable performance predictions. The database contains field data from numerous mining and civil construction projects worldwide and includes a variety of roadheaders and different geotechnical conditions.The empirical performance prediction methods are principally based on the past experience and the statistical interpretation of the previously recorded case histories. To obtain the required field data in an usable and meaningful format, a data collection sheet was prepared and sent to major contractors, owners, consultants, and roadheader manufacturers. In addition, data was gathered from available literature on roadheader performance and through actual visits to job sites. This data collection effort is continuing.The database includes six categories of information, as shown in Table-I. The geological parameters in the database consist generally of rock mass and intact rock properties. The most important and pertinent rock mass properties contained in the database include Rock Quality Designation (RQD), bedding thickness, strike and dip of joint sets and hydrological conditions. The intact rock properties are uniaxial compressive strength, tensile strength, quartz content, texture and abrasivity. The rock formations are divided into separate zones to minimize the variations in the machine performance data to provide for moreaccurate analysis. This also simplifies the classification of the properties for each zone and the analysis of the field performance data.The major roadheader parameters included are the machine type (crawler mounted, shielded), machine weight, cutterhead type (axial, transverse), cutterhead power, cutterhead-lacing design, boom type (single, double, telescopic, articulated), and the ancillary equipment (i.e.grippers, automatic profiling, laser guidance, bit cooling and dust suppression by water jets, etc.).The operational parameters generally affect the performance of the excavator through machine utilization. The most important operational parameters include ground support, back up system (transportation, utility lines, power supply, surveying, etc.), ground treatment (water drainage, grouting, freezing, etc.), labor (availability and quality), and organization of the project (management, shift hours, material supply, etc.).CONCLUSIONSThe evaluation and analysis of the data compiled in the roadheader field performance database has successfully yielded a set of equations which can be used to predict the instantaneous cutting rate (ICR) and the bit consumption rate(BCR) for roadheaders. A good relationship was found to exist between these two parameters and the machine power (P), weight (W) and the rock compressive strength (UCS). Equations were developed for these parameters as a function of P, W and UCS. These equations were found mainly applicable to soft rocks of evaporatic origin. The current analysis is being extended to include harder rocks with or without joints to make the equations more universal. In jointed rock, the RQD value will be utilized as a measure of rock mass characteristics from a roadheader cuttability viewpoint. It is believed that these efforts will lead to the formulation of an accurate roadheader performance prediction model which can be used in different rock types where the roadheaders are economically applicable.中文译文:掘进机在采矿和隧道业中的应用摘要掘进机为方便的挖掘中硬岩石提供了一个独特的能力。
煤矿隐蔽致灾因素相关文件要求1.煤矿隐蔽致灾因素相关文件应当包括煤矿隐蔽致灾的原因分析和防范措施。
Coal mine concealed disaster-prone factors related documents should include the analysis of the causes of concealed disasters in coal mines and preventive measures.2.文件中应包含煤矿隐蔽致灾的具体表现及其危害性的描述。
The document should include a description of the specific manifestations of concealed disasters in coal mines and their harmfulness.3.需要说明煤矿隐蔽致灾的风险评估和应急预案的制定。
It is necessary to specify the risk assessment of concealed disasters in coal mines and the formulation of emergency plans.4.文件要求对矿井地质构造和瓦斯等气体情况进行详细描述和分析。
The document requires a detailed description and analysis of the geological structure of the mine and the situation of gases such as gas.5.必须对矿井地质构造和气体情况可能引发的隐蔽致灾危险进行评估。
It is necessary to assess the concealed disaster risks that may be caused by the geological structure and gas situation of the mine.6.文件中应包括对矿井通风、排水、支护等系统设施的安全状况和影响因素的分析。
中英文资料对照外文翻译文献综述附录A:Status of worldwide coal mine methaneemissions and useUnderground coal mines worldwide liberate an estimated 29–41×109 m3 of methane annually, of which less than 2.3×10⁹ m3 are used as fuel. The remaining methane is emitted to the atmosphere, representing the loss of a valuable energy resource. Methane is also a major greenhouse gas and is thus detrimental to the environment when vented to the atmosphere. Coal mine methane recovery and use represents a cost-effective means of significantly reducing methane emissions from coal mining, while increasing mine safety and improving mine economics.The world’s ten largest coal producers are responsible for 90% of global methane emissions associated with the coal fuel cycle. China is the largest emitter of coal mine methane, followed by the Commonwealth of Independent States, or CIS particularly Russia, Ukraine and Kazakhstan, the United States, Poland, Germany, South Africa, the United Kingdom, Australia, India and the Czech Republic. Most of these countries use a portion of the methane that is liberated from their coal mines, but the utilization rate tends to be low and some countries use none at all. Coal mine methane is currently used for a variety of purposes. Methane is used for heating and cooking at many mine facilities and nearby residences. It is also used to fuel boilers, to generate electricity, directly heat air for mine ventilation systems andfor coal drying. Several mines in the United States sell high-quality mine gas to natural gas distributors. There are several barriers to decreasing methane emissions by increasing coal mine methane use. Many of the same barriers are common to a number of the subject countries. Technical barriers include low-permeability coals; variable or low gas quality, variations in gas supply an demand and lack of infrastructure.Economic and institutional barriers include lack of information pertinent to development of the resource, lack of capital and low natural gas prices. A possible option for encouraging coal mine methane recovery and use would be international adoption of a traceable permit system for methane emissions.1 IntroductionIn recent years, coalbed methane has gained attention as a saleable natural gas resource. Methane can be extracted either from coal seams which will never undergo mining, or it can be produced as a part of the coal mining process. This paper focuses on methane which is produced in conjunction with coal mining operations(coal mine methane). According to the United States Environmental Protection Agency (USEPA, 1994a), underground coal mines liberate an estimated 29 to 41×109 m 3of methane annually, of which less than 2.3×10⁹ m3 are used as fuel. The remaining methane is vented to the atmosphere, representing the loss of a valuable energy resource. This paper examines the potential for recovering and using the methane which is currently being emitted from coal mines.There are three primary reasons for recovering coal mine methane. The first reason is to increase mine safety. Worldwide, there have beenthousands of recorded fatalities from underground mine explosions in which methane was a contributing factor. Using methane drainage systems, mines can reduce the methane concentration in their ventilation air, ultimately reducing ventilation requirements.The second reason is to improve mine economics. By reducing emissions and preventing explosions and outbursts, methane drainage systems can cost effectively reduce the amount of time that the coal mine must curtail production. Moreover, recovered methane can be used either as fuel at the mine site or sold to other users.The third reason for coalbed methane recovery and use is that it benefits the global and local environment. Methane is a major greenhouse gas and is second in global impact only to carbon dioxide; methane thus is detrimental to the environment if vented to the atmosphere. Although the amount of carbon dioxide accumulating in the atmosphere each year is orders of magnitude larger than that of methane, each additional gram of methane released to the atmosphere is as much as 22 times more effective in potentially warming the Earth’s surface over a 100-year period than each additional gram of carbon dioxide (USEPA, 1994a) . Compared with other greenhouse gases, methane has a relatively short atmospheric lifetime. The lifetime of methane (defined as its atmospheric content divided by its rate of removal) is approximately 10 years. Due to its short lifetime, stabilizing methane emissions can have a dramatic impact on decreasing the buildup of greenhouse gases in the atmosphere.Coal mine methane recovery and use represent a cost-effectivemeans of significantly reducing methane emissions from coal mines. Methane, moreover, is a remarkably clean fuel. Methane combustion produces no sulfur dioxide or particulates and only half the amount of carbon dioxide that is associated with coal combustion on an energy equivalent basis.Because of the environmental impact of coal mine methane emissions, the USEPA, the Int ernational Energy Agency’s Coal Advisory Board (CIAB), and others have investigated methane emissions from coal mining worldwide. The USEPA (1994a) estimates that the coal fuel cycle (which includes coal mining, post-mining coal transportation and handling, and coal combustion) emits 35 to 59×109 m3 of methane to the atmosphere annually. Table 1 shows methane emissions from the world’s ten largest coal producers, which are responsible for 90% of global methane emissions associated with the coal fuel cycle. Underground coal mining is the primary source of these emissions, accounting for 70 to 95% of total emissions.There are many opportunities for decreasing coal mine methane emissions by increasing recovery of this abundant fuel. Section 2 examines the status of methane recovery and use in key countries worldwide.2 Coal mine methane recovery and use in selected countries2.1 ChinaThe Peoples Republic of China (China) produces about 1.2×10⁹ raw tons of hard coal annually (EIA, 1996). In 1990, coal mining activities in China emitted an estimated 14 to 24×109 m3 (10 to 16×106 ton) ofmethane to the atmosphere, contributing one-third of the world’s total from this source. Not only is China the largest coal producer in the world; it is unique in that underground mines produce over 95% of the nation’s coal. Because of the great depth and high rank of China’s coals, underground coal mines have higher methane emissions than surface mines.There are currently 108 Coal Mining Administrations (CMAs) in China, which manage more than 650 mines. These state-owned mines are responsible for most of China’s methane emissions, but there are numerous gassy local, township, and private mines that cumulatively produce over one-half of China’s coal. However, these non-states owned mines are not gassy (International Energy Agency or IEA, 1994).2.1.1 Methane recovery and use in ChinaChina has a long history of coal mine methane drainage, and the volume of methane drained has increased markedly during the past decade. Nationwide, coal mine methane drainage at state-run mines nearly doubled in 14 years, increasing from 294×106 m3 in 1980 to more than 561×106 m3 in 1994 .However, this is still less than 11% of the total methane liberated annually. Approximately 131 state-owned mines currently have methane drainage systems. Less than one-half of these mines are set up to distribute and use recovered methane. China’s state-run coal mining administrations use about 70% of the methane they drain (USEPA, 1996a).Most of the methane recovered from Chinese mines is used forheating and cooking at mine facilities and nearby residences. Methane is also used for industrial purposes, in the glass and plastics industries, and as a feedstock for the production of carbon black (an amorphous form of ca rbon used in pigments and printer’s ink). Methane is also being used, to a lesser extent, for power generation. In 1990, the Laohutai Mine at the Fushun Coal Mining Administration built a 1200 kW methane-fired power station, the first in China.Several barriers currently prevent China from developing economic methane recovery from coal mining to its full potential. Critical barriers include the lack of an appropriate policy framework, limited capital for project investments and equipment, the need for additional information and experience with technologies and the lack of a widespread pipeline network. Artificially regulated low gas prices and difficulty with repatriation of profits, create barriers to foreign investment in joint ventures for production of domestic energy resources (USEPA, 1993).2.1.2 The future of methane development in China Recognizing the need for a unified effort in advancing coalbed methane development, China’s highest governing body, the State Council, established the China United Coalbed Methane Company (China CBM) in May 1996. As a single, trans-sectoral agency, China CBM is responsible for developing the coalbed methane industry by commercializing the exploration, development, marketing, transportation and utilization of coalbed methane. The State Council has also granted China CBM exclusive rights to undertake theexploration, development and production of coalbed methane in coopera- tion with foreign partners (China Energy Report, 1996). More than 20 coalbed methane projects are underway or planned in China, and at least half of them are taking place at active mining areas. Some of the projects are state-sponsored, while others involve joint ventures with foreign companies. The future of the coalbed methane industry in China appears bright. The government recognizes coalbed methane’s potential for meeting the nation’s burgeoning energy needs and is generally supportive of efforts to develop this resource. With deregulation of energy prices, increased capital investment in pipeline infrastructure, and ongoing research efforts, China can likely overcome its remaining barriers to widespread coalbed methane use. 2.2 Russia, Ukraine and KazakhstanIn 1994, Russia produced more than 169×106 ton of hard coal; Kazakhstan produced nearly 104×106 ton and Ukraine more than 90×106 ton. The coal mining regions of these republics liberate approximately 5.3×10⁹ m3 of methane annually, of which less than 3% is utilized. This amount represents about 20% of world methane emissions from underground coal mining.The energy sectors of these Republics are at a turning point. The coal mining industry, in particular, is undergoing restructuring, a process which includes decreasing or eliminating subsidies, and closing many of the most unprofitable mines. The industry is being compelled to become more efficient in order to increase profitability. Mining regions are also seeking to mitigate environmental problemsresulting from producing and using coal. Thus, there is an impetus to utilize more natural gas and decrease dependency on low grade coal. Increasing recovery and use of coalbed methane is a potential means of improving mine safety and profitability while meeting the regions’ energy and environmental goals.There are five coal basins in the Commonwealth of Independent States where hard coal is mined and which have the potential for coalbed methane development.They are: (1) the Donetsk Basin (Donbass) , located in southeastern Ukraine and western Russia, (2) the Kuznetsk Basin Kuzbass , located in western Siberia (south-central Russia) , (3)the L’vov-Volyn Basin, located in western Ukraine, which is the southeastern extension of Poland’s Lublin Basin, (4)the Pechora Basin, located in northern Russia and (5) the Karaganda Coal Basin, located in Kazakhstan.Of the five basins, the Donetsk and Kuznetsk Basins appear to have the largest near-term potential for coalbed methane development (USEPA, 1994b). Both of these regions are heavily industrialized and present many opportunities for coalbed methane use.2.2.1 Options for methane use in the CIS2.2.1.1 Heating mine facilities. Currently, most mines use coal-fired boilers to produce steam heat for drying coal, heating mine facilities and heating ventilation air. In some cases, mine boilers also supply thermal energy to the surrounding communities. Boilers can be retrofitted to co-fire methane with coal, a relatively simple and low-cost procedure. More than 20 mines in the Donetsk and PechoraBasins use methane to fuel boilers and several mines also use it for directly heating air for the mines’ ventilation systems and for coal drying (Serov, 1995; Saprykin et al., 1995).2.2.1.2. Use in furnaces in the metallurgical industry. Another viable market for methane use is the metallurgical industry. For example, the city of Novokuznetsk, in the southern portion of the Kuznetsk Basin, contains numerous gassy mines and is one of the biggest centers of metallurgy in Russia. The region’s metallurgical industry consumes about 54 PJ of natural gas annually, which is equivalent to about1.4×109 m3 of methane (USEPA, 1996b) .2.2.1.3. Power generation at mine facilities. Most mines purchase electricity from the power grid. Co-firing coalbed methane with coal to generate electricity on-site may be a more economical option for these mines. Coalbed methane can be used, independently of or in conjunction with coal, to generate electricity using boilers, gas turbines and thermal combustion engines (USEPA, 1994b).2.2.1.4. Use as a motor vehicle fuel. The Donetskugol Coal Production Association in Ukraine is draining methane in advance of mining using surface boreholes. The recovered methane is compressed on-site and used as fuel for the Association’s vehicle fleet. The refueling station, which has been operating for more than three years, produces about 1,000 m3 of compressed gas per day. Based on estimated gas reserves it is expected to operate for a total of eight years ( Pudak, 1995 ).While many mines in the CIS are utilizing their methane resources,the majority are not. Certain barriers must be overcome before recovery and use of coal mine methane becomes widespread. These barriers and their potential solutions are discussed in greater detail in Section 3 of this paper.2.3 The United StatesThere are five major coal producing regions in the United States from which hard coal is mined and which have the potential for coalbed methane development. They are: (1)the Appalachian Basin, located in Pennsylvania, Ohio, West Virginia, eastern Kentucky and Tennessee, (2)the Warrior Basin, located in Alabama, (3)the Illinois Basin, located in Illinois, Indiana and western Kentucky, (4)the Southwestern region, including the Uinta, Piceance, Green River and San Juan Basins located in Colorado, Utah and New Mexico and (5)the Western Interior region, including the Arkoma Basin of Oklahoma and Arkansas.In 1994, an estimated 4.2×10⁹ m3 of methane were liberated by underground mining in these regions, of which less than 0.7×10⁹ m3 were used(USEPA, unpublished data).Currently in the United States, at least 17 mines in six states (Alabama, Colorado,Ohio, Pennsylvania, Virginia and West Virginia)recover methane for profit, primarily through sale to gas distributors. In 1995, the total methane recovered from these mines, including vertical wells draining methane in advance of mining, exceeded 1×10⁹ m3.By maximizing the amount of gas recovered via drainage systems, these mines have greatly reduced their ventilationcosts, improved safety conditions for miners and have collected and sold large quantities of high-quality gas. Following is a brief description of selected coal mine methane recovery activities in the United States.2.3.1 Warrior basin: AlabamaSix of the seventeen US mines with commercial methane recovery systems are located in the Warrior Basin of Alabama. Today, energy companies recover methane from the Warrior Basin by horizontal wells, gob wells(in areas being mined )and vertical wells(in both mined and unmined areas). Most of this gas is sold to regional natural gas distributors, although there is some on-site mine use. In 1995, four mines operated by Jim Walter Resources produced more than 380×106 m3 of methane for pipeline sale and USX’s Oak Grove Mine recovered an estimated 117×106 m3 of methane for use.2.3.2 Appalachian regionEight mines in Virginia and West Virginia have developed successful methane recovery and use projects. The Consol mines in Virginia are the most well-documented examples. Consol produces gas from a combination of vertical wells that are hydraulically stimulated, horizontal boreholes and gob wells drilled over longwall panels. In 1995, Consol produced approximately 688×106 m3 of saleable methane from three mines. Methane recovery efficiency at these mines is higher than 60%.2.3.3 Southwestern regionThe Soldier Canyon Mine in Utah recovered about 10.9×10⁶ m3 ofmethane for sale annually until early 1994, when production was curtailed and gas sales ended due to low market prices.2.3.4 SummaryWhile methane recovery has been economically implemented at the above-described mines, safety and high coal productivity remain the impetus for their degasification efforts. Methane drainage at many gassy mines in the United States is limited or nonexistent. Section 3 of this paper discusses potential avenues for increasing methane recovery and use in the United States and other countries.2.4 GermanyGermany produced nearly 54 million tons of hard coal in 1995, all from underground mines (Schiffer, 1995). Of this total, 43 million tons were mined from the Ruhr Basin in northwestern Germany (Von Sperber et al., 1996)and most of the remainder was mined from the Saar Basin in southwestern Germany. Until recently, hard coal mining was heavily subsidized in Germany, and the industry’s future is in question (Schiffer, 1995). Even mines that are closed, however, can continue to liberate methane for long periods of time. An estimated 1.8×10⁹ m3 of methane are liberated annually from underground mining activities in Germany, of which 520×106 m3, or 30%, are drained(63 IEA, 1994). About 371×106 m, or 71% of all drained methane is used, primarily for heating or power generation. Government officials suggest that as much as 45% of the methane emitted from coal mining activities could be drained and used in a variety of applications. The primary barrier to increased methanerecovery is low methane concentrations in the gas mixture.Safety regulations in Germany prohibit any utilization if the methane content is less than 25%. If the average recovery efficiency at German mines is to be increased, it will be necessary to adopt practices that will recover methane in a more concentrated form.3 Barriers to decreasing coal mine methane emissionsThere are several barriers to decreasing methane emissions by increasing coal mine methane use. Some are technical, such as low coal permeability, while others are Institutional, such as low gas prices. In a few cases, certain barriers are country orregion specific, but most cases, many of the same barriers exist in a number of countries. This section discusses obstacles to increased coal mine methane use, and potential ways to overcome these obstacles.3.1 Technical issues3.1.1 Low-permeability coalsCoal seams that exhibit low permeability pose special problems for developingsuccessful methane drainage and recovery systems. Methane desorbs and flows through natural pores and fractures until the gas reaches the mine face or borehole. Stimulation technology that enhances the flow of gases from the seam into a recovery system has been successfully used in the past several years. Early efforts to modify fracturing techniques for application in coal seams were largely unsuccessful (IEA, 1994). The current practice of hydraulic stimulation in coals, however, minimizes roof damage while achievingextensive fracturing. Under ideal conditions, 60 to 70% of the methane contained in the coal seam can be removed using vertical degasification wells drilled more than 10 years in advance of mining. These efforts have been successful in the United States and other industrialized countries. Transfer of this technology to other countries can help increase coal mine methane recovery.3.2 Economic and institutional issuesIn addition to the technical obstacles described above, there are a variety of other issues that have prevented coal mine methane recovery from becoming more widespread.These issues include lack of information, lack of capital, low natural gas prices and risks associated with foreign investment. Some issues are explored below.The key strategy for overcoming informational barriers in the United States has been to develop outreach programs. Outreach programs work well when companies are shown that they can profit while at the same time reducing emissions or improving mine safety. Examples of outreach prog rams include the USEPA’s Coalbed Methane Outreach Program, which is conducted in the United States, and the Coalbed Methane Clearinghouses in Poland, China and Russia. These institutions distribute information and link together interested parties, provide technical training, and in some cases perform pre-feasibility assessments for specific projects.3.2.1 Lack of informationIn the United States and other countries, one of the problems thathas slowed coal mine methane project development is that some coal mine operators do not have adequate information regarding coal mine methane projects. While much has been published on the subject, methane recovery is still seen as a relatively new concept to many coal operators. A related constraint is that some coal operators simply do not have the time or resources to investigate the potential to develop a profitable project at their own coal mine.3.2.2 Lack of capitalEven when a pre-feasibility assessment has demonstrated that the economics of a coal mine methane project are attractive, a lack of financing may prevent projects from taking place. Coal companies often do not have surplus capital available to invest in coalbed methane recovery and use projects because available capital must be invested in their primary business of coal production. Additionally, some lending organizations may be unfamiliar with the relatively new concept of coal mine methane recovery and use, and project developers may thus be unable to secure the necessary up-front financing needed to cover the large capital investments required for such projects.3.2.3 Low natural gas pricesIn some countries natural gas prices are held at artificially low rates. Even in countries whose gas prices are at market levels, prices may be low due to low demand. In such cases, special types of incentives to encourage coal mine methane recovery could be implemented. For example, legislation could be enacted requiring local distributioncompanies to purchase recovered coal mine methane if it is sold at a competitive price. China has recently established preferential policies for projects which involve gas recovery and use from coal mines. The government has also passed a law exempting coalbed methane producers from royalties and land occupation fees for production of up to 2×10⁹ m3 of methane per year.4 ConclusionsAs discussed above, coal mines worldwide emit large volumes of methane, much of which could be recovered and used as fuel. In many instances, countries whose mines emit large quantities of methane are in critical need of a domestic energy source, particularly one which is clean-burning. In countries whose economies are in transition, such as China, the former Soviet Union and the Eastern European nations, coal mine methane recovery offers economic benefits as a new industry that can help provide jobs for displaced coal miners or other workers. In countries whose economies are established, such as the United States, the United Kingdom and Australia, coal mine methane recovery may help increase the profit margin of mining enterprises.The reduction of methane emissions can have a significant global impact, but incentives are needed to encourage more widespread recovery of coal mine methane. An incentive program offered on an international level would probably be the most effective means of stimulating development of the coal mine methane industry. Of the various options for international-level incentives, a system of tradeable permits for methane emissions would likely be the most cost effective.Due to various technical, economic and institutional barriers, it will never be possible to completely eliminate emissions of methane from coal mines. However, a worldwide coal mine methane utilization rate of 25% may be realizable, particularly if an international incentive program is implemented. This would reduce the estimated emissions of coal mine methane to the atmosphere by 7 to 10×109 m3 annually, substantially reducing greenhouse gas emissions and curtailing the waste of a valuable energy source.附录B全球煤矿瓦斯涌出及利用现状全球煤矿每年释放瓦斯29~41×109m3,其中少于2.3×10⁹m3的瓦斯用作燃料,其余的被直接排放到大气中,这是能源的一种浪费。
Effects of pipe roof supports and the excavation method onthe displacements above a tunnel faceM.Hisatake *,S.OhnoDepartment of Civil and Environmental Engineering,Faculty of Science and Engineering,Kinki University,Kowakae 3-4-1,Higashi-Osaka,Osaka 577-8502,JapanReceived 28July 2006;received in revised form 8February 2007;accepted 10February 2007Available online 3April 2007AbstractCentrifugal model tests are conducted in order to clarify the effects of pipe roof supports and the excavation method on the displace-ments above a tunnel face.The excavation process must be taken into account when estimating the displacements.Therefore,an exca-vation robot is newly developed which is three-dimensionally controlled by computer programs and is able to excavate the tunnel face in arbitrary shapes.The robot can accurately simulate such excavation methods as the full-face excavation method and the ring-cut exca-vation method.The difference in displacements between the two excavation methods is discussed in terms of the existence or the non-existence of pipe roof supports.The results of the model tests show the quantitative effects of the ring-cut excavation method and clarify that the method decreases the ground displacements remarkably.The model tests also indicate that the maximum settlement of a ground excavated by the full-face excavation method with pipe roof supports is one fourth of that without them.Ó2007Elsevier Ltd.All rights reserved.Keywords:Excavation robot;Pipe roof supports;Excavation methods;Centrifugal model tests1.IntroductionThe mountain tunneling method is presently used for soft grounds with shallow depths in urban areas.This method is less expensive to apply,in comparison to the shield tunneling method,and it can easily change the shape of a tunnel’s cross section.The method often employs aux-iliary methods,such as the pipe roof support system,in order to avoid serious consequences to the surrounding environment (Sasaki et al.,2001).The effects of decreasing the ground settlements by employing the pipe roof support system have not been clarified quantitatively.This is because the effects are three-dimensional phenomena and are subjected not only to the influence of the construction sequence,but also to the nonlinear mechanical characteris-tics of the ground.In many cases,the estimations of theground settlements are merely empirical or depend on non-validated numerical calculations (Volkmann,2004).In many research works that clarify the effects of the pipe roof support system,centrifugal model tests have been very effective in estimating the quantitative settlements.This is because the model tests can take into account the above-mentioned factors.It is very important to keep in mind the tunnel face excavation process in the model tests.Consideration given to this process,however,has been inadequate for the centrifugal model tests up to now.This has led to an insufficient amount of information on the set-tlements caused by the difference in excavation processes between the full-face excavation method and the ring-cut excavation method.In short,special regard should be paid to the excavation process in the centrifugal model tests in order to estimate the settlements quantitatively.The objective of this research is to develop an excava-tion robot for the centrifugal model tests and to clarify the displacement characteristics of the ground in terms of the excavation process and the existence or the nonexistence0886-7798/$-see front matter Ó2007Elsevier Ltd.All rights reserved.doi:10.1016/j.tust.2007.02.002*Corresponding author.Tel.:+81667212332;fax:+81729955192.E-mail address:hisatake@civileng.kindai.ac.jp (M.Hisatake)./locate/tustTunnelling and Underground Space Technology 23(2008)120–127Tunnelling andUnderground Space Technologyincorporating Trenchless Technology Researchof pipe roof supports.The robot imitates the movement of the roadheader that is applied to actual tunnel sites,and computer programs control its movement three-dimensionally.2.System for the experiments2.1.Drum type of centrifugal model test equipment Photo 1and Table 1show the drum type of centrifugal model test equipment and its specific characteristics,puter programs control the data assem-blages as well as the movement of the machines through a wireless operation.2.2.Excavation robotPhoto 2shows the excavation robot developed in this study.It consists of movable axes in the x ,y ,and z direc-tions,a rotation shaft,a bit (Photo 3),and a discharge sys-tem (Fig.1)for the excavated ground material.Thus,the robot can excavate the ground three-dimensionally at any arbitrary point.The external diameter of the excavation bit is 18mm,and the excavated ground material is dis-charged through an excavation shaft.2.3.Measuring system of the ground displacements The ground displacements,caused by the tunnel excava-tion performed by the robot,are recorded on video tape and are measured by a picture analysis system with high accuracy.The movements of the ground particles above the face in the vertical section through the tunnel axisarePhoto 1.Drum type of centrifugal model equipment.Table 1Specific characteristics of the centrifugal model equipment Rotating drumInside diameter 1200mm;height 400mm Maximum number of rotations850rpmMaximum acceleration 480GMaximum loading capacity 5000N (at 100G)Slip ring AC100V Rotary joint Two systemsOperationWireless remote control by 2.4GHz regionPicture analysis system 307,840pixels by CMOS/CCD cameras LightingOptical fiber systemExcavation shaftTank for excavated sands Vacuum pumpReserve tank of vacuum1243Photo 2.Experimental ground and excavation robot.Photo 3.Shaft and bit.M.Hisatake,S.Ohno /Tunnelling and Underground Space Technology 23(2008)120–127121measured by video cameras through hard glass.Photo 4shows the positioning of the displacement-measuring cam-eras attached to the hard glass.The video pictures have 640·481=307,840pixels of CMOS image censors and can be enlarged up to 150times (Photo 5),thereby follow-ing the movements of the ground particles from micro-scopic displacements to failure-causing displacements.2.4.Installation conditions of the experimental devices Photo 6illustrates the placement of the experimental devices inside the drum.Seven video cameras record the observation reflexes of the displacements and the state of the excavations through reflection recorders and channel switchers.The wireless video recorder is set inside the drum in order to eliminate the effects of noise.3.Experimental conditions 3.1.Geometrical conditionsIt is assumed in this research that a tunnel is excavated in the ground with the horizontal surface of the earth and has geometrical symmetry at the vertical section through the tunnel axis.Therefore,half the region of the ground and the tunnel is used in the experiments.Fig.2shows the geometrical dimensions of a supporting rib.The lower edge of the rib is widened to enable the smooth transmis-sion of the vertical force,which is subjected to the ground and the pipe roof supports,to the ground.Photo 7shows the supporting rib and seven pipe roof supports which are installed within 60°of the vertical line.The vertical rib attached at the symmetrical plane shown in this photo is an assistant rib set accurately as a supporting rib in a transverse section,and the length of the rib is short enough so that the bottom edge does not make contact with the ground surface during the experiments.The pipe roof supports are 6.25mm in diameter,125mm in length,and the clearance between the pipe roof supportsisPhoto 4.Placement of thecameras.Photo 5.Example of the enlargement of a displacementmeasurement.Photo 6.Placement of the main devices in thedrum.Photo 7.Supporting rib and pipe roof supports.5.01mm56.22mm30.90mm5.01mm13.1mm13.8mm2.Geometry of the supporting 122M.Hisatake,S.Ohno /Tunnelling and Underground Space Technology 23(2008)120–1271.3mm.The experimental ground is 240mm in height,260mm in width for the tunnel’s cross section,150mm in depth in the tunnel’s axial direction,and 125mm for the tunnel overburden.Table 2shows geometrical and mechanical properties of the model ground and the corresponding prototype tunnel.3.2.Ground conditionsThe model ground consists of Toyoura sand (TK-159),and physical properties of Toyoura sand are shown in Table 3.Figs.3and 4show the results for the triaxial com-pression tests.3.3.Sequence of the experimentsThe model ground is made by the compaction method after the supporting rib for the pipe roof supports has been set in the ground box shown in Photo 4.The robot that is controlled by the computer programs excavates the ground under 35G (G:gravity acceleration)of centrifugal acceler-ation.This corresponds to the tunnel height of about 3.0m on an actual scale.During tunnel excavations,the settle-ments and the horizontal displacements in the tunnel’s axial direction are measured at points ‘‘a’’,‘‘b’’,and ‘‘c’’which are located 7mm above the upper surface of the pipe roof supports,as shown in Fig.5.3.4.Kinds of experimentsFour kinds of experiments are conducted,including cases with and without the pipe roof supports and cases using the full-face excavation method and the ring-cut excavation method.The experimental sequence of each of the four cases is defined as follows:Case 1(FFE without PRS ).A full-face excavation (FFE)without the pipe roof supports (PRS)is conducted in this case.The excavation sequence is indicated in Fig.6.Firstly,Table 2Geometrical and mechanical properties of the model ground and the corresponding prototype tunnel PropertyModel Centrifugemodeling at 35g Tunnel radius (mm)50.01750Tunnel center height (mm)80.82828Excavation depth (mm)40.01400Pipe roof supports Diameter (mm) 6.25219Length (mm)125.04375Young’s modulus (N/mm 2) 2.05·105 2.05·105Cross section area (mm 2)30.6637560Bending rigidity 15.4Nm 223.0M Nm 2Density (kN/m 3)78.578.5Tunnel overburden depth (mm)1254380Overburden pressure at the top of the tunnel (kN/m 2) 1.9869.1Table 3Physical properties of Toyoura sand PropertyValue Density at centrifuge modelling q t 15.8kN/m 3Water content w 3.0%Relative density D r 80%Maximum density q dmax 16.73kN/m 3Minimum densityq dmin 13.30kN/m 3Density of soil particle q s 16.40kN/m 3Mean grain size D 500.162mm Cohesionc 20kN/m 2Peak friction angle/38.7°Critical state friction angle/cv30.5°M.Hisatake,S.Ohno /Tunnelling and Underground Space Technology 23(2008)120–127123the robot excavates the ground at point A to a depth of 5mm in the tunnel’s axial direction;it then moves to point B along circular arc r by maintaining an excavation depth of5mm.After this excavation,the robot moves toward the tunnel entrance.It then continues to point A,while maintaining distance from the ground so as not to excavate it.Secondly,the robot excavates the ground along line s by keeping an excavation depth of5mm.Thirdly,the robot excavates the ground from point A to point C and from point C to point B along the two t lines by maintaining an excavation depth of5mm.By repeating this excavation process(r,s,and t)eight times,the face excavation is completed at a depth of40mm(5mm/ pattern·8patterns)in the tunnel’s axial direction.This excavation process is referred to as a full-face excavation (FFE).Case2(FFE with PRS).The same excavation process as in Case1(full-face excavation)is conducted,only this time it is conducted with the pipe roof supports.Case3(RCE with PRS).A ring-cut excavation(RCE)is conducted with the pipe roof supports.The robot excavates the ground along r with a depth of5mm,and this pattern is repeated8times.Thus,the ground is excavated to a depth of40mm(5mm/pattern·8patterns)in the shape of a ring-cut.This excavation process is called a ring-cut excavation(RCE).Case4.(FFE after RCE with PRS).Firstly,a ring-cut excavation,installing the pipe roof supports,is applied to a depth of40mm.This process is the same so far as that in Case3.Secondly,the robot excavates the ground to a depth of40mm(5mm/pattern·8patterns) along line s.Thirdly,the robot excavates the ground to a depth of40mm(5mm/pattern·8patterns)along the two t lines.Therefore,thefinal shape of the tunnel is the same as that with the full-face excavation in Case 2,except that the excavation processes are different from each other.In this case,the excavation process is referred to as a full-face excavation after the ring-cut excavation(FFE after RCE).4.Experimental results and considerations4.1.Effects of the pipe roof supports and the excavation process on the settlementsFig.7a shows the effects of the pipe roof supports and the excavation method on the settlements at measuring point‘‘a’’.The difference in settlements between Cases1 and2,which have both been excavated by the full-face excavation process,is caused only by the existence of the pipe roof supports.It can be understood that the maximum value for the settlements of the ground with the pipe roof supports is about one fourth of that without the pipe roof supports.Thus,the decrease in settlements brought about by the existence of pipe roof supports is recognized quanti-tatively.The settlements in both cases increase nonlinearly in accordance with the progress of the excavation distance.AB C124M.Hisatake,S.Ohno/Tunnelling and Underground Space Technology23(2008)120–127The settlements for Cases2and4are also compared in Fig.7a.For both cases,the excavations are conducted with the pipe roof supports and have the same geometrical con-ditions in tunnel shape in thefinal stage.The difference in settlements between Cases2and4is only due to the differ-ence in the excavation processes.The excavation distance in Case4means the distance of thefinal excavation pro-cess,t,after excavation processes r and s have already been completed rger settlements are observed in Case4than in Case2until the excavation distance reaches40mm,because the pre-excavation volume in Case 4is greater than that in Case2.In thefinal stage,at the excavation distance of40mm,there is no difference at all in settlements between the two cases.This means that the excavation process does not affect the settlements in the final stage.Figs.7b and c show the same results for the settlements at measuring points‘‘b’’and‘‘c’’,respectively.The abso-lute quantity of the settlements decreases in accordance with the increase in the distance between the measuring point and the tunnel face.In general,almost the same rela-tionships can be recognized as those in Fig.7a.Fig.8shows the effects of the pipe roof supports and the excavation method on the horizontal displacements in the tunnel’s axial direction at point‘‘a’’,where the proceeding direction of the tunnel is taken as positive for the horizon-tal displacements.In accordance with the increase in exca-vation distance,the measuring point is drawn toward the tunnel side.The maximum values for every horizontal dis-placement at an excavation distance of40mm are less com-pared to those of the maximum settlements shown in Fig.7a.The ratio of the horizontal displacement in Case1 to that in Case2is not much different from the ratio of the settlements shown in Fig.7a.In other words,the pipe roof supports not only restrain the settlements,but also the horizontal displacements in a similar manner.The rela-tionships between the horizontal displacements and the excavation distances in Cases2and4,which are only dif-ferent in the excavation process,show the same tendency as those between the settlements and the excavation dis-tances shown in Fig.7a.The excavation process does not affect the values of the horizontal displacements in thefinal stage.parison of the displacements in the full-face excavation and in the ring-cut excavationFig.9shows the effects of the excavation method on the settlements of the ground with the pipe roof supports.The settlements at point‘‘a’’produced by both the full-face excavation method(Case2)and the ring-cut excavation method(Case3)are compared in Fig.9a,which indicates that very small settlements are observed in Case3.In other words,the ratio S R/S F of the settlements in Case3(S R) and Case2(S F)is0.02,even though the ratio f R/f F of the excavation areas in the tunnel’s cross section in Case 3(f R)and Case2(f F)is0.55.The reasons for observing very small settlements in Case3may be as follows:M.Hisatake,S.Ohno/Tunnelling and Underground Space Technology23(2008)120–127125(1)Strains levels produced by the tunnel excavation inCase3are small,and the nonlinear behavior of the ground is not excessive.(2)The arching action,which is exhibited in sandygrounds with internal friction(Hisatake,1995, 2001),forms much more around the tunnel face in Case3.The arching action,which formed three-dimensionally around the tunnel face in the ring-cut excavation,must decrease the deformation of the ground in comparison with that in the full-face excavation,but the quantitative effects of the arching action are not clear.This is a subject to be clarified in the future.Thefinal settlement after the excavation of the core,which is left in the ring-cut excava-tion,is almost equal to that in the full-face excavation,as shown in Fig.7a.It may be recognized that the removal of the core reduces the effects of the above-mentioned arch-ing action.Figs.9b and c show the settlements observed at measur-ing points‘‘b’’and‘‘c’’,respectively.Although the same tendency can be recognized,the values for the settlements in Case2come proportionally lose to those in Case3as the distance between the measuring point and the tunnel face separates.4.3.Increases in displacements in accordance with the progress of the excavationsFig.10shows the increase in displacements at measur-ing point‘‘a’’in accordance with the progress of excava-tions r,s,and t in Case4,in which the pipe roof supports are installed(FFE after RCE with PRS).The relationships between the settlements and the excavation distances are indicated in Fig.10a.Very small settlements are observed at ring-cut excavation r,and an increase in the settlements is also considerably restrained during excavation s.Excavation t,in which the core is elimi-nated,produces excessive settlements.In other words, in thefinal stage of excavation t,which means the full-face excavation,the maximum value for the settle-ment is about6times that produced in thefinal stage of excavation s.This means that the existence of the core,even if the area of the core in the tunnel’s cross sec-tion is18%of the excavation area in the full-face excava-tion,exhibits considerable restraint in terms of the settlement produced.Fig.10b shows the relationship between the excavation distance and the horizontal dis-placements in the tunnel’s axial direction,and almost the same tendency is recognized.The ring-cut excavation method is ordinarily applied to tunnels in weak grounds in order to maintain the face sta-bility.As mentioned above,this method has a sufficient effect on the restraint of the displacements produced ahead of the tunnel face when the pipe roof supports are installed. The steel ribs and the shotcrete installed under the exis-tence of the core in the ring-cut excavation method can sus-tain the ground displacements that would otherwise be produced as the tunnel face progressed.5.ConclusionsThe results obtained in this study are as follows: (1)In order to clarify the effects of both the tunnel exca-vation process and the pipe roof supports on ground displacements,an excavation robot has been developed for the centrifugal model puter programs control the movements of the robot three-dimensionally.(2)The maximum settlement of a ground excavated bythe full-face excavation method with the pipe roof supports is about one fourth of that without the pipe roof supports under the same experimental conditions.(3)The excavation process does not affect the magnitudeof thefinal displacements in the experiments without linings if the geometrical conditions of the tunnel shape are the same at thefinal stage.(4)The existence of the core remaining in the ring-cutexcavation method exhibits the effect of a consider-able restraint of the ground displacements when the pipe roof supports are installed,even if the volume of the core is small.126M.Hisatake,S.Ohno/Tunnelling and Underground Space Technology23(2008)120–127ReferencesHisatake,M.,1995.Tunnel face behavior at sandy shallow ground.Journal of Geotechnical Engineering,Japan Society of Civil Engineers 517,105–115.Hisatake,M.,2001.Static and dynamic failure movement of tunnel face and its stability assessment.Journal of Geotech-nical Engineering,Japan Society of Civil Engineers694,297–304.Sasaki,R.et al.,2001.Excavation monitoring of a large cross section tunnel underpassing an existing railway.In:Proceedings of Modern Tunneling Science and Technology.pp.253–258.Volkmann,G.,2004.A contribution to the effect and behavior of pipe roof supports.In:Proceedings of EUROCK2004.pp.161–166.M.Hisatake,S.Ohno/Tunnelling and Underground Space Technology23(2008)120–127127。
ApracticaluseofCFDforventilationofundergroundworksIsidroDiego⇑,SusanaTorno,JavierToraño,MarioMenéndez,MalcolmGentSchoolofMinesofOviedo,UniversityofOviedo,Spain
articleinfoArticlehistory:Received18March2009Receivedinrevisedform1June2010Accepted25August2010Availableonlinexxxx
Keywords:PressuredropAirlossesCFDTunnelventilation
abstractAnyundergroundworkofaminimumlengthhasassociatedastudyofaventilationsystem.Thetradi-tionalwaytocalculatethesesystemsrequiresthecalculationoftheairlossesallovertheinstallationinordertoselectanadequategroupoffans.Thispapercalculatesthelossesin138situationsofcirculartunnels(varyingtunneldiameter,airvelocityandsurfacecharacteristics),bybothtraditionalandCFD(computationalfluiddynamics)means.Theresultsofbothmethodsarecomparedandadequatecorrela-tionhasbeenobserved,withCFDvaluesconstantlya17%belowthevaluescalculatedbytraditionalmeans.ThepaperdealswiththemainproblemscommonlyencounteredintheCFDuse,meshingandtur-bulence,andshowsguidanceonthepracticaluseofthisnumericalmethod.Therearealsoshownthecapabilitiesofthemethodinsimulationdomainsincludingmachineryofundergroundworks:roadhead-ers,dumpersandexcavators.Ó2010ElsevierLtd.Allrightsreserved.
1.IntroductionThecreationofundergroundspacesisacomplicatedengineer-ingproblem,mainlyduetothecomplexphysicalphenomenain-volvedintheexcavationandsupportoftheundergroundopening.Butthemerefactofintroducingourselvesinanundergroundspacewithaminimumlengthhasalwaysassociatedtheresolutionoftwofundamentalproblems:firstthelackoflightandsecondthelimited,intime,freshairwhichrequirestheuseofventilationsys-tems.ThelackoflighthasbeensolvedsincetheendofXIXcenturythroughtheuseofelectricalilluminationsystems.ThesolutiontotheproblemofventilationcanbeentrustedtoNature,totheairflowscreatedbytheexistingairpressuredifferencesamongsev-eralpartsoftheinstallation.Gribble(2009)hassuggestedthattheancientEgyptiansalreadytookadvantageofthepressuredif-ferencescreatedbythetemperaturechangebetweendayandnightinordertoventilatetheconstructionworksoftheirunder-groundtombsandtemples.However,theventilationofanundergroundworkmustbe,gen-erallyspeaking,forced,bothduringtheconstructionandduringtheuseoftheinstallationoncefinalized.Duringtheconstructiontherearecreated‘‘deadend”volumes,blindspaceswheretheaircannotenterinanaturalmanner,andwherethefreshairentrancemustbeguaranteedasthisistheareawhereworkersandma-chinesexecutetheinstallation.Therequiredairflowsarehigh,
asnotonlythebreathingneedsoftheworkersmustbeassured,butalsothecontaminantspresentintheairmustbeadequatelydi-lutedbelowthelevelsestablishedbythelocalregulations.Typicalcontaminantscanbe:blastfumes,exhaustgasesfrommotorsandfloatingdust.Oncetheopeningisexcavatedandstabilized,ithastobeguar-anteedthattheusersoftheundergroundspacecanpassthroughitinasafemanner,whichmeansthataproperrenovationoftheairhastobedonetomaintainairqualitylevelsunderthevaluesper-mittedbytheregulationsofeachcountry.Theaircontributionfromtheoutsidehastobecalculatedinordertoguaranteethefreshairpresenceinbothstandardoperationalcircumstancesandexceptionalemergenciesoraccidents.Forexample,incaseofaroadtunneltherequiredairtodilutevehiclesexhaustgaseshastobecalculated,aswellastherequiredflowsneededintheeventofanaccidentfollowedbyafire.Theforcedairflowwillbecreatedbyafanorgroupoffans.Theirselectionandcalculationwillbedeterminedbytwofactors:theairflowthattheymustprovideandtheheadlossesthattheymustovercome.The‘‘wind”thatthesemachinescreatewillslipoverthewallsoftheinstallationgeneratingenergylossesso-called‘‘headlosses”or‘‘aerolicresistance”.Thedeterminationoftheheadlosseshasbeendoneinseveralways,butalwaysstartingfromempiricalformulationsthatrelatethegeometricalandsurfacecharacteristicsoftheelementsthattheairtouches.Theundergroundventilationstudiesdividethecomplexairvol-umes,composedbymultiplegalleriesorbranches,insectionswiththesameaerodynamiccharacteristics,assigneachsectionanairresistanceandsolvetheobtainedcircuitsthroughnetworkmethodssuchasHardy-Cross.Thereisspecificsoftwareas
0886-7798/$-seefrontmatterÓ2010ElsevierLtd.Allrightsreserved.doi:10.1016/j.tust.2010.08.002
⇑Correspondingauthor.Address:OviedoSchoolofMines,C/Independencia13,
33004Oviedo,Spain.Tel.:+34696155597;fax:+34985104245.E-mailaddress:diegoisidro@uniovi.es(I.Diego).
TunnellingandUndergroundSpaceTechnologyxxx(2010)xxx–xxxContentslistsavailableatScienceDirectTunnellingandUndergroundSpaceTechnology
journalhomepage:www.elsevier.com/locate/tust
Pleasecitethisarticleinpressas:Diego,I.,etal.ApracticaluseofCFDforventilationofundergroundworks.Tunnel.Underg.SpaceTechnol.(2010),doi:10.1016/j.tust.2010.08.002