Financial Analysis Excel Templates 企业估值模板-fcfe3st
- 格式:xls
- 大小:42.00 KB
- 文档页数:16
B 部分应用B部分介绍了大量的应用,介绍方式是按照先概述理论,然后介绍这些理论在金融模型中的应用。
每个模型都遵循A部分介绍的设计步骤,以便提供学习和进一步发展的模板。
B部分的章节安排如下:6 业绩分析7 现金流8 预测模型9 财务预测10 方差分析11 收支平衡分析12 投资组合分析13 资本成本14 债券15 投资分析16 风险分析17 折旧18 租赁19 公司评估20 最优化21 决策树22 风险管理23 模型一览表第6章:业绩分析本章介绍用于考察公司经营业绩与理解财务信息的模型.我们从对公众公开的公司年度财务报告开始,这些年度报告包括:·董事会报告——前一会计时期经营状况的定性报告·审计报告—关于经营业绩的第三方报告·损益表—标示收益和成本状况的报表·资产负债表—标示公司资产与所欠银行、政府债务的简要报表·现金流量表—标示由于经营活动或其他原因所产生的现金流以及现金的使用情况·账目附注—根据英国公司法或海外公司法的要求,对上述报表所做出的细节解释。
报表的细节取决于公司所在地的相关公司管理法律要求。
私人公司(股权不公开)往往只能提供很少的经营信息。
在英国的确存在减少信息披露的倾向,甚至第三方的审计报告都可以免除。
公司制定年度报告和账目所依据的会计标准、会计惯例也必须在会计报告中进行详细说明。
会计标准与会计惯例十分重要,因为由于会计标准的不同,不同国家不同地区的公司之间往往很难进行比较。
例如,会计利润会由于人为延长资产折旧期或者改变存货估价方法而得到增加。
公司业绩分析需要对可以获得的信息进行标准化处理,原始数据只有经过标准化处理才能提供关于公司经营业绩的有效信息。
公司业绩分析师需要站在全行业的角度评审公司业绩,股东需要了解他们的投资是否安全并且能够得到增值,其他一些股东可能还想获得关于组织发展方面的更多信息。
然而,信息往往被分散于报表的各个部分,例如,资产负债表中往往都有应收账款(accounts receivable)总额或存货(inventory)总额项目,但所有关于这些账目的细节说明都在报告背后予以标注。
如何使用Excel进行商业模型和估值分析章节一:引言Excel作为一种强大的电子表格软件,被广泛应用于商业模型和估值分析。
凭借其灵活性和便捷性,Excel能够帮助商业分析师和金融专业人士快速建立和评估各种商业模型和估值方法。
本文将介绍如何使用Excel进行商业模型和估值分析的基本步骤和技巧。
章节二:商业模型分析商业模型分析是对一个企业或项目的商业模式进行深入研究和评估,以了解其盈利能力和可持续性。
在Excel中进行商业模型分析时,可以使用以下几个关键步骤:1. 定义商业模型的关键指标:首先,需要确定商业模型中的关键指标,如收入、成本、利润等。
这些指标将用于构建模型和进行分析。
2. 数据收集和整理:收集所需的数据,包括历史财务数据、市场数据和行业数据等。
利用Excel的数据整理和清洗功能,将数据整理成可用于分析的格式。
3. 构建商业模型:将收集到的数据输入Excel中,使用Excel的数学公式和函数构建商业模型。
根据不同的商业模型类型(如市场份额模型、增长模型等),选择合适的公式和函数进行计算。
4. 敏感性分析:利用Excel的数据表和图表功能,进行敏感性分析。
根据不同的假设和预测,调整模型中的关键指标,观察其对结果的影响,评估商业模型的风险和不确定性。
章节三:估值分析估值分析是对一个企业或项目的价值进行评估和决策的过程。
在Excel中进行估值分析时,可以使用以下几个关键步骤:1. 确定估值方法:根据估值对象和需求,选择合适的估值方法,如贴现现金流量法、相对估值法等。
每种估值方法都有其特定的计算公式和假设。
2. 整理财务数据:整理估值所需的财务数据,如收入、成本、现金流量等。
根据所选的估值方法,计算相应的指标和变量。
3. 计算估值:根据所选的估值方法和计算公式,利用Excel构建相应的模型,计算估值结果。
在计算过程中,可以使用Excel的数据表和图表功能,方便地观察各项指标和变量的变化与关系。
4. 灵敏度分析:通过调整关键指标和假设,进行灵敏度分析。
财务估值研究报告模板财务估值研究报告模板1.背景介绍:说明为什么选择该企业进行财务估值研究,包括企业的行业背景、市场地位和竞争优势等。
2.财务分析:对企业的财务状况进行详细分析,并重点关注以下指标: 资产负债表、利润表和现金流量表。
通过这些指标的分析,了解企业的盈利能力、偿债能力和运营能力,并评估企业的风险程度。
3.财务比率分析:利用财务比率,比如利润率、净利润率、资产周转率、股东权益比率等,对企业的财务状况进行评估。
同时,与行业平均水平进行比较,了解企业在行业中的竞争力。
4.财务预测:基于过去的财务数据和行业趋势,对企业未来的财务状况进行预测。
可以使用不同的方法,如DCF (Discounted Cash Flow)或 P/E (Price/Earnings) 方法进行估值预测。
5.可比公司分析:参考行业内其他公司的财务数据和估值,与目标企业进行比较,找出相似性和差异性,并评估目标企业的相对优势和劣势。
6.风险分析:对企业可能面临的风险进行分析,包括市场风险、财务风险、行业风险和经营风险等。
通过识别和评估这些风险,可以更准确地估值企业。
7.结论和建议:根据对企业的财务状况和估值分析,得出结论并提出相应的建议。
此部分应包含对企业未来发展的展望和对投资者的建议。
8.风险披露:在报告的最后,应对本报告的风险予以披露,包括分析方法的局限性、数据的可靠性、行业趋势的不确定性等,以提醒读者注意。
总结:以上是一个财务估值研究报告的模板,可以根据具体情况进行调整和补充。
在撰写报告时,应注意分析方法的合理性和数据的准确性,提高研究报告的可信度。
新会计准则DCF估值和DDM估值模版DCF(Discounted Cash Flow)估值方法和DDM(Dividend Discount Model)估值方法是企业价值评估中常用的两种模型。
下面将为您介绍这两种模型的基本原理和具体的估值模板。
一、DCF估值方法:DCF估值方法是一种基于现金流量的评估模型,它用于确定企业的内在价值。
该模型认为,未来现金流量的净现值是企业的真实价值。
DCF估值的基本原理:1.预测未来现金流量:确定未来一段时间内公司将产生的现金流量,包括经营活动产生的净现金流量和投资活动产生的净现金流量。
2.估计终值:根据公司预期长期发展情况,对未来其中一时点后的最后一年现金流进行估值。
3.求现值:对上述预测的现金流量进行贴现计算。
DCF估值方法的模板:1.确定预测期:通常选择3-5年的预测期。
2.预测未来现金流量:根据公司的历史财务数据和行业趋势,制定合理的现金流量预测模型,包括利润表、现金流量表和资产负债表的预测。
3.估计终值:根据预测期后的成长情况,计算未来其中一时点后的最后一年现金流的增长率。
4.确定折现率:折现率是根据投资风险的大小来确定的,可以使用加权平均资本成本(WACC)来估计。
得到公司的总现金流现值。
6.计算终值:将预测期后的最后一年现金流使用估计的终值增长率进行估值计算。
7.计算净现值:将总现金流现值和终值进行相加,再减去投资的初始现金流量,得到DCF估值结果。
二、DDM估值方法:DDM估值方法是一种基于股息分红的评估模型,它用于确定股票的内在价值。
该模型认为,股票的价值取决于未来分红的现值。
DDM估值的基本原理:1.预测未来分红:确定未来一段时间内公司预计分红的现金流量。
2.估计终值:根据公司预期长期发展情况,对未来其中一时点后的最后一年分红进行估值。
3.求现值:对上述预测的分红现金流进行贴现计算。
DDM估值方法的模板:1.确定预测期:通常选择3-5年的预测期。
浅析企业价值评估的FCFE模型⽅法2019-05-31价值最⼤化是现代企业的基本⽬标之⼀,⽽如何进⾏价值评估不仅受到企业管理者的重视,也是⼴⼤投资者最为关⼼的问题,甚⾄是政府部门最关⼼的实际问题。
价值评估是在⼀定条件的假设下,运⽤⾦融、财务理论和相关的模型、⽅法,评估出企业的内在价值并分析市场的有效性状况,并找到投资可期望的收益率及投资的时机等。
在全球经济⾦融化形势下,企业价值评估已成为企业理财不可或缺的⼀项重要⼯作。
⽬前,企业价值评估已成为企业投资决策、融资决策、兼并收购、价值管理、以及各种政策制定的重要⼯具,在提⾼企业决策管理效率、防范投资风险等⽅⾯起到了⾮常重要的作⽤。
本⽂拟对上市企业的价值评估⽅法进⾏初步探讨。
⼀、股权⾃由现⾦流的概述美国学者Franco Modigliani 和Mertor Miller 于1961年⾸次提出⽤现⾦流对企业价值进⾏分析,他们认为⾃由现⾦流量等于经营活动产⽣的现⾦净流量和投资活动产⽣的现⾦净流量之和。
业界和学界对现⾦流研究的重视的直接原因是发⽣在1975年的美国W.T.Grant企业破产事件。
20世纪80年代,美国西北⼤学的Alfred Rappaport,哈佛⼤学的Michael Jensen等⼈提出了⾃由现⾦流的概念。
他们认为,⾃由现⾦流是企业产⽣的,满⾜了企业再投资需要之后、不影响企业持续发展的情况下,可供分配给包括股东和债权⼈的企业资本供应者的现⾦流。
与衡量会计利润时采⽤权责发⽣制不同,在衡量⾃由现⾦流时采⽤收付实现制,这样可以避免不同企业因采⽤不同的折旧、各项摊销等会计处理不同⽽出现较⼤差异。
⾃由现⾦流量的信息包含了企业损益表、资产负债表、现⾦流量表的相关信息,从⽽可以对企业整体情况进⾏更加综合的考虑,因此更适合⽤于评估企业价值。
股权⾃由现⾦流(Free Cash Flow to Equity,FCFE)是指企业股权拥有者(股东)可分配的最⼤⾃由现⾦额。
新会计准则DCF估值和DDM估值模版DCF估值和DDM估值是企业价值评估的两种常用方法。
DCF估值(Discounted Cash Flow Valuation)是一种基于现金流折现的方法,而DDM估值(Dividend Discount Model)则是一种基于股息折现的方法。
下面是它们的模版的详细解析。
一、DCF估值模版DCF估值是一种基于企业未来现金流的估值方法。
该模型通过将企业未来一定时期的现金流折现到现值,然后再加上终值来计算企业的价值。
以下是DCF估值模版的详细解析:1.确定预测时期:首先,需要确定预测的时期,通常可以选择3-5年作为预测时期。
2.预测未来现金流:根据企业的历史财务数据和经济环境,预测未来时期的现金流。
可以使用各种财务指标和比率来辅助预测。
3.确定折现率:折现率是用于将未来的现金流转化为现值的参数。
一般可以使用企业的加权平均资本成本(WACC)作为折现率,也可以根据其他市场数据来确定。
4.折现未来现金流:使用折现率将预测的未来现金流折现到现值,得到每年的现值。
5.计算终值:终值是预测时期之后企业的剩余价值,可以根据企业预期的长期增长率来计算。
6.得到现金流总和:将每年的现值加总,再加上终值,得到企业的现金流总和。
7.计算净债务:根据企业的财务报表计算净债务。
8.减去净债务:将净债务从现金流总和中减去,得到企业的净现金流总和。
9.得到企业的价值:将净现金流总和加上现金及现金等价物等其他资产,再减去企业的净债务,就可以得到企业的价值。
DDM估值是一种基于股息折现的方法,适用于股息分红稳定的企业。
以下是DDM估值模版的详细解析:1.确定预测时期:与DCF估值相同,需要确定预测的时期,通常可以选择3-5年作为预测时期。
2.预测未来股息:根据企业的历史股息支付情况和经济环境,预测未来时期的股息。
3.确定折现率:折现率同样也是一个重要的参数。
在DDM估值模型中,一般使用股东要求的报酬率(也称为股息折现率)作为折现率。
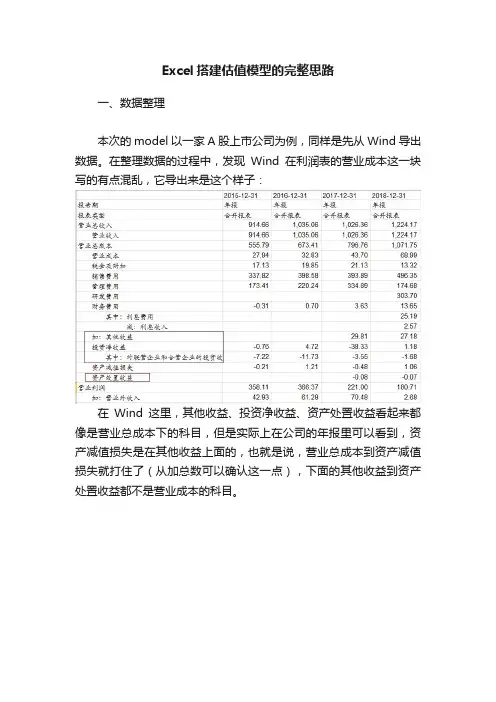
Excel搭建估值模型的完整思路一、数据整理本次的model以一家A股上市公司为例,同样是先从Wind导出数据。
在整理数据的过程中,发现Wind在利润表的营业成本这一块写的有点混乱,它导出来是这个样子:在Wind这里,其他收益、投资净收益、资产处置收益看起来都像是营业总成本下的科目,但是实际上在公司的年报里可以看到,资产减值损失是在其他收益上面的,也就是说,营业总成本到资产减值损失就打住了(从加总数可以确认这一点),下面的其他收益到资产处置收益都不是营业成本的科目。
换句话说,从资产减值损失(非经常性的)、其他收益到资产处置收益,甚至到再下面的营业外收入、营业外支出,这些都是和经常性/经营性活动无关的。
之前我总觉得要把报表的信息都保留下来,所以不会轻易地合并科目,但是现在认为,大道至简,像这里提到的这些非经常性、非经营性收益,在做预测的时候我们也是预测不了的,所以不合并科目与合并科目的就变成了瞎拍很多次和瞎拍一次的区别。
那这样为了我们自己简单,还不如把这堆科目全部合并成一个“非经常性/非经营性收益”。
同时,由于“营业利润”这一项上面的那几个和下面的营业外收支,算是跨越了“营业利润”这一项,所以这个表里也不太好再保留“营业利润”这个科目了,考虑就用EBIT(息税前利润)取而代之,EBIT这个指标对于估值也更有意义。
所以经过这一番调整,表格就变成了下面这样,橙色框的科目都没有动,红色框的财务费用挪了位置,而蓝色框的科目全部合并成了“非经常性/非经营性损益”另外,在归母净利润后,加了一行分红,这里需要注意,公司的分红不会在当年的年报中体现,比如说,2016年归母净利润是368.8(百万元),分红是72.2,但是这个72.2的分红是2017年4月公告,5月发放的,所以分红对报表的影响其实延后了一年。
但是按照权责发生制,这笔分红还是应该算是2016年的。
最下面的其他综合收益,在资产负债表中也会有这个名称的科目,但是这两项还是不一样的,毕竟一个是流量,一个是存量,这两个数往往也不一样,而且这个科目的变动一般是投资性的资产导致的,所以预测起来也不靠谱,干脆就把利润表这儿的删了(这个数不会影响到配平,也不影响当年的利润),而资产负债表权益部分的另外预测就好。
Three-stage FCFE ModelTHREE-STAGE FCFE DISCOUNT MODELThis model is designed to value the equity in a firm with three stages of growthperiod of high growth, a transition period of declining growth and a final period of stablegrowth.
Assumptions1. The firm is assumed to be in an extraordinary growth phase currently.2. This extraordinary growth is expected to last for an initial period that has to be specified.3. The growth rate declines linearly over the transition period to a stable growth rate.4. The relationship between capital spending and depreciation changes consistently with the growth rate.
The user should enter the following inputs:1. Length of each growth phase2. Growth rate in each growth phase3. Capital Spending, Depreciation and Working Capital in each growth phase.4. Costs of Equity in each growth phase
Page 1 Three-stage FCFE ModelInputs to the modelGeneral InputsCurrent Earnings per share =$0.85(in currency)Current Dividends per share =(in currency)Current Capital Spending/sh =$1.00(in currency)Current Depreciation / share =$0.80(in currency)Current Revenues/ share =$12.50
Working Capital/ share =$5.00(in currency)Chg. Working Capital/share =$0.50
Do you want to enter cost of equity directly?No(Yes or No)If yes, enter the cost of equity =(in percent)If no, enter the inputs to the cost of equity for the initial high growth stageBeta of the stock =1.1Riskfree rate=7.00%(in percent)Risk Premium=5.50%(in percent)
Earnings InputsGrowth Rate during the initial high growth phaseEnter length of extraordinary growth period =5(in years)
Do you want to use the historical growth rate?No(Yes or No)If yes, enter EPS from five years ago =$0.90(in currency)
Do you have an outside estimate of growth ?Yes(Yes or No)If yes, enter the estimated growth:20.00%(in percent)
Do you want to calculate the growth rate from fundamentals?No(Yes or No)If yes, enter the following inputs:Net Income Currently =$10.00(in currency)Interest Expense Currently =$2.50Last year(in currency)Book Value of Debt =$16.10$15.20(in currency)Book Value of Equity =$29.50$28.10(in currency)
Page 2 Three-stage FCFE ModelTax Rate on Income=45.00%(in percent)The following will be the inputs to the fundamental growth formulation:ROC =26.27%D/E =54.58%(in percent)Retention =100.00%Interest Rate=15.53%(in percent)Do you want to change any of these inputs for the high growth period?No(Yes or No)If yes, specify the values for these inputs (Please enter all variables)ROC =25.00%D/E =54.58%(in percent)Retention =100.00%Interest Rate=15.53%(in percent)Do you want to change any of these inputs for the stable growth period?Yes(Yes or No)If yes, specify the values for these inputsROC =20.00%D/E =54.58%(in percent)Interest Rate=14.00%(in percent)
Page 3 Three-stage FCFE ModelSpecify weights to be assigned to each of these growth rates:Historical Growth Rate =(in percent)Outside Prediction of Growth =100.00%(in percent)Fundamental Estimate of Growth =(in percent)
Growth Rate during the transition periodEnter length of the transition period =10(in years)
Do you want the beta to adjust gradually to stable beta?Yes(Yes or No)If no, enter the beta for the transition period =
Growth Rate during the stable phaseEnter growth rate in stable growth period?5.00%(in percent)
Will the beta change in the stable period?Yes(Yes or No)If yes, enter the beta for stable period =0.9
Capital Spending, Depreciation & Working CapitalDo you want all these items to grow at the same rate as earnings ?Yes(Yes or No)If not, enter the growth rates for each of the following items:Capital SpendingDepreciationRevenuesHigh Growth20.00%20.00%18.00%(in percent)Transition period12.00%12.00%12.00%(in percent)Stable GrowthDo not enterDo not enter6.00%(in percent)
Do you want to keep the current fraction of working capital to revenues?Yes(Yes or No)If no, specify working capital as a percent of revenues:(in percent)
Do you want to use the current debt ratio as your desired mix?No(Yes or No)If no, enter the following inputs for financing mix,Desired debt financing proportion - Capital Spending15.00%(in percent)Desired debt financing proportion - Working Capital 15.00%(in percent)
Page 4