(完整版)电气工程毕业设计外文资料翻译
- 格式:doc
- 大小:106.00 KB
- 文档页数:29

附录1:外文资料翻译A1.1外文资料题目26.22 接地故障电路开关我们目前为止报道的接地方法通常是充分的, 但更加进一步的安全措施在某些情况下是必要的。
假设例如, 有人将他的手指伸进灯口(如Fig.26.45示)。
虽然金属封入物安全地接地, 但那人仍将受到痛苦的震动。
或假设1个120V 的电炉掉入游泳池。
发热设备和联络装置将导致电流流入在水池中的危害,即使电路的外壳被安全地接地,现在已经发展为当这样的事件发生时,设备的电源将被切断。
如果接地电流超过5mA ,接地开关将在5 ms 内跳掉,这些装置怎么运行的?如Fig.26.46所示,一台小变流器缠绕上导线 ,第二步是要连接到可能触发开合120 V 线的一台敏感电子探测器。
在正常情况下流过导体的电流W I 与中性点上的电流N I 准切的相等,因此流经核心的净潮流(N W I I -)是零。
结果,在核心没有产生电流,导致的电压F E 为零,并且开关CB 没有动作。
假设如果某人接触了一个终端(图Fig.26.45示),故障电流F I 将直接地从载电线漏到地面,这是可能发生的。
如果绝缘材料在马达和它的地面封入物之间断开,故障电流也会被产生。
在以下任何情况下,流经CT 的孔的净潮流等于F I 或L I ,不再是零。
电流被产生,并且产生了可以控制CB 开关的电压F E 。
由于5 mA 不平衡状态只必须被检测出,变压器的核心一定是非常有渗透性的在低通量密度。
Supermalloy 是最为常用的,因为它有相对渗透性典型地70000在通量密度仅4mT 。
26.23 t I 2是导体迅速发热的因素它有时发生于导体短期内电流远大于正常值的情况下,R I 2损失非常大并且导体的温度可以在数秒内上升几百度。
例如,当发生严重短路时,在保险丝或开关作用之前,会有很大的电流流过导体和电缆。
此外,热量没有时间被消散到周围,因此导体的温度非常迅速地增加。
在这些情况下什么是温度上升? 假设导体有大量m ,电阻R 和热量热容量c 。
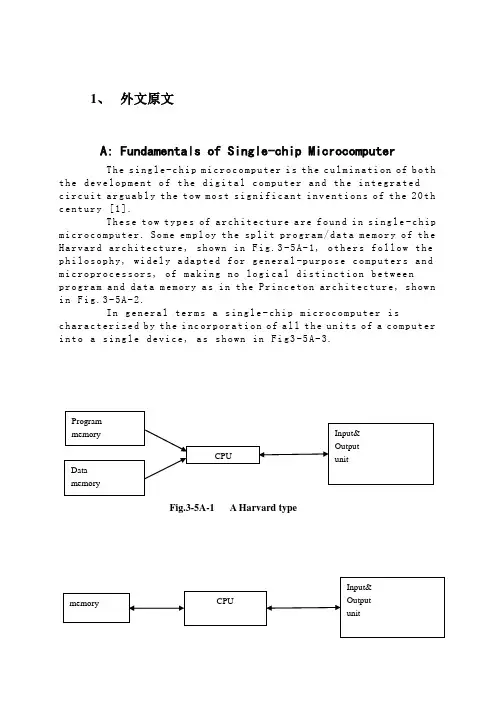
1、外文原文A: Fundamentals of Single-chip MicrocomputerTh e si ng le-c hi p m ic ro co mp ut er i s t he c ul mi na ti on of b oth t h e de ve lo pm en t o f t he d ig it al co m pu te r an d th e i n te gr at edc i rc ui t a rg ua bl y t h e to w m os t s ig ni f ic an t i nv en ti on s o f t he20th c e nt ur y [1].Th es e t ow ty pe s of ar ch it ec tu re a re fo un d i n s in g le-c hip m i cr oc om pu te r. So m e em pl oy t he spl i t pr og ra m/da ta m e mo ry o f th e H a rv ar d ar ch it ect u re, sh ow n in Fi g.3-5A-1, o th ers fo ll ow t he p h il os op hy, wi del y a da pt ed f or ge n er al-p ur po se co m pu te rs a nd m i cr op ro ce ss o r s, o f ma ki ng n o log i ca l di st in ct ion be tw ee np r og ra m an d d at a m e mo ry a s i n t he P r in ce to n ar ch ite c tu re, sh ow n i n F ig.3-5A-2.In g en er al te r ms a s in gl e-chi p m ic ro co mp ut er i sc h ar ac te ri zed b y t he i nc or po ra ti on of a ll t he un it s of a co mp ut er i n to a s in gl e d ev i ce, as s ho wn in Fi g3-5A-3.Fig.3-5A-1 A Harvard typeFig.3-5A-2. A conventional Princeton computerFig3-5A-3. Principal features of a microcomputerRead only memory (ROM).R OM i s us ua ll y f or th e p e rm an en t,n o n-vo la ti le s tor a ge o f an a pp lic a ti on s pr og ra m .M an ym i cr oc om pu te rs an d m ar e in te nd e d f or hi gh-v ol um e a p pl ic at io ns a n d he nc e t h e eco n om ic al m an uf act u re o f th e de vic e s re qu ir es t h at t he co nt en t s o f t he pr og ra m me m or y b e co mm it t ed pe rm a ne nt ly d u ri ng t he m an ufa c tu re o f ch ip s .Cl ea rl y, t hi s i m pl ie s ar i go ro us a pp ro ach to R OM c od e de ve l op me nt s in ce ch a ng es c an no t b e m ad e af te r m anu f a c tu re .Th is d ev e lo pm en t pr oc ess ma y in vo lv e e m ul at io n us in g a so ph is ti ca te d d e ve lo pm en t sy ste m w it h ah a rd wa re e mu la tio n c ap ab il it y as w el l as t he u se o f po we rf ul s o ft wa re t oo ls.So me m an uf act u re rs p ro vi de ad d it io na l RO M opt i on s byi n cl ud in g i n th eir r a n ge d ev ic es wi t h (or i nt en de d f o r u se w it h) u s er p ro gr am ma ble me mo ry. Th e sim p le st o f th es e i s u su al lyd e vi ce w hi ch c an o p er at e in a mi cro p ro ce ss or m od e b y u si ng s om e o f t he i np ut/o utp u t li ne s as a n a d dr es s an d da ta b us f ora c ce ss in g ex te rna l m em or y. T hi s t y pe o f de vi ce ca nb eh av ef u nc ti on al ly a s t h e si ng le ch ip mi cr oc om pu te r fro m w hi ch it is d e ri ve d al be it wi t h re st ri ct ed I/O a nd a m od if ied ex te rn alc i rc ui t. Th e u se o f th es ed ev ic es i s c om mo ne ve n i n pr od uc ti on c i rc ui ts wh er e t he vo lu me do es no t j us tif y t h e d ev el o pm en t c os ts o f c us to m o n-ch i p R OM[2];t he re c a n s ti ll be a s ig nif i ca nt sa vi ng i n I/O an d o th er c h ip s c om pa re d t o a co nv en ti on al mi c ro pr oc es so r b a se d ci rc ui t. Mo r e ex ac t re pl ace m en t fo r RO M dev i ce s ca n be o b ta in ed i n th e f o rm o f va ri an ts w it h 'p ig gy-b ack'E P RO M(Er as ab le pr o gr am ma bl e RO M )s oc ke ts o r d ev ic e s wi th EP RO M i n st ea d o f RO M 。

电气与信息学院自动化专业毕业设计(论文)外文翻译Electonic power steering system Research andDesign电子动力转向系统的研究与设计注:本毕业设计(论文)外文翻译文档前半部分为英文部分,后半部分为中文部分。
本外文翻译由专业人员翻译,内容详细数据全面,得到导师的一致好评。
值得大家借鉴参考。
本文档下载后为WORD版本,可按需直接编辑。
Electronic power steering systemWhat it isElectrically powered steering uses an electric motor to drive either the power steering is therefore independent of engine speed, resulting in significant energy savings.How it works :Conventional power steering systems use an engine accessory belt to drive the pump, providing pressurized fluid that operates a piston in the power steering gear or actuator to assist the driver.In electro- by an electric motor. Pump speed is regulated by an electric controller to vary pump pressure and flow, providing steering efforts tailored for different driving situations. The pump can be run at low speed or shut off to provide energy savings during straight ahead driving (which is most of the time in most world markets).Direct electric steering uses an electric motor attached to the steering rack via a gear mechanism (no pump or fluid). A variety of motor types and gear drives is possible. A microprocessor controls steering dynamics and driver effort. Inputs include vehicle speed and steering, wheel torque, angular position and turning rate.Working In Detail:A "steering sensor" is located on the input shaft where it enters the gearbox one: a "torque sensor" that converts steering torque input and its direction into voltage signals, and a "rotation sensor" that converts the rotation speed and direction into voltage signals. An "interface" circuit that shares the same sensor into signals the control electronics can process.Inputs from the steering sensor are digested by a microprocessor control unit that also monitors input from the vehicle's speed sensor. The sensor inputs are then compared to determine the control unit's memory. The control unit then sends out the appropriate command to the "power unit" which then supplies the electric motor with current. The motor pushes the rack to the right or left depending on which way the voltage flows (reversing the current reverses the direction the motor spins). Increasing the current to the motor increases the amount of power assist.The system which left or right power assist is provided in response to input from the steering torque and rotation sensor's inputs; a "return" control mode which is used to assist steering return after completing a turn; and a "damper" control mode that changes with vehicle speed to improve road feel and dampen kickback.If the steering wheel is turned and the full-lock position and steering assist reaches a maximum, the control unit reduces current to the electric motor to prevent an overload situation that might damage the motor. Thecontrol unit is also designed to protect the motor against voltage surges from a faulty alternator or charging problem.The electronic steering control unit is capable of self-diagnosing faults by monitoring the system's inputs and outputs, and the driving current of the electric motor. If a problem occurs, the control unit turns the system off by actuating a fail-safe relay in the power unit. This eliminates all power assist, causing the system to revert back to manual steering. A dash EPS warning light is also illuminated to alert the driver. To diagnose the problem, a technician jumps the terminals on the service check connector and reads out the trouble codes.click , fuel savings and package flexibility, at no cost penalty.Europe's a short time, electric steering will make it to the U.S., too. "It's just just a matter of time," says Aly Badawy, director of research and development for Delphi Saginaw Steering Systems in Saginaw, Mich. "The issue was cost and that's behind us now. By 2002 the U.S. the cost of electric power steering will absolutely be a wash over for electric steering. But by 2010, a TRW Inc. internal study estimates that one out of every three cars produced in the world will be equipped with some form ofelectrically-assisted steering. The Cleveland-based supplier claims its new steering systems could improve fuel economy by up to 2 mpg, while enhancing be run off a laptop computer. "They can take that computer and plug it in, attach it to the controller and change all the the fly," Badawy says. "It used to take months." Delphi in '99.Electric steering units are normally placed in one of three positions: column-drive, pinion-drive and rack-drive. Which system will become the norm is still unclear. Short term, OEMs will choose the steering system that is easiest to integrate into an existing platform. Obviously, greater potential comes from designing the system into an all-new platform. "We ," says Dr. Herman Strecker, group vice president of steering systems division at ZF in Schwaebisch Gmuend, Germany. "It's up to the market and OEMs which version finally will be used and manufactured." "The large manufacturers Sterling Heights, Mich. His company offers a portfolio of electric steering systems (-, and column-drive). TRW originally concentrated on what it still believes is the purest engineering solution for electric steering--the rack-drive system. The system is sometimes refer to as direct drive or ballnut drive. Still, this winter TRW in exchange for its electric column-drive steering technology and as sets. Initial production of the column and pinion drive electric steering systems is expected to begin in Birmingham, England, in 2000."What we lack is the credibility in the steering market," says Brendan Conner, managing director, TRWLucasVarity Electric Steering Ltd. "The combination with TRW provides us with a good opportunity for us to bridge that gap." LucasVarity currently 11 different vehicle types,mostly European. TRW is currently supplying its EAS systems for Ford and Chrysler EVs in North America and for GM's new Opel Astra.In 1995, according to Delphi, traditional 7596 of all vehicles sold globally. That 37-million vehicle pool consumes about 10 million gallons in relates to an electrically powered drive mechamsm for providing powered assistance to a vehicle steering mechanism. According to one aspect of the present invention, there is provided an electrically powered driven mechanism for providing powered assistance to a vehicle steering mechanism electrically powered drive motor drivingly connected to the rotatable member and a controller which is arranged to control the speed and direction of rotation of the drive motor in response to signals received from the torque sensor, the torque sensor including a sensor shaft adapted for connection to the rotatable member to form an extension thereof so that torque is transmitted through said sensor shaft when the rotatable member is manually rotated and a strain gauge mounted on the sensor shaft for producing a signal indicative of the amount of torque being transmitted through said shaft. Preferably the sensor shaft is non-rotatably mounted at one axial end in a first coupling member and is non-rotatably mounted at its opposite axial end in a second coupling member, the first and second coupling members being inter-engaged to permit limited rotation there between so that torque under a predetermined limit is transmitted by the sensor shaft only and so that torque above said predetermined limit is transmitted through the first and second coupling members. The first and second coupling members are preferably arranged to act as a bridge for drivingly connecting first and second portions of the rotating member toone another. Preferably the sensor shaft is of generally rectangular cross-section throughout the majority of its length. Preferably the strain gauge includes one or more SAW resonators secured to the sensor shaft. Preferably the motor is drivingly connected to the rotatable member via a clutch .Preferably the motor includes a gear box and is concentrically arranged relative to the rotatable member. Various aspects of the present invention will which :Figure 1 is a diagrammatic view of a vehicle steering mechanism including an electrically powered drive mechanism according to the present invention, Figure 2 is a flow diagram illustrating interaction between various components of the drive mechanism shown in Figure 1 ,Figure 3 is an axial section through the drive mechanism shown in Figure 1, Figure 4 is a sectional view taken along lines IV-IV in Figure 3,Figure 5 is a more detailed exploded view of the input drives coupling shown in Figure 3, and Figure 6 is a more detailed exploded view of the clutch showing in Figure 3. Referring initially to Figure 1 , there is shown a vehicle steering mechanism 10 drivingly connected to a pair of steerable road wheels The steering mechanism 10 shown includes a rack and pinion assembly 14 connected to the road wheels 12 via joints 15. The pinion(not shown) of assembly 14 is rotatably driven by a manually rotatable member in the form of a steering column 18 which is manually rotated by a steering wheel 19.The steering column 18 includes an electric powered drive mechanism 30 which includes an electric drive motor (not shown in Figure 1) for driving the pinion in response to torque loadings in the steering column 18 in order to provide power assistance for the operative when rotating the steering wheel 19.As schematically illustratedin Figure 2, the electric powered drive mechanism includes a torque sensor20 which measures the torque applied by the steering column 18 when driving the pinion and supplies a signal to a controller 40. The controller 40 is connected to a drive motor 50 and controls the electric current supplied to the motor 50 to control the amount of torque generated by the motor 50 and the direction of its rotation. The motor 50 is drivingly connected to the steering column 18 preferably via a gear box 60, preferably an epicyclic gear box, and a clutch 70. The clutch 70 is preferably permanently engaged during normal operation and is operative under certain conditions to isolate drive from the motor 50 to enable the pinion to be driven manually through the drive mechanism 30. This is a safety feature to enable the mechanism to function in the event of the motor 50 attempting to drive the steering column too fast andor in the wrong direction or in the case where themotor andor gear box assembly including a short sensor shaft on which is mounted a strain gauge capable of accurately measuring strain in the sensor shaft brought about by the application of torque within a predetermined range. Preferably the predetermined range of torque which is measured is 0-lONm; more preferably is about l-5Nm.Preferably the range of measured torque corresponds to about 0-1000 microstrain and the construction of the sensor shaft is chosen such that a torque of 5Nm will result in a twist of less than 2°in the shaft, more preferably less than 1 °.Preferably the strain gauge is a SAW resonator, a suitable SAW resonator being of axis and at 90° to one another. Preferably the resonators operate with a resonance controller 40 of 1 MHz ±500 KHz dependingupon the direction of rotation of the sensor shaft. Thus, when the sensor shaft is not being twisted due to the absence of torque, it produces a 1 MHz signal. When the sensor shaft is twisted in one direction it produces a signal between 1.0 to 1.5 MHz. When the sensor shaft is twisted in the opposite direction it produces a signal between 1.0 to 0.5 MHz. Thus the same sensor is able to produce a signal indicative of the degree of torque and also the direction of rotation of the sensor shaft. Preferably the amount of torque generated by the motor in response to a measured torque of between 0-10Nm is 0-40Nm and for a measured torque of between l-5Nm is 0-25Nm.Preferably a feed back circuit is provided whereby the electric current being used by the motor is measured and compared by the controller 40 to ensure that the motor is running in the correct direction and providing the desired amount of power assistance. Preferably the controller acts to reduce the measured torque to zero and so controls the motor to increase its torque output to reduce the measured torque. A vehicle speed sensor (not shown) is preferably provided which sends a signal indicative of vehicle speed to the controller. The controller uses this signal to modify the degree of power assistance provided in response to the measured torque. Thus at low vehicle speeds maximum power assistance will be provided and a software and so is able to function more reliably in a car vehicle environment. It is envisaged that a logic sequence not be as . Automobile traffic in the actual process, at the time to about 5 percent of the time travelling, the HPS system, engine running, the pumps will always be in working condition, the oil pipeline in circulation, so that vehicle fuelconsumption rate by 4 % To 6%, while EPS only when needed for energy, vehicle fuel consumption rates only increased by 0.5 percent.3) "Road sense of" good. Because EPS internal use of rigid, system of the lag can be controlled by software, and can be used in accordance with the operation of the driver to adjust.4) back to being good. EPS simple structure of small internal resistance, is a good back, get back to being the best characteristics, improve vehicle . HPS the not be recovered, the environmental pollution are to a certain extent, while EPS almost no pollution to the environment.6) can be independent of the engines work. EPS for battery powered devices, as long as sufficient battery power, no matter what the condition for the engine, can produce power role.7) should using electric power steering gear, the car of the economy, power and mobility the car is a new power steering system device, developed rapidly in recent years both at the same time there are also potential safety problems. In the analysis This unique product on the basis of the author of the characteristics of electronic control devices, security clearance just that the factors that deal with security measures, and discussed a number of concerns the safety of specific issues. The results show that : Existing standards can not meet the electric power steering device security needs and made the electric power steering device safety evaluation of the idea. Research work on the electric power steering device development and evaluation of reference value.电子动力转向系统图1电子动力转向系统的工作原理:电子动力转向系统是通过一个电动机来驱动动力方向盘液压泵或直接驱动转向联动装置。
毕业设计(论文)外文资料翻译附件1 :外文资料翻译译文双闭环直流调速系统的说明一、系统分析与综合1. 系统分析(1)在转速、电流双闭环调速系统中,若要改变电动机的转速,应调节什么参数?改变转速调节器的放大倍数Kn行不行?改变电力电子变换器的放大系数Ks 行不行?改变转速反馈系数行不行?若要改变电动机的堵转电流,应调节系统中的什么参数?答:若要改变电动机的转速,改变转速调节器的放大倍数Kn 和电力电子变换器的放大系数Ks 都不行,稳定时n=Un=Un*,所以只有改变给定值Un*和反馈系数才行。
若要改变电动机的堵转电流,同样只须改变给定值Uim*和反馈系数,因为,稳定时,Uim* = Idm, 从式中可得出。
(2)转速、电流双闭环调速系统稳态运行时,两个调节器的输入偏差电压和输出电压各是多少?答:转速、电流双闭环调速系统稳态运行时,两个调节器的输入偏差电压均是零,由式子n=Un=Un*,n=n0 ; Uim* = Idm, Idm=Idl 。
(3)在转速、电流双闭环调速系统中,两个调节器均采用PI 调节器。
当系统带额定负载运行时,转速反馈线突然断线,系统重新进入稳态后,电流调节器的输入偏差电压Ui 是否为零?为什么?答:当系统带额定负载运行时,转速反馈线突然断线,则Un=0,Un =Un*-Un=Un*, 使Ui 迅速达到Uim ,Ui 0 ,速度n 上升,当系统重新进入稳态后,即Id=Idl ,那么,Ui = Uim*- Idl 0,Ui 也不再变化,转速n也不再变化,但,此时的转速n 比反馈线断线时的转速要大。
(4)为什么用积分控制的调速系统是无静差的?答:在积分调节器的调速系统中,能实现无静差,是由于积分调节器控制特点,即积分的记忆和积累作用。
(5)双环调速系统(PI),负载变化,Idl>Idm, 问双环调速系统ACR和ASR 怎么调节,结果如何?答:当负载变化时,Idl>Idm, 转速迅速下降,电流Id 很快增加到Idm,而达限幅值,速度ASR迅速饱和,ACR一直在限流状态下,形成堵转现象,长时间运行会损坏系统。
毕业设计(论文)外文资料翻译学院:电气信息学院专业:电气工程及其自动化姓名:郭骥翔学号: 081001227外文出处: Adaptive torque control of variable speedwind turbines 附件: 1.外文资料翻译译文;2.外文原文。
指导教师评语:签名:年月日(用外文写)附件1:外文资料翻译译文多种风力涡轮机的适应性转矩控制4.5 使用SymDyn进行仿真所有先前所描述的模拟是使用SimInt来演示的,其中,如前所述,包括唯一的转子角速度自由度,与复杂的仿真工具比,如SymDyn和FAST,他能够更快的运行。
然而,为了确认目的,与其他更流行的仿真工具比较SimInt在适应运行上的增益是很有价值的。
适应性的增加并不是期望它能够同等的适应每一个仿真工具,因为每个仿真工具都有其独到的涡轮机模型。
但是如果每个涡轮机的造型都相同,如同本例,那么在SimInt 和SymDyn中则有着基本相似的适应性增益(CART)。
在数据4-10中,这种相似性被明显的显示出来。
SimInt和SymDyn仿真工具都是由零时刻开始,而且大多数参数初值都相同,如M,角速度等。
然而,尽管这两个涡轮机模型都设立了最佳转矩控制M*,但是CP表面却有着不同程度的峰值。
因此为了使初始过程大致相同,初始Pfavg值应有相同的最大比例,而不是相同的绝对值。
在显示标准化M值4-10的上图中,显示了合理的类似数据。
但在30到60小时后,仿真工具的适应性增益开始出现分歧。
但在此之后,他们再次互相接近,在从模拟开始100小时到模拟结束这段时间,他们保持基本重合。
从下图中也可以清楚的观察出,每个仿真工具都在调整他们的增益M,并采集最大输出功率。
尽管SimInt仿真速度差不多是SymDyn仿真速度的五倍,在图4-10中所显示的SymDyn 数据是唯一一个可以验证适应性增益法则的模拟工具。
在这个展示了两个模拟工具合理的相同之处的实验后,验证了SimInt可以作为测试增益法则的实验的仿真工具。
附录A:英文参考文献及其翻译Direct torque controlDirect torque control(DTC) is one method used in variable frequency drives to control the torque (and thus finally the speed) of three-phaseAC electric motors. This involves calculating an estimate of the motor's magnetic flux and torque based on the measured voltage and current of the motor. MethodStatorflux linkage is estimated by integrating the stator voltages. Torque is estimated as a cross product of estimated stator flux linkagevector and measured motor currentvector. The estimated flux magnitude and torque are then compared with their reference values. If either the estimated flux or torque deviates from the reference more than allowed tolerance, the transistors of the variable frequency drive are turned off and on in such a way that the flux and torque will return in their tolerance bands as fast as possible. Thus direct torque control is one form of the hysteresis or bang-bang control.This control method implies the following properties of the control:∙Torque and flux can be changed very fast by changing the references∙High efficiency & low losses - switching losses are minimized because the transistors are switched only when it is needed to keep torque and flux within their hysteresisbands∙The step response has no overshoot∙No coordinate transforms are needed, all calculations are done in stationary coordinate system∙No separate modulator is needed, the hysteresis control defines the switch control signals directly∙There are no PI current controllers. Thus no tuning of the control is required∙The switching frequency of the transistors is not constant. However, by controlling the width of the tolerance bands the average switching frequency can be kept roughly atits reference value. This also keeps the current and torque ripple small. Thus thetorque and current ripple are of the same magnitude than with vector controlled drives with the same switching frequency.∙Due to the hysteresis control the switching process is random by nature. Thus there are no peaks in the current spectrum. This further means that the audible noise of themachine is low∙The intermediate DC circuit's voltage variation is automatically taken into account in the algorithm (in voltage integration). Thus no problems exist due to dc voltage ripple (aliasing) or dc voltage transients∙Synchronization to rotating machine is straightforward due to the fast control; Just make the torque reference zero and start the inverter. The flux will be identified by the first current pulse∙Digital control equipment has to be very fast in order to be able to prevent the flux and torque from deviating far from the tolerance bands. Typically the control algorithmhas to be performed with 10 - 30 microseconds or shorter intervals. However, theamount of calculations required is small due to the simplicity of the algorithm ∙The current and voltage measuring devices have to be high quality ones without noise and low-pass filtering, because noise and slow response ruins the hysteresis control ∙In higher speeds the method is not sensitive to any motor parameters. However, at low speeds the error in stator resistance used in stator flux estimation becomes criticalThe direct torque method performs very well even without speed sensors. However, the flux estimation is usually based on the integration of the motor phase voltages. Due to the inevitable errors in the voltage measurement and stator resistance estimate the integrals tendto become erroneous at low speed. Thus it is not possible to control the motor if the output frequency of the variable frequency drive is zero. However, by careful design of the control system it is possible to have the minimum frequency in the range 0.5 Hz to 1 Hz that is enough to make possible to start an induction motor with full torque from a standstill situation.A reversal of the rotation direction is possible too if the speed is passing through the zero range rapidly enough to prevent excessive flux estimate deviation.If continuous operation at low speeds including zero frequency operation is required, a speed or position sensor can be added to the DTC system. With the sensor, high accuracy of the torque and speed control can be maintained in the whole speed range.HistoryDirect torque control was patented by Manfred Depenbrock in U.S. Patent 4,678,248 filed originally on October 20, 1984 in Germany. He called it "Direct Self-Control" (DSC). However, Isao Takahashi and Toshihiko Noguchi presented a similar idea only few months later in a Japanese journal. Thus direct torque control is usually credited to all three gentlemen.The only difference between DTC and DSC is the shape of the path along which the flux vector is controlled to follow. In DTC the path is a circle and in DSC it was a hexagon. Today DTC uses hexagon flux path only when full voltage is required at high speeds.Since Depenbrock, Takahashi and Noguchi had proposed direct torque control (DTC) for induction machines in the mid 1980s, this new torque control scheme has gained much momentum. From its introduction, the Direct Torque control or Direct Self Control (DSC) principle has been used for Induction Motor (IM) drives with fast dynamics. Despite its simplicity, DTC is able to produce very fast torque and flux control, if the torque and flux are correctly estimated.Among the others, DTC/DSC was further studied in Ruhr-University in Bochum, Germany at the end of 80's. A very good treatment of the subject 。
附录一:外文原文Super capacitors - An OverviewKey words: Electrostatic capacitor; Electrolytic capacitor; Ceramic capacitor;Electrical double layer capacitor; Super Capacitor1.INTRODUCTIONThis paper offers a concise review on the renaissance of a conventional capacitor toelectrochemical double layer capacitor or super capacitor. Capacitors are fundamental electrical circuitelements that store electrical energy in the order of microfarads and assist in filtering. Capacitors havetwo main applications; one of which is a function to charge or discharge electricity. This function isapplied to smoothing circuits of power supplies, backup circuits of microcomputers, and timer circuitsthat make use of the periods to charge or discharge electricity. The other is a function to block the flowof DC. This function is applied to filters that extract or eliminate particular frequencies. This isindispensable to circuits where excellent frequency characteristics are required. Electrolytic capacitorsare next generation capacitors which are commercialized in full scale. They are similar to batteries in cell construction but the anode and cathode materials remain the same. They are aluminum, tantalum and ceramic capacitors where they use solid/liquid electrolytes with a separator between two symmetrical electro des.An electrochemical capacitor (EC), often called a Super capacitor or Ultra capacitor, stores electrical charge in the electric double layer at a surface-electrolyte interface, primarily in high-surface-area carbon. Because of the high surface area and the thinness of the double layer, these devices can have very a high specific and volumetric capacitance. This enables them to combine a previously unattainable capacitance density with an essentially unlimited charge/discharge cycle life. The operational voltage per cell ,limited only by the breakdown potential of the electrolyte, is usually<1 or <3 volts per cell for aqueous or organic electrolytes respectively.The concept of storing electrical energy in the electric double layer that isformed at the interface between an electrolyte and a solid has been known since the late 1800s. The first electrical device using double-layer charge storage was reported in 1957 by H.I. Becker of General Electric (U.S. Patent 2,800,616).Unfortunately, Becker’s device was imp ractical in that, similarly to a flooded battery, both electrodes needed to be immersed in a container of electrolyte, and the device was never comercialised.Becker did, however, appreciate the large capacitance values subsequently achieved by Robert A. Rightmire, a chemist at the Standard Oil Company of Ohio (SOHIO), to whom can be attributed the invention of the device in the format now commonly used. His patent (U.S. 3,288,641), filed in 1962 and awarded in late November 1966, and a follow-on patent (U.S. Patent 3,536,963) by fellow SOHIO researcher Donald L. Boos in 1970, form the basis for the many hundreds of subsequent patents and journal articles covering all aspects of EC technology.This technology has grown into an industrywith sales worth severalhundred million dollars per year. It is an in dustry that is poised today for rapid growth in the near term with the expansion of power quality needs and emerging transportation applications.Following the commercial introduction of NEC’s Super Capacitor in 1978, under licence from SOHIO, EC have evolved through several generations of designs. Initially they were used as back-up power devices for v is for cells ranging in size from small millifarad size devices with exceptional pulse power performance up to devices rated at hundreds of thousands of farads, with systems in some applications operating at up to 1,500 volts. The technology is seeing increasingly broad use, replacing batteriesolatile clock chips and complementary metal-oxide-semiconductor (CMOS) computer memories. But many other applications have emerged over the past 30 years, including portable wireless communication, enhanced power quality for distributed power generation systems, industrial actuator power sources, and high-efficiency energy storage for electric vehicles(EVs) and hybrid electric vehicles (HEVs).Overall, the unique attributes of ECs often complement the weaknesses of other power sources like batteries and fuel cells.Early ECs were generally rated at a few volts and had capacitance values measured from fractions of farads up to several farads. The trend today in some cases and in others complementing their performance.The third generation evolution is the electric double layer capacitor, where the electrical charge stored at a metal/electrolyte interface is exploited to construct astorage device. The interface can store electrical charge in the order of 610Farad. The main component in the electrode construction is activated carbon. Though this concept was initialized and industrialized some 40 years ago, there was a stagnancy in research until recent times; the need for this revival of interest arises due to the increasing demands for electrical energy storage in certain current applications like digital electronic devices, implantable medical devices and stop/start operation in vehicle traction which need very short high power pulses that could be fulfilled by electric double layer capacitors. They are complementary to batteries as they deliver high power density and low energy density. They also have longer cycle life than batteries and possess higher energy density as compared to conventional capacitors. This has led to new concepts of the so-called hybrid charge storage devices in which electrochemical capacitor is interfaced with a fuel cell or a battery. These capacitors using carbon as the main electrode material for both anode and cathode with organic and aqueous electrolytes are commercialized and used in day to-day applications. Fig.1 presents the three types of capacitors depicting the basic differences in their design and construction.Figure 1.Schematic presentation of electrostatic capacitor, electrolytic capacitor and electrical double layer capacitor.EDLCs, however suffer from low energy density. To rectify these problems, recently researchers try to incorporate transition metal oxides along with carbon in the electrode materials. When the electrode materials consist of transition metal oxides, then the electrosorption or redox processes enhance the value of specific capacitance ca. 10 -100 times depending on the nature of oxides. In such a situation, the EDLC is called as super capacitor or pseudo capacitor . This is the fourth generation capacitor. Performance of a super capacitor combines simultaneously two kinds of energy storage, i.e. non-faradic charge as in EDLC capacitors and faradaic charge similar toprocesses proceeding in batteries. The market for EC devices used for memory protection in electronic circuitry is about $150-200 million annually. New potential applications for ECs include the portable electronic device market, the power quality market, due particularly to distributed generation and low-emission hybrid cars, buses and trucks. There are some published reviews on capacitors and super capacitors . In the present overview, the evolution of electrochemical double layer capacitors starting from simple electrostatic capacitors is summarized.2. EXPERIMENTAL PARTThe invention of Leiden jar in 1745 started the capacitor technology; since then, there has been tremendous progress in this field. In the beginning, capacitors are used primarily in electrical and electronic products, but today they are used in fields ranging from industrial application to automobiles, aircraft and space, medicine, computers, games and power supply circuits. Capacitors are made from two metallic electrodes (mainly Si) placed in mutual opposition with an insulating material (dielectric) between the electrodes for accumulating an electrical charge. The basic equation relating to the capacitors is:C = εS/d (1)where C(μF) is the electrostatic capacity, the dielectric constant of the dielectric, S (cm2) the surface area of the electrode and d (cm) the thickness of the dielectric. The charge accumulating principle can be described as follows: when a battery is connected to the capacitor, flow of current induces the flow of electrons so that electrons are attracted to the positive terminal of the battery and so they flow towards the power source. As a result, an electron deficiency develops at the positive side, which becomes positively charged and an electron surplus develops at the negative side, which becomes negatively charged. This electron flow continues until the potential difference between the two electrodes becomes equal to the battery voltage. Thus the capacitor gets charged. Once the battery is removed, the electrons flow from the negative side to the side with an electron deficiency; this process leads to discharging. The conventional capacitors yield capacitance in the range of 0.1 to 1 μF with a voltage range of 50 to 400 V. Various materials such as paper (ε, 1.2-2.6), paraffin (ε 1.9-2.4), polyethylene (2.2-2.4), polystyrene (ε, 2.5-2.7), ebonite (ε, 2-3.5), polyethylene tetraphtharate (ε,3.1-3.2), water (ε, 80) sulfur(ε, 2-4.2), steatite porcelain (ε, 6-7), Al porcelain (ε, 8-10), mica(ε, 5-7)and insulated mineral oil (ε, 2.2-2.4) are used as dielectrics in capacitors.The capacitance output of these silicon based capacitors is limited and has to cope with low surface-to volume ratios of these electrodes. To increase the capacitance, as per eq., one has to increase to ∂or S and decrease; however the ∂value is largely determined by the working voltage and cannot be tampered. When aiming at high capacitance densities, it is necessary to combine the mutual benefits achieved with a high permittivity insulator material and an increased effective surface area. With Si as the substrate material, electrochemical etching produces effective surface area. The surface area of this material gets enlarged by two orders of magnitude compared to unetched surface. Electrochemically formed macroporous Si has been used for the preparation of high aspect ratio capacitors with layered SiO2/Si3N4/SiO2 insulators. Research work on the modification of conventional capacitors to increase the specific capacitance is also in progress. Approximately 30 times higher capacitance densities are reported recently for Si/Al2O3/ZnO: Al capacitor where Si is electrochemically etched porous one. Another way identified to increase the surface area of the electrodes is to form anodically formed oxides (Al, Ta); however, ceramic capacitors are based on the high dielectric constant rather than the electrode area.3. ELECTROLYTIC CAPACITORSThe next generation capacitors are the electrolytic capacitors; they are of Ta, Al and ceramic electrolytic capacitors. Electrolytic capacitors use an electrolyte as conductor between the dielectrics and an electrode. A typical aluminum electrolytic capacitor includes an anode foil and a cathode foil processed by surface enlargement and or formation treatments. Usually, the dielectric film is fabricated by anodizing high purity Al foil for high voltage applications in boric acid solutions. The thickness of the dielectric film is related to the working voltage of the aluminum electrolytic capacitor. After cutting to a specific size according to the design specification, a laminate made up of an anode foil, a cathode foil which is opposed to the dielectric film of the anode foil and a separator interposed between the anode and cathode foils, is wound to provide an element. The wound element does not have any electricalcharacteristics of electrolytic capacitor yet until completely dipped in an electrolyte for driving and housed in a metallic sheathed package in cylindrical form with a closed-end equipping a releaser. Furthermore, a sealing material made of elastic rubber is inserted into an open-end section of the sheathed package and the open-end section of the sheathed package by drawing, whereby an aluminum electrolytic capacitor is constituted. Electrolytic aluminum capacitors are mainly used as power supplies for automobiles, aircraft, space vehicles, computers, monitors, motherboards of personal computers and other electronics.There are two types of tantalum capacitors commercially available in the market; wet electrolytic capacitors which use sulfuric acid as the electrolyte and solid electrolytic capacitors which use MnO2 as the solid electrolyte. Though the capacitances derived from both Ta and Al capacitors are the same, Ta capacitors are superior to Al capacitors in temperature and frequency characteristics. For analog signal systems, Al capacitors produce a current-spike noise which does not happen in Ta capacitors. In other words, Ta capacitors are preferred for circuits which need high stability characteristics. The total world wide production of Al electrolytic capacitors amounts to US$ 3.8 billion, 99% of which are of the wet type. Unlike Ta solid electrolytic capacitors, the solid electrolyte materials used are of organic origin; polypyrrole, a functional polymer and TCNQ (7,7, 8, 8- tetracyanoquniodimethane) an organic semiconductor. Next, MnO2 solid electrolyte material is formed on the surface of that dielectric layer and on top of that a layer of polypyrrole organic solid electrolyte material is formed by electrolytic synthesis. Following this, the positive and negative electrodes are mounted to complete the electronic component. However, the capacitances of these electrolytic capacitors are in the range 0.1 to 10F with a voltage profile of 25 to 50 V.The history of development of electrolytic capacitors which were mass produced in the past as well as today is presented by S. Niwa and Y. Taketani . Many researchers try to improve the performance of these electrolytic capacitors by modifying the electrode or electrolyte. Generally, the increases in effective surface area (S) are achieved by electrolytic etching of aluminum substrate before anodization, but now it faces with the limit. It is also very difficult to decrease d because the d value is largely decided when the working voltages are decided. Increase in may be a possible routine to form composite dielectric layers by incorporating relatively large value compounds. Replacement of MnO2 by polypyrrole solid electrolyte was reported to reduce electrostatic resistance due to its higher conductivity; aromaticsulfonate ions were used as charge compensating dopant ions .A tantalum capacitor with Ta metal as anode, polypyrrole as cathode and Ta2O5 dielectric layer was also reported. In the Al solid electrolytic capacitors, polyaniline doped with inorganic and organic acids was also studied as counter electrode. In yet another work, Al solid electrolytic capacitor with etched Al foil as anode, polyaniline / polypyrrrole as cathode and Al2O3 as dielectric was developed. Ethylene carbonate based organic electrolytes and -butyrolactone based electrolytes have been tried as operating electrolytes in Al electrolytic capacitors. Masuda et al. have obtained high capacitance by electrochemically anodizing rapidly quenching Al-Ti alloy foil. Many researchers have tried the other combination of alloys such as Al-Zr, Al-Si, Al-Ti, Al-Nb and Al-Ta composite oxide films. Composite oxide films of Al2O3-(Ba0.5Sr0.5TiO3) and Al2O3- Bi4Ti3O12 on low-voltage etched aluminum foil were also studied. Nb-Ta-Al for Ta electrolytic capacitors was also tried as anode material .A ceramic capacitor is a capacitor constructed of alternating layers of metal and ceramic, with the ceramic material acting as the dielectric. Multilayer ceramic capacitors (MLCs) typically consist of ~100 alternate layers of electrode and dielectric ceramics sandwiched between two ceramic cover layers. They are fabricated by screen-printing of electrode layers on dielectric layers and co-sintering of the laminate. Conventionally, Ag-Pd is used as the electrode material and BaTiO3 is used as the dielectric ceramic. From 2000 onwards, the MLCs market has been growing in pace with the exponential development of communications. They are produced in the capacitance range of 10 F (normally the range of Ta and Al electrolytic capacitors); they are highly useful in high frequency applications. Historically, a ceramic capacitor is a two-terminal non-polar device. The classical ceramic capacitor is the disc capacitor. This device predates the transistor and was used extensively in vacuum-tube equipment (e.g radio receivers) from c. a. 1930 through the 1950s and in discrete transistor equipment from the 1950s through the 1980s. As of 2007, ceramic disc capacitors are in widespread use in electronic equipment, providing high capacity and small size at low price compared to the other types.The other ceramic materials that have been identified and used are CaZrO3, MgTiO3, SrTiO3 etc. A typical 10 F MLC is a chip of size (3.2 x 1.6 x 1.5 mm). Mn, Ca, Pd , Ag etc are some of the other internal electrodes used. Linear dielectrics and antiferroelectrics based o strontium titante have been developed for high voltage disk capacitors. These are applicable for MLCs with thinner layers because of their high coercive fields. One of the most critical material processing parameters is the degreeof homogeneous mixing of additive in the slurry. The binder distribution in the green ceramic sheet, the degree of surface roughness, fine size nickel powder, formation of green sheet, electrode deposition ad sheet stacking etc play a crucial role in the process technology. Any one of these facts if mishandled would result in the failure of the device. For instance, providing a roughess of 5 m thick green sheet to 0.5 m is mandatory so that a smooth contact surface with the inner nickel electrode can be established. This is a very important factor in avoiding the concentration of electric filed at asperities, where the charge emission from the electrode is accelerated, resulting in short failure. Conventional sheet/printing method has a technical limit of producing a thickness around 1 m dielectric; in order to decrease the thickness further, thin film technologies like CVD, sputtering, plasma-spray etc has to be used.The other types of capacitors are film capacitors which use thin polyester film and polypropylene film as dielectrics and meta-glazed capacitors which incorporate electrode plates made of film vacuum evaporated with metal such as Al. Films can be of polyester, polypropylene or polycarbonate make. Also capacitors are specified depending on the dielectric used such as polyester film capacitor, polypropylene capacitor, mica capacitor, metallized polyester film capacitor etc.4. DOUBLE LAYER CAPACITORSElectric/electrochemical double layer capacitor (EDLC) is a unique electrical storage device, which can store much more energy than conventional capacitors and offer much higher power densitythan batteries. EDLCs fill up the gap between the batteries and the conventional capacitor, allowing applications for various power and energy requirements i.e., back up power sources for electronic devices, load-leveling, engine start or acceleration for hybrid vehicles and electricity storage generated from solar or wind energy. EDLC works on the principle of double-layer capacitance at the electrode/electrolyte interface where electric charges are accumulated on the electrode surfaces and ions of opposite charge are arranged on the electrolyte side.Figure 2.Charge storage mechanism of an EDLC cell under idle and charged conditions.Fig. 2 shows the mechanism of charge storage in an EDLC cell and Fig. 3 shows the configuration of an typical EDLC cell. There are two main types of double layer capacitors as classified by the charge storage mechanism: (i) electrical double-layer capacitor; (ii) electrochemical double layer capacitor or super/pseudocapacitor. An EDLC stores energy in the double-layer at the electrode/electrolyte interface, whereas the supercapacitor sustains a Faradic reaction between the electrode and the electrolyte in a suitable potential window. Thus the electrode material used for the construction of the cell for the former is mainly carbon material while for the latter, the electrode material consist of either transition metal oxides or mixtures of carbon and metal oxides/polymers. The electrolytes can be either aqueous or non-aqueous depending on the mode of construction of EDLC cell.Figure 3.Typical configuration of an EDLC cellThere are two general directions of interest. One is the long term goal of the development of electrical propulsion for vehicles, and the other is the rapid growth of portable electronic devices that require power sources with maximum energy content and the lowest possible size and weight.5. CONCLUSIONSAccording to a market survey by Montana, super capacitors are becoming a promising solution for brake energy storage in rail vehicles. The expected technological development outside railway sector is also shown to be highly dynamic: diesel electric vehicles, catenary free operation of city light rail, starting system for diesel engines, hybrid-electric cars, industrial applications, elevators, pallet trucks etc. The time horizon expected for development is next 5 to 10 years. The main development goals will be,· long life time· increase of the rated voltage· improvements of the range of operating temperature· increase of the energy and power densitiesVery recently, hybrid car is introduced in the market but it is turned to be very expensive and out of common man’s reach. Shortage and cost of fossil fuels already instigated alternate technologies viable for traction purposes. In such a situation,EDLCs are also useful to store energy generated from non-conventional energy sources. A future possibility of service centers set up for EDLC supply similar to petrol (as on date) is not far as the main setbacks in technology development may take a decade for fruitful results.附录二:外文译文超级电容器-概述关键词:静电电容,电解电容器,陶瓷电容器,双电层 ,电容器,超级电容器1.引言本文为电化学双层电容器或超级电容器提供在一台常规电容器,简明的介绍新生的电化学双电层电容器或超级电容器。
附录1 中文参考资料1.变压器是变换交流电压、电流和阻抗的器件,当初级线圈中通有交流电流时,铁芯(或磁芯)中便产生交流磁通,使次级线圈中感应出电压(或电流)。
变压器由铁芯(或磁芯)和线圈组成,线圈有两个或两个以上的绕组,其中接电源的绕组叫初级线圈,其余的绕组叫次级线圈。
2. 理想变压器不计一次、二次绕组的电阻和铁耗,其间耦合系数K=1 的变压器称之为理想变压器描述理想变压器的电动势平衡方程式为e1(t) =-N1dφ/dt、e2(t)=-N2dφ/dt若一次、二次绕组的电压、电动势的瞬时值均按正弦规律变化,则有不计铁心损失,根据能量守恒原理可得由此得出一次、二次绕组电压和电流有效值的关系令K=N1/N2,称为匝比(亦称电压比)。
3. 变压器的结构简介(1)铁心是变压器中主要的磁路部分。
通常由含硅量较高,厚度分别为0.35 mm\0.3mm\0.27 mm,表面涂有绝缘漆的热轧或冷轧硅钢片叠装而成铁心分为铁心柱和横片俩部分,铁心柱套有绕组;横片是闭合磁路之用铁心结构的基本形式有心式和壳式两种(2)绕组是变压器的电路部分,它是用双丝包绝缘扁线或漆包圆线绕成变压器的基本原理是电磁感应原理,现以单相双绕组变压器为例说明其基本工作原理:当一次侧绕组上加上电压Ú1时,流过电流Í1,在铁芯中就产生交变磁通Ø1,这些磁通称为主磁通,在它作用下,两侧绕组分别感应电势É1,É2,感应电势公式为:E=4.44fNØm 式中:E--感应电势有效值,f--频率,N--匝数,Øm--主磁通最大值,由于二次绕组与一次绕组匝数不同,感应电势E1和E2大小也不同,当略去内阻抗压降后,电压Ú1和Ú2大小也就不同。
当变压器二次侧空载时,一次侧仅流过主磁通的电流(Í0),这个电流称为激磁电流。
![电气自动化毕业设计外文文献翻译[管理资料]](https://uimg.taocdn.com/4c162aeb6bd97f192379e915.webp)
译文:设定蒸汽发生器的需求1自然需求在火力发电厂中,从锅炉中产生的蒸汽通常都用来去驱使汽轮机工作,或是送往一个工业过程也或是一个直接加热体系(或者是三者使用的一种混合使用)。
此外,工厂的主要目的是为了焚烧工业的、内部的或是现场的一些废物,蒸汽只是作为一个副产品而被产生出来,目的是用来驱使涡轮汽轮机从而满足发热需要。
在每种情况下,决定工厂运作的主要因素是对蒸汽量的需求。
所有的任何事情都是这个需求的附属品,尽管它可能与这个需求有着极为密切的联系。
控制锅炉操作的决定性因素被称作“总需求”。
在火力发电厂中蒸汽是由燃烧燃料得到的,并且总需求设定使得炉的燃烧同比于蒸汽的产生量。
这就反过来需要送风机送出足够的空气用来燃烧燃料。
空气输入量要求被引风机从燃烧膛内驱逐出来的燃烧产物,其吞吐量必须与蒸汽的流量有关。
与此同时,水必须同时馈入到锅炉中以便于匹配蒸汽的产生量。
如前所述,锅炉是一个复杂的,多变量的,并且互动的一个过程。
而每一个参数之间都是相互影响和被影响着。
主要需求所采用的方式来是由电厂总体上的性质(是一个火电发电厂,还是一个垃圾焚化炉或是一个提供蒸汽的过程?)和电厂的总体配置(是仅需要一个锅炉就能够满足要求,还是要通过几个的结合?)。
总需求系统的性质以来与电厂的类型以及锅炉的操作形式,因此,有必要分别对每种类型的应用程序都进行检验。
在以下的部分中,我们所要解决的是主要需求在以下等级电厂中的应用:●火电厂;热电联产电厂;●垃圾转化为能源的电厂。
我们应该了解到,尽管所有的这些电厂都需要锅炉操作而产生蒸汽,而他们中的每个都有自己的需求以及系统要求的参数。
4.2设定电站应用程序的要求一台为操作涡旋电站而产生蒸汽的锅炉应该确保机器不停的供电以便于负荷所需的用电量。
联合使用一台混合循环燃汽轮机经常会是这样一种情况:由燃汽轮机产生出的功率满足所需求的,与此同时,蒸汽汽轮机充分利用从燃汽轮机1Power-plant Control and Instrumentation - The Control of Boilers and HRSG Systems ;David Lindsley所不需要的废热量。
毕业设计英文文献翻译(电力方向附带中文)大学毕业设计英文文献翻译,关于电力系统方向,电力谐波!绝对原创!HarmonicsService reliability and quality of power have become growing concerns for many facility managers, especially with the increasing sensitivity of electronic equipment and automated controls. There are several types of voltage fluctuations that can cause problems, including surges and spikes, sags, harmonic distortion, and momentary disruptions. Harmonics can cause sensitive equipment to malfunction and other problems, including overheating of transformers and wiring, nuisance breaker trips, and reduced power factor.What Are Harmonics?Harmonics are voltage and current frequencies riding on top of the normal sinusoidal voltage and current waveforms. Usually these harmonic frequencies are in multiples of the fundamental frequency, which is 60 hertz (Hz) in the US and Canada. The mostcommon source of harmonic distortion is electronic equipment using switch-mode power supplies, such as computers, adjustable-speed drives, and high-efficiency electronic light ballasts.Harmonics are created by these Dswitching loads‖ (also called “nonlinear loads,‖ because current does not vary smoothly with voltage as it does with simple resistive and reactive loads): Each time the current is switched on and off, a current pulse is created. The resulting pulsed waveform is made up of a spectrum of harmonic frequencies, including the 60 Hz fundamental and multiples of it. This voltage distortion typically results from distortion in the current reacting with system impedance. (Impedance is a measure of the total opposi tion―resistance, capacitance, and inductance―to the flow of an alternating current.) The higher-frequency waveforms, collectively referred to as total harmonic distortion (THD), perform no useful work and can be asignificant nuisance.Harmonic waveforms are characterized by their amplitude and harmonic number. In the U.S. and Canada, the third harmonic is 180 Hz―or 3 x 60 Hz―and the fifth harmonic is 300 Hz (5 x 60Hz). The third harmonic (and multiples of it) is the largest problem in circuits with single-phase loads such as computers and fax machines. Figure 1 shows how the 60-Hz alternating current (AC) voltage waveform changes when harmonics are added.大学毕业设计英文文献翻译,关于电力系统方向,电力谐波!绝对原创!The Problem with HarmonicsAny distribution circuit serving modern electronic devices will contain some degree of harmonic frequencies. The harmonics do not always cause problems, but the greater the power drawn by these modern devices or other nonlinear loads, the greater the level of voltage distortion. Potential problems (or symptoms of problems) attributed to harmonics include:■ Malfunction of sensitive equipment■ Random tripping of circuit breakers■ Flickering lights■ Very high neutral currents■ Overheated phase conductors, panels, and transformers ■ Premature failure of transformers and uninterruptible power supplies (UPSs)■ Reduced power factor■ Reduced system capacity (because harmonics create additional heat, transformers and otherdistribution equipment cannot carry full rated load)Identifying the ProblemWithout obvious symptoms such as nuisance breaker trips or overheated transformers, how do you determine whether harmonic current or voltages are a cause for concern? Here are several suggestions for simple, inexpensive measurements that a facility manager or staff electrician could take, starting at the outlet and moving upstream:■ Measure the peak and root mean square (RMS) voltage at a sample of receptacles. The Dcrest factor‖ is the ra tio of peak to RMS voltage. For a perfectly sinusoidal voltage, the crest factor will be 1.4. Low crest factor is a clear indicator of the presence of harmonics. Note that these measurements must be performed with a Dtrue RMS‖ meter―one that doesn‘t assume a perfectly sinusoidal waveform.■ Inspect distribution panels. Remove panel covers and visually inspect components for signs of overheating, including discolored or receded insulation or discoloration of terminal screws. If you see any of these symptoms, check that connectionsare tight (since loose connections could also cause overheating), and compare currents in all conductors to their ratings.■ Measure phase and neutral currents at the transformer secondary with clamp-on current probes. If no harmonics are being generated, the neutral current of a three-phase distribution system carries only the imbalance of the phase currents. In a well-balanced three-phase distribution system, phase currents will be very similar, and current in the neutral conductor should be much lower than phase current and far below its rated current capacity. If phase currents are similar and neutral current exceeds their imbalance by a wide margin, harmonics are present. If neutral current is above 70 percent of the cond uctor‘s rated capacity, you need to mitigate the problem.■Compare transformer temperature and loading with nameplate temperature rise and capacity ratings. Even lightly loaded transformers can overheat if harmonic current is high. A transformer that is near or over its rated temperature rise but is loaded well below its rated capacity is a clear sign that harmonics are at work. (Many transformers have built-in temperature gauges. If yours does not, infrared thermography can be used to detect overheating.)大学毕业设计英文文献翻译,关于电力系统方向,电力谐波!绝对原创!In addition to these simple measurements, many power-monitoring devices are now commercially available from a variety of manufacturers to measure and record harmonic levels. These instruments provide detailed information on THD, as well as on the intensity of individual harmonic frequencies. After taking the appropriate measurements to determine whether you have high levels of harmonics and, if so, to find the source, you will be well-positioned to choose the best solution.Solutions to Harmonics ProblemsThe best way to deal with harmonics problems is through prevention: choosing equipment and installation practices that minimize the level of harmonics in any one circuit or portion of a facility. Many power quality problems, including those resulting from harmonics, occur when new equipment is haphazardly added to older systems. However, even within existing facilities, the problems can often be solved with simple solutions such as fixing poor or nonexistent grounding on individual equipment or the facility as a whole, moving a few loads between branch circuits, or adding additional circuits to help isolate the sensitiveequipment from what is causing the harmonic distortion. If the problems cannot be solved by these simple measures, there are two basic choices: to reinforce the distribution system to withstand the harmonics or to install devices to attenuate or remove the harmonics. Reinforcing the distribution system means installing double-size neutral wires or installing separate neutral wires for each phase, and/or installing oversized or Krated transformers, which allow for more heat dissipation. There are also harmonic-rated circuit breakers and panels, which are designed to prevent overheating due to harmonics. This option is generally more suited to new facilities, because the costs of retrofitting an existing facility in this way could be significant. Strategies for attenuating harmonics, from cheap to more expensive, include passive harmonic filters, isolation transformers, harmonic mitigating transformers (HMTs), the Harmonic Suppression System (HSS) from Harmonics Ltd., and active filters(Table 1).Passive filters (also called traps) include devices that provide low-impedance paths to divert harmonics to ground and devices that create a higher-impedance path to discourage the flow of harmonics. Both of these devices, by necessity, change theimpedance characteristics of the circuits into which they are inserted. Another weakness of passive harmonic technologies is that, as their name implies, they cannot adapt to changes in the electrical systems in which they operate. This means that changes to the electrical system (for example, the addition or removal of power factorCcorrection capacitors or the addition of more nonlinear loads) could cause them to be overloaded or to create Dresonances‖ that could actually amplify, rather than diminish, harmonics.Active harmonic filters, in contrast, continuously adjust their behavior in response to the harmonic current content of the monitored circuit, and they will not cause resonance. Like an automatic transmission in a car, active filters are designed to accommodate a full range of expected operating conditions upon installation, without requiring further adjustments by the operator.Isolation transformers are filtering devices that segregate harmonics in the circuit in which they are created, protecting upstream equipment from the effects of harmonics. These transformers do not remove the problem in the circuit generating the harmonics, but they can prevent the harmonics from affecting more sensitive equipment elsewhere within the facility.大学毕业设计英文文献翻译,关于电力系统方向,电力谐波!绝对原创!Harmonic mitigating transformers actually do relieve problematic harmonics. HMTs can be quite cost-effective in the right application, because they can both improve reliability and reduce energy costs. The right application includes transformers that are heavily or moderately loaded and where high levels of harmonic currents are present. In addition, HMTs are very effective in supporting critical loads that are backed up by a UPS. UPSs and backup generators tend to have high impedance, which results in high voltage distortion under nonlinear loading. Because of this, equipment that operates flawlessly when supplied by utility power may malfunction when the backup system engages during a utility outage. Note that some of these power systems have output filters (either passive or active) to control harmonic levels. The presence or absence of such filters should be determined before adding an HMT.The Harmonics Ltd. Harmonic Suppression System is a unique solution for single-phase loads that is designed to suppress the third harmonic. An HSS is generally more expensive than an HMT, but it is designed to attenuate the harmonicsproblems throughout the entire distribution system, not just upstream of the transformer. The types of facilities that present the best opportunities for HSS installation are those that place a very high premium on power quality and reliability, such as server farms, radio and television broadcast studios, and hospitals. (See .) Economic EvaluationEvaluating the life-cycle costs and effectiveness of harmonics mitigation technologies can be ve ry challenging―beyond the expertise of most industrial facility managers. After performing the proper measurement and analysis of the harmonics problem, this type of evaluation requires an analysis of the costs of the harmonics problem (downtime of sensitive equipment, reduced power factor, energy losses or potential energy savings) and the costs of the solutions. A good place to start in performing this type of analysis is to ask your local utility or electricity provider for assistance. Many utilities offer their own power quality mitigation services or can refer you to outside power quality service providers.Additional ResourcesInstitute of Electrical and Electronics Engineers (IEEE),Standard 519-1992, DIEEE大学毕业设计英文文献翻译,关于电力系统方向,电力谐波!绝对原创!Recommended Practices and Requirements for Harmonic Control in Electric Power Systems‖ (1992), available at .Relationship between harmonics and symmetrical componentsAbstract New terminology is introduced to make clear the relationship between harmonics and symmetrical components. Three-phase sets are classified in terms of symmetrical sets and asymmetrical sets. Subclasses are introduced with the names symmetrical balanced sets, symmetrical unbalanced sets, asymmetrical balanced sets and asymmetrical unbalanced sets to show that a threephase set can resolve to either one, two or three symmetrical component sets. The results from four case studies show that these subclasses and their resolution to symmetrical component sets improve understanding of harmonic analysis of systems having balanced and unbalanced harmonic sources and loads.Keywords asymmetrical sets; harmonic flows; harmonic sources; symmetrical component sets; symmetrical sets Any periodic wave shape can be broken down into oranalysed as a fundamentalwave and a series of harmonics.Three-phase harmonic analysis requires a clear understanding of the relationship between symmetrical component injections from harmonic sources (e.g. adjustable speed drives, ASDs) and their relationship to harmonic flows (symmetrical components) arising from the application of a harmonic source to a linear system.Alimited number of references contain brief information concerning harmonics and symmetrical components. Reference 1, provides a paragraph on this topic and uses the heading Relationship between Harmonics and Symmetrical Components‘.It includes a table that is supported by a brief explanatory paragraph. The table expresses harmonics in terms of positive, negative and zero sequences. It states that these sequences are for harmonics in balanced three-phase systems. The heading refers to symmetrical components while the content refers to balanced three-phase systems. Herein lies the anomaly. Classically, symmetrical components (especially ero sequence) are only applied in unbalanced systems. The following questions rose after reading the Ref. 1 paragraph.(a)Do symmetrical components (especially zero sequence), in the classical sense,apply in balanced as well as unbalanced non-sinusoidal systems and is this abreak from tradition?(b)What do the terms, symmetrical, asymmetrical, balanced, unbalanced andsymmetrical components mean?(c)What are the conditions under which a system must operate so that harmonicsresolve to positive, negative and zero sequences and is the table given inRef. 1 correct?The terminology used is found inadequate for describing non-sinusoidal systems.There is thus a need to introduce a three-phase terminology that will show the relationship and make the comparison between injections (currents) and harmonic flows (voltages and currents) meaningful.References 3 provides the basis for the solution by providing definitions for threephase sets‘, symmetrical sets‘an d symmetricalcomponent sets‘.The purpose of this paper is to introduce an approach to harmonic analysis大学毕业设计英文文献翻译,关于电力系统方向,电力谐波!绝对原创!based on the classification of three-phase sets and to make to comparison between injections from harmonic sources and corresponding harmonic flows quantifiable by expressing the results in terms of the number of symmetrical component sets found.Harmonic flows and their resolution to symmetrical components depends upon the magnitudes and phase sequences of the injections from a harmonic source, on the system‘s sequence impedances, on three- and four-wire connections and on whether the customer‘s linear load on the system is balanced or unbalanced. Therefore, what is injected in terms of symmetrical component sets by a harmonic source is not necessarily received by the system, i.e. the harmonic flows may resolve to one, two or three symmetrical component sets and this depends upon the type of three-phase set found. Therefore, any three-phase harmonic may be partially made up of any of thesymmetrical component sets.Four case studies are reported and they show a novel method for teaching the flow of power system harmonics. It is important to use case studies as part of one‘s teaching as they link learning to concepts and improve understanding. They show how the method of symmetrical components can be extended to a system‘s response to harmonic flows. When taught as a group, the four case studies improve cognitive skills by showing that the symmetrical component responses under unbalanced situations are different to the balanced state.IEEE __TIONS ON POWER __NICS VOL.19,NO.3,__年大学毕业设计英文文献翻译,关于电力系统方向,电力谐波!绝对原创!谐波服务的可靠性和电能质量已成为越来越多设施经理的关注,尤其是随着电子设备和自动化控制灵敏度提高了很多。

XX大学学生毕业设计(论文)外文译文压,此直流电压进行逆变电路逆变(第二种功率变换)成正弦波电压,由低通滤波器输出;当市电中断时,蓄电池的直流电压经过升压(第三种功率变换)后,进行逆变器逆变成220V交流电压从低通滤波器输出。
上述过程历经三种功率变换,每一次功率变换都会产生约15%的功率损耗,其整机效率相当低。
2交流及电池检测电路图09-04是交流和蓄电池检测电路,电路分两部份,前部份是交流检测电路,检测市电是否断电或在额定范围之内。
比较器LM339的同相端接参考交流电压整流后的馒头波电压Va,反相端接市电整流后的馒头波电压Vd。
当输入市电在额定范围之内,电压Vd大于电压Va,比较器LM339输出低电平,使开关S1关断;当输入市电小于额定范围或停电时,电压Vd小于电压Va,比较器LM339输出高电平,使开关S1开通,于是信号电压V4加在Q8的栅源之间,Q8导通,蓄电池电压输出提供负载电流。
后部份是蓄电池检测电路,蓄电池电压E01接到光耦4N33二极管部份的阳极,通过电阻R7形成回路,三极管部份接成射极跟随器,经过电阻R4、R12和R5、R11分压后,接入时钟芯片NE555/ALD的Trig和Thresh端,当蓄电池电压在正常范围时,NE555/ALD输出低电平,开关S2关断;当蓄电池电压低于额定值时,NE555/ALD输出高电平,使开关S2开通,信号电压V5加在Q3的栅源之间,Q3导通,整流后的馒头波电压对蓄电池进行充电。
3极性反转电路图09-05是极性反转电源,其功能是把输入电压的极性取反。
MOS管Q1、Q2的共同源极接电阻R2和C1、D4的串联支路,D4的阴极接地,输入电压V3是正电压,驱动信号V1、V2是50Hz的方波。
前10ms 期间,Q1导通,V3在电阻R5上形成10ms的方波电压,同时通过D4向电容C1充电,极性上正下负;第二个10ms到来的时候,Q1截止,Q2导通,把C1的正电压端接地,二极管D3输出负电压,于是在电阻R1上得到10ms的负方波电压。
毕业设计英文文献翻译(电力方向附带中文)大学毕业设计英文文献翻译 ,关于电力系统方向,电力谐波!绝对原创!HarmonicsService reliability and quality of power have become growing concerns for many facility managers, especially with the increasing sensitivity of electronic equipment and automated controls. There are several types of voltage fluctuations that can cause problems, including surges and spikes, sags, harmonic distortion, and momentary disruptions. Harmonics can cause sensitive equipment to malfunction and other problems, including overheating of transformers and wiring, nuisance breaker trips, and reduced power factor.What Are Harmonics?Harmonics are voltage and current frequencies riding on top of the normal sinusoidal voltage and current waveforms. Usually these harmonic frequencies are in multiples of the fundamental frequency, which is 60 hertz (Hz) in the US and Canada. The most common source of harmonic distortion is electronic equipment using switch-mode power supplies, such as computers, adjustable-speed drives, and high-efficiency electronic light ballasts.Harmonics are created by these ―switching loads‖ (also called “nonlinear loads,‖ because current does not vary smoothly with voltage as it does with simple resistive and reactive loads): Each time the current is switched on and off, a current pulse is created. The resulting pulsed waveform is made up of a spectrum of harmonic frequencies, including the 60 Hz fundamental and multiples of it. This voltage distortion typically results from distortion in the current reacting with system impedance. (Impedance is a measure of the total opposition—resistance, capacitance, and inductance—to the flow of an alternating current.) Thehigher-frequency waveforms, collectively referred to as total harmonic distortion (THD), perform no useful work and can be asignificant nuisance.Harmonic waveforms are characterized by their amplitude and harmonic number. In the U.S. and Canada, the third harmonic is 180 Hz—or 3 x 60 Hz—and the fifth harmonic is 300 Hz (5 x 60 Hz). The third harmonic (and multiples of it) is the largest problem in circuits with single-phase loads such as computers and fax machines. Figure 1 shows how the 60-Hz alternating current (AC) voltage waveform changes when harmonics are added.。
毕业设计/论文外文文献翻译院系机电与自动化学院专业班级电气工程及其自动化1104班姓名原文出处T&D Conference and Exposition,2014 IEEE PES,April 14-17,2014 评分指导教师华中科技大学武昌分校2015 年3月1日毕业设计/论文外文文献翻译要求:1.外文文献翻译的内容应与毕业设计/论文课题相关。
2.外文文献翻译的字数:非英语专业学生应完成与毕业设计/论文课题内容相关的不少于2000汉字的外文文献翻译任务(其中,汉语言文学专业、艺术类专业不作要求),英语专业学生应完成不少于2000汉字的二外文献翻译任务。
格式按《华中科技大学武昌分校本科毕业设计/论文撰写规范》的要求撰写。
3.外文文献翻译附于开题报告之后:第一部分为译文,第二部分为外文文献原文,译文与原文均需单独编制页码(底端居中)并注明出处。
本附件为封面,封面上不得出现页码。
4.外文文献翻译原文由指导教师指定,同一指导教师指导的学生不得选用相同的外文原文。
I.引言500kV输电线路总是位于绵延千里的荒野,接地设备在这里最容易遭受雷击。
据中国国家电网公司近年来的生产运行分析,在所有的110KV〜500KV输变电设备跳闸中40%至70%的输电线路停运是雷击造成的。
特别是在山区和有高频雷击或高阻抗的地方,线路故障较高[1-3]。
它严重地影响到电网的保障性、安全性和供电的可靠性。
因此降低雷击跳闸率是确保电力系统安全可靠的运行的重要任务。
不同的保护措施的应用目标和转化作用在不同的区域变化很大,其成本和难度[4-5]也是一样。
然而,在工程实践中,仍然采用忽略了多样性的闪电转化的粗放管理,这将导致不理想的结果,需要进行一次改进。
因此,取得完美的最终效果的关键是首先采取全面的研究,并与根据结果选择有较高的技术经济的转型战略。
本文旨在选择典型的防雷措施作为主要选择。
首先,它们的优点和缺点是它们通过建立电几何模型(EGM)进行分析。
电气工程及其自动化专业毕业论文外文翻译本科毕业设计(论文)中英文对照翻译院(系部)工程学院专业名称电气工程及其自动化年级班级 11级2班学生姓名蔡李良指导老师赵波Infrared Remote Control SystemAbstractRed outside data correspondence the technique be currently within the scope of world drive extensive usage of a kind of wireless conjunction technique, drive numerous hardware and software platform support. Red outside the transceiver product have cost low, small scaled turn, the baud rate be quick, point to point SSL, be free from electromagnetism thousand Raos etc. characteristics, can realization information at dissimilarity of the product fast, convenience, safely exchange and transmission, at short distance wireless deliver aspect to own very obvious of advantage. Along with red outside the data deliver a technique more and more mature, the cost descend, red outside the transceiver necessarily will get at the short distance communication realm more extensive of application.The purpo se that design this system is transmit customer’s operation information with infrared rays for transmit media, then demodulate original signal with receive circuit. It use coding chip to modulate signal and use decoding chip to demodulate signal. The coding chip is PT2262 and decoding chip is PT2272. Both chips are made in Taiwan. Main work principle is that we provide to input the information for the PT2262 with coding keyboard. The input information was coded by PT2262 and loading to high frequent loadwave whose frequent is 38 kHz, then modulate infrared transmit dioxide and radiate space outside when it attian enough power. The receive circuit receive the signal and demodulate original information. The original signal was decoded by PT2272, so as to driv e some circuit to accomplish customer’s operation demand.Keywords: Infrared dray;Code;Decoding;LM386;Red outside transceiver1 Introduction1.1 research the background and significanceInfrared Data Communication Technology is the world wide use of a wireless connection technology, by the many hardware and software platforms supported. Is a data through electrical pulses and infrared optical pulse switch between the wireless data transceiver technology.Infrared transceiver products with low cost, small, fast transmission rate, the point-to-point transmission security, not subject to electromagnetic interference and other characteristics that can be achieved between the different products, rapid, convenient and safe exchange and transmission, In short distance wireless transmission have a very distinct advantage.Infrared transceiver products in the portable product of a great role. At present, the world's 150 million piece of equipment used infrared technology in electronic products and industrial equipment. medical equipment and other fields widely used. For example, 95% of the notebook computers on the installation of infrared transceiver interface the majority of the cell phone is also the allocation of infrared transceiver interface. With the exchange of quantitative data, infrared datacommunications will enable cell phone data transmission more convenient. With infrared data transmission technology matures, perfect, low costs, Infrared Transceiver in short distance communications will be more widely applied.This chapter first describes the infrared transceiver IC design issues to the background and significance. then briefed the infrared data communications technology features and applications, and infrared transceiver product characteristics, domestic and international situation and development trend of the last under infrared remote transceiver system in practical application to establish a task of design orientation. 1.2 Infrared Remote Control Transceiver SystemInfrared remote control system is divided into single-channel and multi-channel remote control. Only a command signal transmission channel, called single-channel remote control system; with more than two instructions signal transmission channel known as a multi-channel remote control system. Relatively simple single-channel remote control, in general, only a launcher directive Key receivers and only one circuit implementation. While in the receiving circuit to add more stable memory circuits that can be activated commands to launch a number of key, so that the receiver circuit multi stable memory circuit repeatedly to change the state, to realize many of the functional control, But such a state of change is the order. If we are to achieve an arbitrary control, resort to the use of multi-channel remote control system. Multi-channel remote control can be realized by the object of arbitrary multi-function remote control. As for the choice of several routes and what control methods, according to the actual situation (such as object, operational requirements and cost accounting, etc.) to decide. General infrared remote transceiver system by infrared remote control transmitter signal coding, infrared remotecontrol signal receivers and decoders (or decoder chip MCU) and the external circuit consisting of three parts. Signal transmitter remote control code used to generate pulses of infrared emission-driven output infrared remote control signal, receiver completion of the remote control signal amplification and detection, plastic and demodulation encoding pulse. Infrared remote control coded pulse is going to obtain a continuous serial binary code, and for most of the infrared transceiver system, This serial code as micro-controller of the remote control input signals from the internal CPU completion of the remote control instruction decoder, on the other infrared remote control transceivers, the designers of electronic products, The internal micro-controller of the remote control decoder directive is not accessible. Therefore, people are using infrared encoder / decoder chip and microcontroller developed various generic infrared remote transceiver system, In various equipment infrared signals between the transceiver.Remote transceiver system generally transmitters and receivers is composed of two parts. Launchers from the general direction keys, coded instructions circuit modulation circuit, driving circuit, firing circuit of several parts. When pressed a key, the directive coding circuit, in the corresponding instructions encoded signal, the encoder signal to the carrier modulation, Driven by the power amplifier circuit after circuit fired from the field after firing instructions coded modulation signals. General receiver by the receiving circuit, the amplifier circuit, demodulation circuits, instruction decoder circuit, driving circuit, circuit implementation of several parts. Receiving Circuit will launch vehicles have been coded modulation signal receiving instructions from, and to enlarge evacuation demodulation circuit. Demodulation circuit will havethe coding modulation signal demodulation, namely, reduction of signal coding. The instruction decoder to the encoder signal decoding, Driven by the final circuit to drive the implementation of various instructions circuit to control the operation.1.3 infrared remote control transceiver product profilesCurrently infrared transceiver in accordance with the mode of transmission rate and can be divided into four categories : Serial mode, the highest rate of 115.2 Kbps; medium-speed model : the highest rate of 0.567 Mbps and 1.152Mbps; High-speed mode : The maximum rate of 16 Mbps.Also according to the size chip power consumption can be divided into low-power consumption and standard two categories, low-power type normally used 3 V power supply, transmission distance closer to about 0 - 30cm, which is commonly used standard 5V power supply, transmission distance away at least 1m above.Infrared communication technology in the development stage and there are several infrared communication standards, between different standards for infrared equipment can not infrared communication. To have all the infrared equipment to interoperability in 1993 by more than 20 large manufacturers initiated the establishment of an Infrared Data Association (IRDA) unified the infrared communication standards , which is currently widely used in infrared data communication protocols and standards, also known as the IRDA standard.Since 1993 IRDA since the establishment of the Infrared Data Association members have developed to more than 150. IRDA standards of the industry has been widely recognized and supported. Has beendeveloped with the infrared communications equipment have been as many as 100 species. IR module, installed capacity has reached 150 million sets. Although there is also a short distance wireless Bluetooth technology, But in infrared communication technology low cost and broad compatibility advantages, Infrared data communication in the future will still be a very long time inherent short-range wireless data communications fields play an important role.In various infrared transceiver products, although the transmission rate, transmission distance and other characteristics, But infrared transceiver products has been towards improving the transmission rate, increase the transmission distance and lower power consumption, expanding launch reception angle of development. In particular, as the technology development and maturity, the means of transmission is moving in the direction of point-to-multipoint. Therefore infrared remote control transceiver products have broader prospects for development.2 Infrared communication of knowledge2.1 infrared ray foundation knowledgeInfrared is actually a kind of electromagnetic wave. From the analysis of various natural component of the electromagnetic wave reflected spectrum is :-ray, x-ray, ultraviolet, visible, infrared, microwave and radio wave. From the viewpoint of form, and they did not seem to, but if the wavelength in descending order, and we will find him all theonl y visible light spectrum of the entire 0.38 μm - 0.76μm so long little area, and adjacent to the visible light and infrared (including the far infrared, mid-infrared and near infrared foreign) accounts for the spectrum of 0.76 μm - 1000μm of a major. Which micron wavelength range also includes UV, visible, near infrared, mid-infrared and far-infrared, microwave.From the above analysis shows that infrared is a very rich spectrum resources, it currently has in production, life, military, medical, and other aspects have been widely used, such as infrared heating, medical infrared, infrared communication, infrared camera, infrared remote control, and so on. Infrared remote control is the many applications of infrared part of the current household appliances widely used in TV remote control, VCR remote control, VCD remote control, high-fidelity audio remote control, are used infra-red remote control, It allows the control of these appliances have become very easy.Infrared lies between visible light and microwave a wave, it is with certain clinical characteristics of the wave. In the near-infrared, visible light and its adjacent, it is visible in certain characteristics, such as straight-line transmission, reflection, refraction, scattering, diffraction, can be certain objects and can be absorbed through the lens of their focusing. In the far-infrared region, owing to its neighboring microwave, it has some characteristics of microwave, If a strong penetrating power and can run through some opaque substances. Since in any object, natural profession, regardless of whether its own luminescence (referring to visible light), as long as the temperature is above absolute zero (-273 ° C), moment will be kept around to infrared radiation. Only higher temperature of objects strong infrared radiation, low-temperature objectsinfrared radiation weaker. Therefore infrared feature is the greatest common in nature, it is called thermal radiation called thermal radiation. Infrared cameras, infrared night market pyroelectric infrared detectors and some other missiles aiming at is the use of this characteristic of infrared work.Infrared and visible light compared to another characteristic of a variety of colors. As the longest wavelength of visible light is a wavelength of the shortest times (780 nm-380 nm), So is called an octave. And infrared wavelength is the longest shortest wavelength of a times, and the longest wavelength infrared is the shortest wavelength of 10 times, that is, 10 octave. Therefore, if visible light can be expressed as seven colors, infrared may performance 70 colors, showing the rich colors. Infrared smoke through the good performance, which is also one of its features.Because not visible to the infrared, it has little effect on the environment. By the wave infrared rays than the long wavelength radio waves, infrared remote control will not affect the nearby radio equipment. Another wavelength of less than 1.5μm near infrared light, transparent atmosphere in the visible light transmission characteristics much better than, because it close to the visible edge of the red light, linear transmission, reflection, refraction and absorption material and the physical characteristics very similar to visible light. Therefore, it can be used with similar visible focusing lens and other optical devices. Because infrared remote control is not as remote as the radio through the barrier to control the object's ability to control, so in the design of household appliances infra-red remote control, wireless remote control as unnecessary, each set (transmitters and receivers) have different frequency or remote coding (Otherwise, wall will control or interference with neighbors household appliances), all similar products in the infraredremote control, The same can control the frequency or coding, and no remote control signal "drop." This universal infrared remote control provides a great convenience. Infrared to visible light, is very subtle and confidentiality, therefore, the security, Alert and other security devices have been widely used. Infrared remote control is simple in structure and easy, low-cost, anti-interference capability, high reliability are a number of advantages, is a close-up remote control, especially in indoor remote control optimized manner.Infrared is not visible, people here are not aware of. Electronic technology is used infrared light emitting diode (also known as the IR emission diode) to generate infrared. Infrared remote control transceiver is using near-infrared transmission control instructions 0.76μm wavelength of ~ 1. 5μm. Near-infrared remote control as a light source, because there infrared light emitting diodes and infrared receiving device (photo diode. Transistor and PV) and the luminescence peak wavelength of light by the general 0.8μm ~ 0. 94μm. in the near-infrared band, both of the spectrum is the coincidence to a good match, access to higher transmission efficiency and higher reliability. Commonly used infrared diode, and its shape is similar LED light emitting diodes, Its basic circuit shown in figure 2 -2. The triode plans for the switch, when the base added a driving signal, Transistor saturated conduction infrared LED D is also Wizard Link, issued infrared (near infrared about 0.93 μm). D. The pressure drop of about 1.4 V and the current general for 10-20mA. To adapt to the working voltage of the D loop resistance often as a series of infrared diode current limit resistance.When the circuit diagram of the infrared emission control corresponding to the controlled device, the control of the distance and D is proportional to the transmitting power. In order to increase the distance of infrared control, infrared diode D should work on the pulse state that work is the lifeblood of current. Because pulse light (optical modulation) the effective transmission distance and pulse is proportional to the peak current, only maximize peak current Ip, will increase the infrared distance. Ip increase is a way to reduce the pulse duty cycle, that is compressed pulse width τ some TV infrared remote control, i ts infrared luminescence of the pulse duty cycle of about 1/4-1/3; Some electrical products infrared remote control, its duty cycle of 1 / 10. Decreasing pulse duty cycle also enable low-power infrared LED distance of the greatly increased. Common infrared light emitting diodes, power is divided into small power (1 mW - 10mW). Chinese power (20mW - 50mW) and power (50mW - 100mW more) three categories. Use different power infrared LED, the allocation should be driven by the corresponding power control. Figure 2 -2 by the reflected infrared light-emitting diodes to make produce optical modulation, Drivers only need to add the control of a certain frequency pulse voltage.Infrared transmitter and receiver in the way the two kinds of straight, and the second is reflective. Luminescence pointed straight pipe and tube receiver placed in a relatively controlled and fired on the two ends, a certain distance away from the middle; Reflective means luminescent tube and pipe parallel with the receiving peacetime, without always receiving tube light, luminescence only in possession of the infrared light reflected from encountered, the receiving tube received from the reflected infrared before work.2.2 infrared communication basic tenetsCommunication is the use of infrared wavelength of 900 nm-infrared waves from 1000 to serve as an information carrier, through infrared technology between the two close communication and confidentiality of information transmitted. Infrared communication system structure include : part launcher, channel, the receiver part.Launcher source letter issued after the binary signal from the high-frequency modulated infrared LED sent, receiving device regard the reception of high-frequency signals from the infrared receiver tube after receiving further demodulation photoelectric conversion of the original information of a mass communication lose way. Afterwards the former Information received after receiving part of the drive circuit connected to the expected completion of the various functions. To which the modulation coding style pulse width modulation (by changing the pulse width modulated signal PWM) and pulse modulation time (through change the pulse train interval time between the modulation signal PPM) two.(1) Launches : Currently there is a infrared wireless digital communications system sources of information including voice, data, images. Its methods of work for the launch of the receiver can be divided into different layout LOS way (Light-of-Sight , intracardiac way), diffuse (diffuse) mode. LOS way directional, it has good channel characteristics such advantages, but the existence of a "shadow" effect. difficult to achieve roaming function. Roaming means the main features of non-directional, and easy to implement roaming function, but its channel quality is better sometimes LOS way. Transmission of signals required fora few of (the sampling was quantified), the general need for baseband modulation, transmission, modulation, sometimes signal source coding, the above-driven signals from photoelectric converter complete optical signal transmission. Infrared wireless digital communications system and its scope of work-for-fired power distribution, the quality of the communication. While using various methods to improve optical transmitter power, the other using spatial diversity, holographic films and so on so diffuse light for the launch of space optical power evenly distributed.(2) Channel : infrared wireless digital communication channel refers to the transmitters and receivers in the space between. Due to natural light and artificial light sources such as light signals in the context of intervention, and the source - Electrical Equipment, The optical noise and disturbances, infrared wireless digital communications in some occasions, poor quality, At this point needed to channel coding. Infrared wireless communication system, the optical signal reflection, light scattering and background noise and interference effects, Infrared wireless digital channel presence multi-path interference and noise, This is to improve the quality and access for high-speed applications should be addressed. Infrared wireless digital communication channel often used by the major optical components, optical filter, condenser, their role is : plastic, filter, depending on the field transformation, the band division, the lens can be used as launch-ray focusing, the use of optical filters filter out stray light, the use of optical lenses to expand the field of view receiver, able to make use of optical components for the link frequency division multiplexing, etc.. Infrared wireless communication channel optical noise : the natural noise (sunlight) and anthropogenic interference (fluorescent lighting). canbe modulated by the transmission technology such as filters and adding to be addressed.(3) receivers : Channel optical signal from the optical receiver partially photoelectric conversion, In order to remove noise and intersymbol interference and other functions. Infrared wireless digital communications system receiver include optical receiver parts and follow-up sampling, filtering, judgment, quantity, balanced and decoding part. Infrared wireless optical receiver often used amplifier, and called for large-bandwidth, high gain, low noise and low noise, frequency response and channel impulse response matched. To be suppressed by low-frequency noise and human disturbance needs a band-pass filter. To obtain large optical receiver scope and instantaneous field of view, often using spherical optical lens.Wireless communications are a lot of ways, some using infrared communication with the following characteristics :• The high frequency, wave length, and fired the energy concentrated space propagation attenuation coefficient can ensure the effective signal transmission;• infr ared is the invisible light, strong confidentiality and use it as an information carrier. device when there is no visual pollution, it does no harm to the human body;• dissemination without limitation, and there is no question of frequency interference with radio-wave pattern, not on the spectrum resources to the relevant authorities for the application and registration, easy to implement;• has a good point, when the transmission equipment and infrared receiver ports line up straight, deviation of not more than about 15 degrees when infrared devices running the best effect;• through infrared or not bypassed and objects, data transmission, optical path can not be blocked;• currently produce and receive infrared signals in the technology is relatively mature, components small size, low cost production of simple, easy to produce and modulation advantages.2.3 infrared communication code based on the knowledgeUsually, infrared remote control transmitters will signal (pulse binary code) modulation at 38 KHz carrier, After buffer amplified sent to the infrared light-emitting diodes, infrared signals into firing away. Pulse binary code in a variety of formats. One of the most commonly used code is PWM (pulse width modulation code) and the PPM code (Pulse Code Modulation). The former said in a pulse width, pulse indicated 0. The latter pulse width, but the width of code-not the same, the codes represent a bit - and the digits represent narrow 0.Remote coding pulse signal (PPM code as an example) are usually guided by the code, the system code, the anti-code system, a feature code, functional anti-code signal components. Guide the code name for the initial code, by the width of 9 ms and the margin width of 4.5 ms to the low-level components (different remote control systems in the low-level high width of a certain distinction), remote coding used to mark the beginning of pulsed signals. System identification code is also called code, which used to indicate the type of remote control system, in order to distinguish other remote-control system, prevent the remote control system malfunction. Functional code is also called scripts, which represents the corresponding control functions, Receiver of the micro-controller functions under the numerical code to complete the variousfunctions operating. Anti-code system and function codes are anti-system code and the functional code against code Anti-code can be joined to the receiver synchronization transmission process leads to errors. In order to improve performance and reduce interference power consumption, The remote control will be coded pulse frequency of 38 KHz (for the cycle of 26.3 ms) of the carrier signal pulse reshuffle system (PAM), and then sent to the buffer amplified infrared LED, the remote control signal transmitter away.Address code and data codes are composed of different pulse width expressed that the two narrow pulse "0"; 2 pulse width "1"; a narrow pulse width and pulse expressed an "F" is the code addresses "vacant."Is the first part of a group a group of code, each code synchronization between separated. The plan is to enlarge the second half of a group code : a code from 12 AD (the address code plus data code For example, eight address code plus four data code), each with two AD-Pulse's : Pulse said the two "0"; 2 pulse width "1"; a narrow pulse width and pulse expressed an "F" is the code addresses "vacant."Realize fired at each fired at least four groups code, PT2272 only twice in a row to detect the same address code plus data code data will be the code "1" is driven The data should be output to drive margin and VT terminal for synchronous serial.红外遥控系统摘要目前红外数据通信技术是在世界范围内被广泛应用的一种无线连接技术,它也可以被许多软硬件平台所支持。
附录:外文资料翻译外文资料原文:A Virtual Environment for Protective Relaying Evaluationand TestingA. P. Sakis Meliopoulos and George J. CokkinidesAbstract—Protective relaying is a fundamental discipline of power system engineering. At Georgia Tech, we offer three courses that cover protective relaying: an undergraduate course that devotes one-third of the semester on relaying, a graduate courseentitled “Power System Protection,” and a three-and-a- the concepts,theory, and technology associated with protective relaying, we a virtual environment. The virtual environment includes a) a power system simulator, b) a simulator of instrumentation for protective relaying with visualization and animation modules, c) specific protective relay models with visualization and animation modules, and d) interfaces to be performed. We refer to this set of software as the “virtual power system.” The virtual power system permits the in-depth coverage of the protective relaying concepts in minimum time and maximizes student understanding. The tool is not used in a passive way. Indeed, the students actively participate with well-designed projects such as a) design and implementation of multifunctional relays, b) relay testing for specific disturbances, etc. The paper describes the virtual power system organization and “engines,” such as solver, visualization, and animation of protective relays, etc. It also discusses the utilization of this tool in the courses via specific applicationexamples and student assignments.Index Terms—Algebraic companion form, animation, relaying,time-domain simulation, visualization.I. INTRODUCTIONRELAYING the security and reliability of electric power systems. As the technology advances, relaying of the system. It is indisputable that relaying the safety of systems and protection of equipment. Yet, because of the complexity of the system and multiplicity of competing factors, relaying is a challenging discipline.Despite all of the advances in the field, unintended relay operations (misoperations) do occur. Many events of outages and blackouts can be attributed to inappropriate relaying settings, unanticipated system conditions, and inappropriate selection of instrument transformers. Design of relaying schemes strives to anticipate all possible conditions for the purpose of avoiding undesirable operations. Practicing relay engineers utilize a two-step procedure to minimize the possibility of such events. First, in the design phase, comprehensive analyses are utilized to determine the best relaying schemes and settings. Second, if such an event occurs, an exhaustive post-mortem analysis is performed to reveal the root cause of the event and what “was missed” in the design phase. The post-mortem analysis of these events is facilitated with the existing technology of disturbance recordings (via fault disturbance recorders or embedded in numerical relays). This process results in accumulation of experience that passes from one generation of engineers to the next.An important challenge for educators is the training of students tobecome effective protective relaying engineers. Students must be provided with an understanding of relaying technology that encompasses the multiplicity of the relaying functions, communications, protocols, and automation. In addition, a deep understanding of power system operation and behavior during disturbances is necessary for correct relaying applications. In today’s crowded curricula, the challenge is to achieve this training within a very short period of time, for example, one semester. This paper presents an approach to meet this challenge. Specifically, we propose the concept of the virtual power system for the purpose of teaching students the complex topic of protective relaying within a short period of time.The virtual power system approach is possible because of two factors: a) recent developments in software engineering and visualization of power system dynamic responses, and b) the new generation of power system digital-object-oriented relays. Specifically, it is possible to integrate simulation of the power system, visualization, and animation of relay response and relay testing within a virtual environment. This approach permits students to study complex operation of power systems and simultaneously observe relay response with precision and in a short time.The paper is organized as follows: First, a brief description of the virtual power system is provided. Next, the mathematical models to enable the features of the virtual power system are presented together with the modeling approach for relays and relay instrumentation. Finally, few samples of applications of this tool for educational purposes are presented. II. VIRTUAL POWER SYSTEMThe virtual power system integrates a number of application software in a multitasking environment via a unified graphical user interface. The application software includes a) a dynamic power system simulator, b) relay objects, c) relay instrumentation objects, and d) animation and visualization objects. The virtual power system simulation of the system under study;2) ability to modify (or fault) the system under study during the simulation, and immediately observe the effects of thechanges;3) advanced output data visualization options such as animated 2-D or 3-D displays that illustrate the operation of any device in the system under study.The above properties are fundamental for a virtual environment intended for the study of protective relaying. The first property guarantees the uninterrupted operation of the system under study in the same way as in a physical laboratory: once a system assembled, it will continue to operate. The second property guarantees the ability to connect and disconnect devices into the system without interrupting the simulation of the system or to apply disturbances such as a fault. This property duplicates the capability of physical laboratories where one can connect a component to the physical system and observe the reaction immediately (e.g., connecting a new relay to the system and observing the operation of the protective relaying logic, applying a disturbance and observing the transients as well as the relay logic transients, etc.). The third property duplicates the ability to observe the simulated system operation, in a similar way as in a physical laboratory. Unlike the physical laboratorywhere one cannot observe the internal operation of a relay, motor, etc., the virtual power system and animation of the internal “workings” of a relay, motor, etc. This capability to animate and visualize the internal “workings” of a relay, an instrumentation channel, or any other device is based on the MS Windows multidocument-viewarchitecture. Each document object constructs a single solver object, which computations. The simulated system is represented by a set of objects—one for each system device (i.e. generators, motors, transmission lines, relays, etc). The document object can generate any number of view window objects. Two basic view classes are available: a) schematic views and b) result visualization views. Schematic view objects allow the user to define the simulated system connectivity graphically, by manipulating a single line diagram using the mouse. Result visualization views allow the user to observe calculated results in a variety of ways. Several types of result visualization views are supported and will be discussed later.Fig. 1 illustrates the organization of device objects, network solver, and view objects and their interactions. The network solver object is the basic engine that provides the time-domain solution of the device operating conditions. To maintain object orientation, each device is represented with a generalized mathematical model of a specific structure, the algebraic companion form (ACF). The mathematics of the algebraic companion form are described in the next section. Implementationwise, the network solver is an independent background computational thread, allowing both schematic editor and visualization views to be active during the simulation. The network solver continuously updates the operating states of the devicesand “feeds” all other applications, such as visualization views,etc.The network solver speed is user selected, thus allowing speeding-up or slowing-down the visualization and animation speed. The multitasking environment permits system topology changes, device parameter changes, or connection of new devices (motors, faults) to the system during the simulation. In this way, the user can immediately observe the system response in the visualization views.The network solver interfaces with the device objects. This interface requires at minimum three virtual functions:Initialization: The solver calls this function once before the simulation starts. It initializes all device-dependent parameters and models needed during the simulation.Reinitialization: The solver calls this function any time the user modifies any device parameter. Its function is similar to the initialization virtual function.Time step: The solver calls this function at every time step of the time-domain simulation. It transfers the solution from the previous time step to the device object and updates the algebraic companion form of the device for the next time step (see next section “network solver.”) In addition to the above functions, a device object the schematic editor graphical user interface. Specifically,the device diagram can be moved, resized, and copied using the mouse. Also, a function is included in this set, which implements a device parameter editing dialog window which “pops-up” by double clicking o n the device icon. Furthermore,the schematic module interface allows for device icons that reflect thedevice status. For example, a breaker schematic icon can be implemented to indicate the breaker status.Finally, each device class (or a group of device classes) may optionally include a visualization module, consisting of a set of virtual functions that and animation output. The visualization module interface allows for both two-dimensional (2-D) and three-dimensional (3-D) graphics. Presently, 2-D output is implemented via the Windows graphical device interface (GDI) standard. The 3-D output is implemented using the open graphics library (OpenGL). Both 2-D and 3-D outputs generate animated displays, which are dynamically updated by the network solver to reflect the latest device state. The potential applications of 2-D or 3-D animated visualization objects are only limited by the imagination of the developer. These objects can generate photorealistic renderings of electromechanical components that clearly illustrate their internal operation and can be viewed from any desired perspective,slowed down, or paused for better observation.III. NETWORK SOLVERAny power system device is described with a set of algebraicdifferential-integral equations. These equations are obtained directlyfrom the physical construction of the device. It is alwayspossible to cast these equations in the following general formNote that this form includes two sets of equations, which arenamed external equations and internal equations, respectively.The terminal currents appear only in the external equations.Similarly, the device states consist of two sets: external states[i.e., terminal voltages, v(t)] and internal states [i.e. y(t)]. Theset of (1) is consistent in the sense that the number of externalstates and the numberof internal states equals the number of externaland internal equations, respectively.Note that (1) may contain linear and nonlinear terms. Equation(1) is quadratized (i.e., it is converted into a set of quadraticequations by introducing a series of intermediate variables and expressing the nonlinear components in terms of a series of quadratic terms). The resulting equations are integrated using a suitable numerical integration method. Assuming an integration time step is given with a second-order equation of the formwhere , are past (2) is referred to as the algebraic companion form (ACF) of the device model. Note that this form is a generalizationof the resistive companion form (RCF) that is used by the EMTP [3]. The difference is that the RCF is a linear model that represents a linearized equivalent of the device while the ACF is quadratic and represents the detailed model of the device.The network solution is obtained by application of Kirchoff’s current law at each node of the system (connectivity constraints). This procedure results in the set of (3). To these equations, the internal equations are appended resulting to the following set of equations:(3)internal equations of all devices (4)where is a component incidence matrix withif node of component is connected to node otherwise is the vector of terminal currents of component k.Note that (3) correspond one-to-one with the external system states while (4) correspond one-to-one with the internal system states. The vector of component k terminal voltages isrelated to the nodal voltage vector by(5)Upon substitution of device (2), the set of (3) and (4) become a set of quadratic equations (6)where x(t) is thevector of all external and internal system states.These equations are solved using Newton’s method. Specifically,the solution is given by the following expression(7)where is the Jacobian matrix of (6) and are the values ofthe state variables at the previous iteration.IV. RELAY INSTRUMENTATION MODELINGRelays and, in general, IEDs use a system of instrument transformers to scale the power system voltages and currents into instrumentation level voltages and currents. Standard instrumentation level voltages and currents are 67 V or 115 V and 5 A, respectively. These standards were established many years ago to accommodate the electromechanical relays. Today, the instrument transformers are still in use but because modern relays (and IEDs) operate at much lower voltages, it is necessary to apply an additional transformation to the new standard voltages of 10 or 2 V. This means that the modern instrumentation channel consists of typically two transformations and additional wiring and possibly burdens. Fig. 2 illustrates typical instrumentation channels, a voltage channel and a current channel. Note that each component of the instrumentation channel will introduce an error. Of importance is the net error introduced by all of the components of the instrumentation channel. The overallerror can be defined as follows. Let the voltage or current at the power system be and , respectively. An ideal instrumentation channel will generate a waveform at the output of the channel that will be an exact replica of the waveform at the power system. If the nominal transformation ratio is and for the voltage and current instrumentation channels, respectively, then the output of an “ideal” system and the instrumentation channel error will bewherethe subscript “out” refers to the actual output of the instrumentation channel. The error waveforms can be analyzed to provide the rms value of the error, the phase error, etc.Any relaying course should include the study of instrumentation channels. The virtual power system is used to study the instrumentation error by including an appropriate model of the entire instrumentation channel. It is important to model the saturation characteristics of CTs and PTs, resonant circuits of CCVTs, etc. (see [6]). In the virtual power system, models of instrumentation channel components developed. The resulting integrated model provides, with precision, the instrumentation channel error.With the use of animation methods, one can study the evolution of instrumentation errors during transients as well as normal operation.V. PROTECTIVE RELAY MODELINGToday, all new relays are numerical relays. These types of relays can be easily modeled within the virtual power system. Consider, for example, a directional relay. The operation of this relay is based on the phase angle between the polarizing voltage and the current. Modeling of this relay then requires that the phase angle between the polarizing voltage and the current be computed. For this purpose, as the power system simulation progresses, the relay model retrieves the instantaneous values of the polarizing voltage and the current. A Fourier transform is applied to the retrieved data (a running time Fourier transform over a user-specified time window). The result will be the phasors of the polarizing voltage and current from which the phase angles are retrieved. The directional element of the relay will trip if the phase angle difference is within the operatingregion. It should be also self understood that if the relay to be modeled be also included in the model.It is important that students be also involved in the design of numerical relays. A typical semester project is to define the functionality of a specific relay and a set of test cases. The student assignment is to develop the code that will mimic the operation of the relay and demonstrate its correct operation for the test cases.The new technology of the virtual power system offers another more practical way to model relays. The virtual power system uses object-oriented programming. As such, it is an open architecture and can accept dynamic link libraries of third parties. A natural extension of the work reported in this paper is to use this feature to interface with commercially available digital “relays.” The word “relay” is in quotation marks to indicate that the relay is simply a digital program that takes inputs of voltages and currents, performs an analysis of these data, applies logic, and issues a decision. This program is an object and can be converted into a dynamic link library. If this DLL is “linked” with the virtual power system, in the sense that the inputs come from the virtual power system, then the specific relay can be evaluated within the virtual environment. The technology for this approach is presently available. Yet, our experience is that relay manufacturers are not presently perceptive in making their “relay” objects available as DLLs that can be interfaced with third-party software.VI. APPLICATIONSThe described virtual environment used in a variety of educationalassignments. The possible uses are only limited by the imagination of the educator. In this section, we describe a small number of educational application examples.Figs. 3 and 4 illustrate an exercise of studying instrumentation channel performance. Fig. 3 illustrates an example integrated model of a simple power system and the model of an instrumentation channel (voltage). The instrumentation channel consists of a PT, a length of control cable, an attenuator, and an AD converter (Fig. 3 illustrates the icons of these components and their interconnection). Fig. 4 illustrates two waveforms: the voltage of phase A of the power system when it is experiencing a fault and the error of the instrumentation channel. The upper part of the figure illustrates the actual voltage of Phase A and the output of the instrumentation channel (multiplied by the nominal transformation ratio). The two traces are quite close. The lower part of the figure illustrates the error between the two waveforms of the upper part of the figure. The two curves illustrate the normalized error at the input of the AD converter and at the output of the AD converter. The figure is self-explanatory and a substantial error occurs during the transient of the fault. When the transients subside, the error of the instrumentation channel is relatively small. The intention of this exercise is to study the effects of different parameters of the instrumentation channel.For example, the students can change the length of the control cable and observe the impact on the error. Or in case of a current channel, they can observe the effects of CT saturation on the error of the instrumentation channel, etc.Fig. 5 illustrates the basics of an example application of the virtualpower system for visualization and animation of a modified impedance relay. The example system consists of a generator, a transmission line, a step-down transformer, a passive electric load (constant impedance load), an induction motor, and a mechanical load of the motor (fan). A modified distance relay (mho relay) monitors the transmission line. The operation of thi s relay is based on the apparent impedance that the relay “sees” and the trajectory of this impedance.The visualization object of this relay displays what the relay “sees” during a disturbance in the system and superimposes this information on the relay settings. Typical examples are illustrated in Figs. 6 and 7. The relay monitors the three-phase voltages and currents at the point of its application. The animation model retrieves the information that the relay monitors from the simulator at each time step. Subsequently, it computes the phasors of the voltages and currents as well as the sequence components of these voltages and currents. Fig. 6 illustrates a 2-D visualization of the operation of this relay over a period that encompasses a combined event of an induction motor startup followed by a single-phase fault on the shows the voltages and currents “seen” by the relay(the snapshot is after the fault cleared). The graph also shows the trajectory (” by the relay. The graph shows the trajectory “seen” o ver a user-specified time interval preceding present time. The impedance trajectory is superimposed on the trip characteristics of this relay. In this case, the impedance trajectory does not visit the trip “region” of the relay.Fig. 7 provides the recorded impedance trajectory for the combined event of an induction motor startup followed by a three-phase fault nearthe low-voltage bus of the transformer. The impedance trajectory is superimposed on the trip characteristics of this relay. In this case, the i mpedance trajectory does visit the trip “region” of the relay. This example can be extended to more advanced topics. For example, the animated display may also include stability limits for the “swing” of the generator. For this purpose, the stability limits for the particular condition must be computed and displayed.This exercise can be the topic of a term project.Another important protective relaying example is the differential relay. In this example, we present the animated operation of a differential relay scheme for a delta-wye connected transformer with tap changing under load. The example system is shown in Fig. 8. It consists of an equivalent source, a transmission line, a 30-MVA delta-wye connected transformer, a distribution line, and an electric load. A transformer differential relay Fig.7. Animation of a mho relay for a three phase fault on the 13.8-kV bus. is protecting the transformer. The differential relay of a differential relay visualization is shown in Fig. 9 based on the electromechanical equivalent relay. Note that the 2-D visualization shows the “operating” coils and “restraining” coils and the currents that flow in these coils at any instant of time. Instantaneous values, rms values, and phasor displays are displayed. Fig. 9 illustrates one snapshot of the system. In reality, as the system operation progresses, this figure is continuously updated, providing an animation effect. The system may operate under steady-state or under transient conditions. The effects of tap changing on the operation of the relay are demonstrated. The importance of this animation module is that one can study the effects of various parameters and phenomena on theoperation of the relay. Examples are: a) effects of tap setting. The differential relay settings are typically selected for the nominal tap setting. As the tap setting changes under load, the current in the operating coil changes and may be nonzero even under normal operating conditions. It is very easy to change the tap setting andobserve the operation of the relay in an animated fashion. It is also easy to observe the operation of the relay during a through fault for different values of tap settings. Thus, this tool is very useful in determining the optimal level of percent restraint for the relay. b) effects of inrush currents. One can perform energization simulations of the transformer by various types of breaker-closing schemes. Since the transformer model includes the nonlinear magnetization model of the transformer core, the magnetization inrush currents will appear in the terminals of the transformer and, therefore, in the differential relay. The display of Fig. 9 provides a full picture of the evolution of the electric currents. One can study the effects of inrush currents by bypassing the even study these phenomena indepth and in very short time with the aid of animation and visualization methods.The virtual power system also used for testing of physical relays. This application is quite simple. The virtual power system COMTRADE format. Then, the COMTRADE file is fed into commercial equipment that generates the actual voltages and currents and feeds them into the physical relays. The actual response of the relays is then observed. This application was performed on the premises of a utility with limited access to students.Recently, a major relay manufacturer (SEL) the process of setting upthe laboratory for routine use of this function by students. There are numerous other applications of the proposed virtual power system. The pedagogical objective is to instill a deep understanding of protective relaying concepts and problems in the very short time of one semester. The effectiveness of the proposed approach increases as new examples are generated and stored in the database.Aclassical example that demonstrates the effectiveness of the virtual power system is the issue of sympathetic tripping. Usually, this topic requires several lectures and long examples. With the virtual power system, one can very thoroughly teach the concept of sympathetic tripping within onelecture. For example, a simple system with mutually coupled lines can be prepared, with relays at the ends of all lines. Then with a fault in one line, the relays of the be visualized and animated. The students can observe that the relays of the another line. And more important, the students can make changes to the designs of the lines and observe the relative effect of design parameters on induced voltages and currents, etc.VII. CONCLUSIONThis paper for visualization and animation of protective relaying. The virtual power system the instruction of protective relaying courses. It is also an excellent tool for assigning term projects on various aspects of protective relaying. One important feature of the tool is that the user can apply disturbances to the system while the system operates (i.e., faults, load shedding, motor start-up, etc.). The response of the relays is instantaneously observed. The paper a multitasking environment.The paper and animation of instrumentation channel error, b)impedance relay, and c) a transformer differential relay. From these examples, it is clear that virtual laboratories can be quite beneficial from the educational point of view as they can provide insight of the system under study that are impossible in a physical laboratory. In addition, the virtual power system is valuable for testing commercially available digital relays with appropriate interfaces between the virtual power system and the numerical relay software.The effectiveness of this approach assessed informally with discussions with students and evaluation of the term projects. The response is positive and enthusiastic (for example, two of the term project reports were over 100 pages long and the content reflected an excellent understanding of protective relaying concepts and technology). We plan to conduct formal evaluation of the approach by the students.The tool is continuously under development as additional relay functions and animation and visualization objects of various protective relay functions are being developed. This task is open ended because of the plethora of existing power system relaying devices and possible ways to visualize and animate their functions. There is also a multiplicity of term projects that can be designed and assigned to students with the virtual power system as the basic tool. We also plan to make this tool available to power educators. Presently, the tool is posted on the course web site, when the course is offered. The web site is terminated when the course is completed. In the next offering of the course, the web site will be made permanent and accessible to power educators.附录1 外文资料译文。