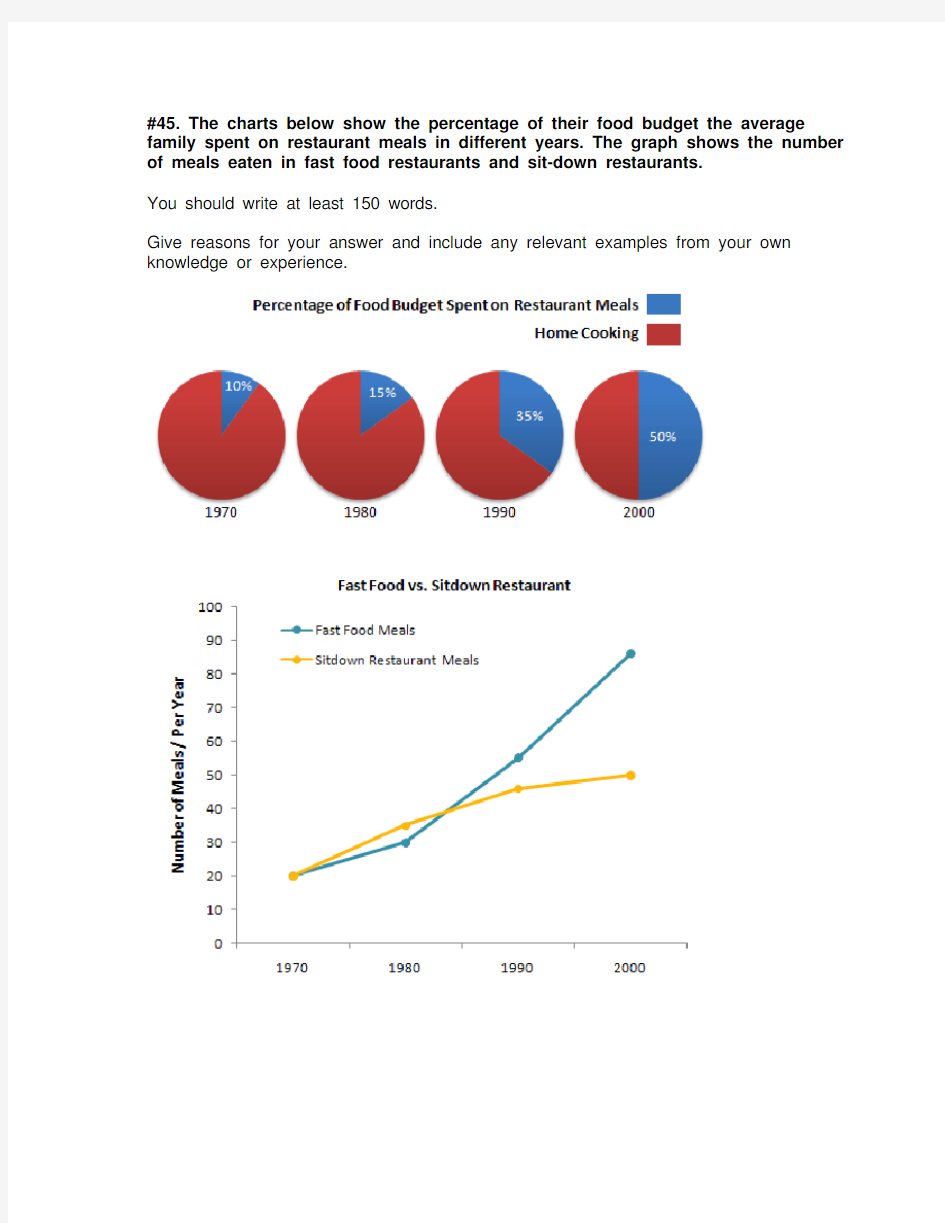
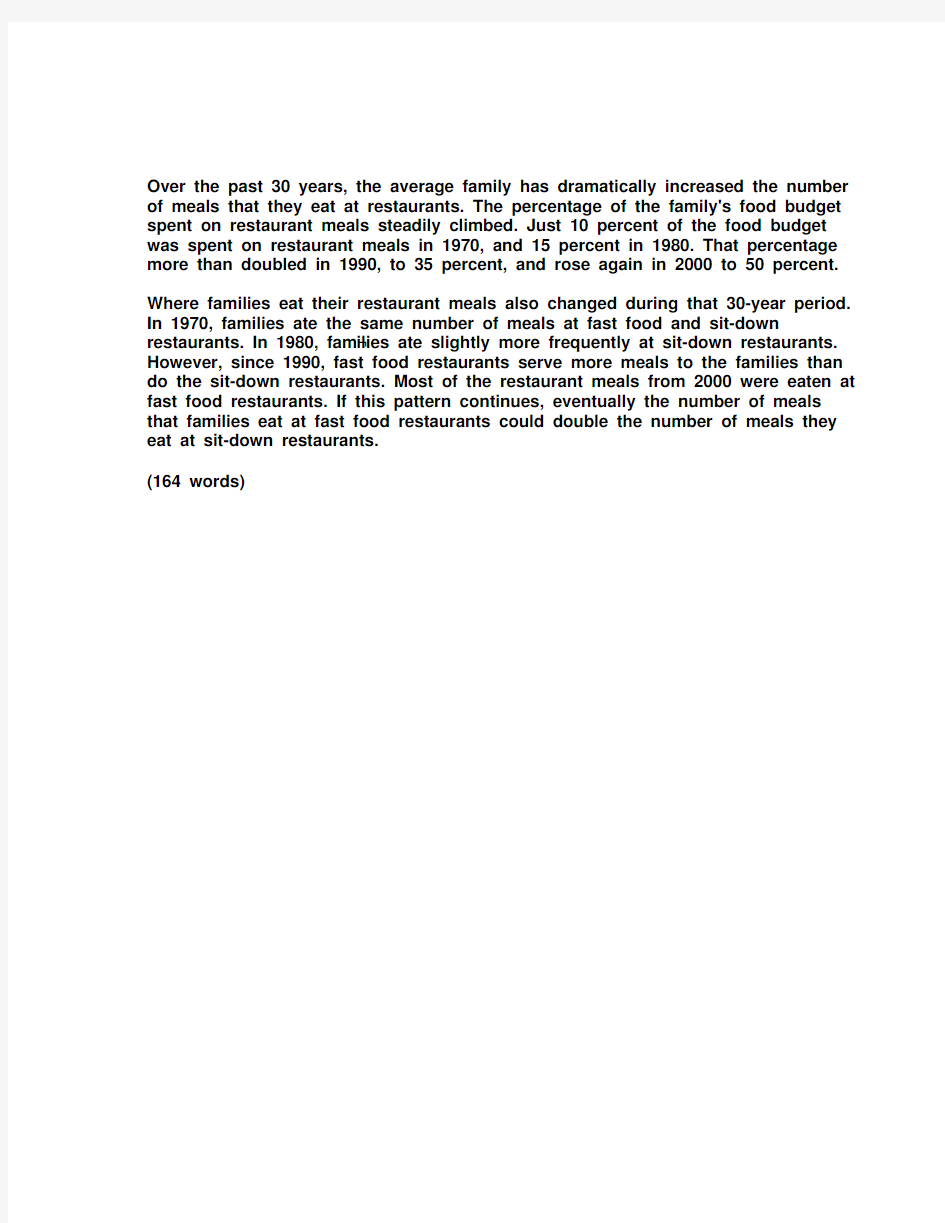
#45. The charts below show the percentage of their food budget the average family spent on restaurant meals in different years. The graph shows the number of meals eaten in fast food restaurants and sit-down restaurants.
You should write at least 150 words.
Give reasons for your answer and include any relevant examples from your own knowledge or experience.
Over the past 30 years, the average family has dramatically increased the number of meals that they eat at restaurants. The percentage of the family's food budget spent on restaurant meals steadily climbed. Just 10 percent of the food budget was spent on restaurant meals in 1970, and 15 percent in 1980. That percentage more than doubled in 1990, to 35 percent, and rose again in 2000 to 50 percent. Where families eat their restaurant meals also changed during that 30-year period. In 1970, families ate the same number of meals at fast food and sit-down restaurants. In 1980, fam?ilies ate slightly more frequently at sit-down restaurants. However, since 1990, fast food restaurants serve more meals to the families than do the sit-down restaurants. Most of the restaurant meals from 2000 were eaten at fast food restaurants. If this pattern continues, eventually the number of meals that families eat at fast food restaurants could double the number of meals they eat at sit-down restaurants.
(164 words)
#44. You should spend about 20 minutes on this task.
The map below is of the town of Garlsdon. A new supermarket (S) is planned for the town. The map shows two possible sites for the supermarket.
Summarise the information by selecting and reporting the main features, and make comparisons where relevant.
You should write at least 150 words
model answer:
The first potential location (S1) is outside the town itself, and is sited just off the main road to the town of Hindon, lying 12 kms to the north-west. This site is in the countryside and so would be able to accommodate a lot of car parking. This would make it accessable to shoppers from both Hindon and Garlsdon who could travel by car. As it is also close to the railway line linking the who towns to Cransdon (25 km to the south-east), a potentially large number of shoppers would also be able to travel by train.
In contrast, the suggested location, S2, is right in the town centre, which would be
good for local residents. Theorically the store could be accessed by road or rail from the surrounding towns, including Bransdon, but as the central area is a no-traffic zone, cars would be unable to park and access would be difficult. Overall, neither site is appropriate for all the towns, but for customers in Cransdon, Hindon and Garlsdon, the out-of-town site (S1) would probably offer more advantages.
(179 words)
# 43. You should spend about 20 minutes on this task.
The table below shows CO2 emissions for different forms of transport in the European Union.
The Pie Chart shows the percentage of European Union funds being spent on different forms of transport.
You should write at least 150 words.
model answer:
The chart shows CO2 emissions per passenger kilometre for variuos methods of transport in the European Union while the pie chart shows European Union spending on transport. Flying by air produces by far the greatest CO2 emissions, approximately three times as much as passenger cars which are the next largest producers. Very little is spent by the EU on air travel while roads make up more than half of the EU transport budget.
Trains produce about three times less CO2 emissions per passenger kilometre than passenger cars and eight times less than air travel. Nearly a third of EU transport funds are spent on railways.
Ships are a clean form of transport and produce about the same amount of CO2 per passenger kilometre as trains do. However, only 2 percent of EU funds are spent on ports. A further one percent is spent on inland waterways.
Coaches are the cleanest form of transport. Emissions of CO2 per passenger kilometre from coaches are half those of buses. Buses emit less than half as much CO2 per passenger kilometre as cars. The European Union spends 10 percent of its transport budget on public transport, such as buses and coaches. (197 words)
The table below shows the sales at a small restaurant in a downtown business district.
Summarize the information by selecting and reporting the main features, and make comparisons where relevant.
You should write at least 150 words.
Give reasons for your answer and include any relevant examples from your own knowledge or experience.
model answer:
The sales at this small restaurant during the week of October 7 to 13th followed a fairly set pattern from Monday to Friday, and then showed notable shift on the weekend. The lunch and dinner sales during the week peaked on Friday and then dipper down as the weekend set in.
During the week of October 7-14th, the lunch sales averaged at approximately $2,400. The highest lunch sales occurred on Friday, and the lowest occurred on Sunday. Sunday's lunch sales were approximately $1,000 less than the average lunch sales during the rest of the week.
Dinner sales, which generated at least $1,000 to $1,500 more a day than lunch sales, also remained steady during the week. Just like the lunch sales, the dinner sales peak on Friday and dipped down for the weekend.
Excluding Wednesday and Thursday, the lunch and dinner sales from October 7-11 rose gradually until the end of the business week. Midweek, on Wednesday and Thursday, the sales were slightly lower than they were on Tuesday.
According to the sales report, this restaurant has a steady lunch and dinner crowd. The most profitable day during the second week of October was Friday. Sunday, was the least prof?itable day, with the full day's sales totaling/totalling less than the Friday dinner sales. These numbers are reflective of a restaurant that is located in a business/financial district where business hours are Monday through Friday.
In June 1996, an experimental flu vaccine was trialled in a large country town on females only.
Summarise the information by selecting and reporting the main features, and make comparisons where relevant.
You should write at least 150 words.
Give reasons for your answer and include any relevant examples from your own knowledge or experience.
model answer:
The diagrams show data for a flu epidemic which hit a large country town in 1996. Figure 1 gives the number of persons who died; Figure 2 shows the percentage breakdown of females who received a new flu vaccine; and Figure 3 gives the number of cases of flu before and during the epidemic.
In Figure 1 it can be seen that the flu was responsible for the deaths of 2 females but no males in the period from March to May. However, from June to August, there were 4 female deaths and 1 male death.
According to the pie chart in Figure 2, only those females most at risk were given the new flu vaccine; 28% did not take part in the trial. Of those females who took part, 35% were aged (over 65 years old); 24% were babies or children; and 13% were either hospitalised or receiving other medical attention.
From Figure 3 it is clear that the new vaccine had a positive effect on the number of new cases of flu reported in females. There were just over 1000 cases reported in March, climbing rapidly to a peak of 3500 in June. Thereafter, the number of cases dropped slowly to about 2800 in August, before levelling off at 2500 for the rest of the year. For males, the figures were lower but showed a similar trend throughout the epidemic.
(232 words)
#39. You should spend about 20 minutes on this task.
The chart below shows estimated world literacy rates by region and by gender for the year 2000.
Write a report for a university lecturer describing the information below.
You should write at least 150 words.
model answer:
In this report I will describe a bar chart that shows the estimated world illiteracy rates by gender and region for the year 2000.
First I will look at male illiteracy for the 6 areas shown. The lowest rates were in Developed Countries, Latin America/Caribbean and East Asia/Oceania with rates of 1% (approximately), 10% and 8% (approximately) respectively. The rates for the next three areas were much higher and quite similar to each other. Sub-Saharan Africa, the Arab States and South Asia had rates of approximately 31%, 29% and 34%.
Female illiteracy was much higher relatively in each area except Latin
America/Caribbean where it was only slightly higher. The lowest rates for female illiteracy were again Developed Countries, Latin America/Caribbean and East Asia/Oceania with rates of approximately 2%, 12% and 20%. Again the rates for the next three areas were much higher and quite similar to each other. Sub-Saharan Africa, the Arab States and South Asia had rates of approximately 48%, 52% and 56%.This ends my report.
# 38. You should spend about 20 minutes on this task.
The chart shows the number of mobile phones and landlines per 100 people in selected countries.
Write a report for a university lecturer describing the information given.
You should write at least 150 words.
model answer:
The graph shows the number of mobile phones and landlines per 100 users, for selected countries. Overall, most of the countries included in the graph have more mobile phones subscribers than landlines.
Most European countries have high mobile phone use. The biggest users of mobile phones are the Italians, with 88 cell phones per 100 people. For example, Italy has twice as many mobile phones as landlines, with 88 mobiles per hundred people compared to 45 for landlines. Mobile phone use is low in Canada, with fewer than 40 phones per 100 people. Denmark is also unusual because it has slightly more landlines than mobile phones.
However, in some countries, the number of landlines is higher than the number of mobile phones. One example is the USA, where the number of mobiles, at 50 per 100 people, is much lower than the number of landlines, at almost 70 per hundred.
A similar pattern can be seen in Canada. The highest number of landlines in the graph is in Denmark, with about 90 per 100 people. In contrast, the lowest figures for fixed lines are in Italy and the UK.
In conclusion, it seems that mobile phone use is higher in Europe than in North America.
# 37. You should spend about 20 minutes on this task.
The graphs show enrolment in different colleges in the Higher Colleges of Technology in 1999.
Write a total of 150 - 200 words about the information in the three graphs. Write a report for a university lecturer describing the information given. You should write at least 150 words
model answer:
The charts shows student enrolment by gender and level in different colleges of the Higher Colleges of Technology colleges in the UAE.
There are clear differences in male and female enrolment. Females outnumber men in all the colleges, with almost 25% more students in Dubai Women's college than in Dubai Men's. Ras Al-Khaimah Women's College has almost 180 students, compared to only 100 in the Men's college.
Females also outnumber males by level, with almost double the number of men at Higher Diploma level (330 compared to 181). Only at Diploma level does the number of men slightly exceed that of women.
Over half the students are in Certificate level, with less than a quarter at Higher Diploma or Bachelor level.
In conclusion, most students in the Higher Colleges are enrolled at Diploma level or below, and the majority of students are women.
(143 words)
# 36. You should spend about 20 minutes on this task.
The line graph below shows the number of annual visits to Australia by overseas residents. The table below gives information on the country of origin where the visitors came from. Write a report for a university lecturer describing the information given.
You should write at least 150 words.
NUMBER OF VISITORS (million)
1975 2005
SOUTH KOREA
JAPAN
CHINA
USA
BRITAIN
EUROPE 2.9
3.2
0.3
0.4
0.9
1.1
9.1
12.0
0.8
1.1
2.9
4.5
Total 8.8 30.4
model answer:
The given line graph illustrates information on the number of overseas visitors traveling to Australia in millions of people. Overall, one notable trend seems to be that Australia has steadily become more popular as a destination spot. For example, there were 20 million more visitors to Australia in 2005 than in 1975. That's a jump from 10 million to 30 million in 20 years.
The second table gives statistics showing the countries whose residents went to Australia between 1975 and 2005. In both years, the largest number of visitors came from Japan, followed by South Korea and Europe. Britain, the United States and China also had many people traveling to Australia in these years. In fact, the number of people visiting Australia grew in every one of these countries. For example, in 2005, 12 million people went there from Japan compared with only 3.2 million in 1975.
(147 words)
#35. You should spend about 20 minutes on this task.
The table below shows the consumer durables (telephone, refrigerator, etc.) owned in Britain from 1972 to 1983.
Write a report for a university lecturer describing the information shown below. You should write at least 150 words.
Consumer
1972 1974 1976 1978 1979 1981 1982 1983 durables
Percentage of
households with:
central heating 39 43 48 52 55 59 60 64
television 93 95 96 96 97 97 97 98
video 18
vacuum cleaner 87 89 92 92 93 94 95
refrigerator 73 81 88 91 92 93 93 94
washing
66 68 71 75 74 78 79 80 machine
dishwasher 3 3 4 4 5
telephone 42 50 54 60 67 75 76 77 model answer:
The chart shows that the percentage of British households with a range of consumer durables steadily increased between 1972 and 1983. The greatest increase was in telephone ownership, rising from 42% in 1972 to 77% in 1983. Next came centralheating ownership, rising from 37% of households in 1972 to 64% in 1983. The percentage of households with a refrigerator rose 2 1% over the same period and of those with a washing machine by 14%. Households with vacuum-cleaners. televisions and dishwashers increased by 8%, 5% and 2% respectively. In 1983. the year of their introduction, 18% of households had a video recorder.
The significant social changes reflected in the statistics are that over the period the proportion of British houses with central heating rose from one to two thuds, and of those with a phone from under a half to over three-quarters. Together with the big increases in the ownership of washing machines and refrigerators, they are evidence of both rising living standards and the trend to lifestyles based on comfort and convenience.
#34. You should spend about 20 minutes on this task.
The table below shows the figures for imprisonment in five countries between 1930 and 1980.
Write a report for a university, lecturer describing the information shown below. You should write at least 150 words
model answer:
The table shows that the figures for imprisonment in the five countries mentioned indicate no overall pattern of increase or decrease. In fact there is considerable fluctuation from country to country.
In Great Britain the numbers in prison have increased steadily from 30 000 in 1930 to 80,000 in 1980. On the other hand in Australia, and particularly in New Zealand the numbers fell markedly from 1930 to 1940. Since then they have increased gradually, apart from in 1980 when the numbers in prison in New Zealand fell by about 30,000 from the 1970 total. Canada is the only country in which the numbers in prison have decreased over the period 1930 to 1980, although there have been fluctuations in this trend. The figures for the United States indicate the greatest number of prisoners compared to the other four countries but population size needs to be taken into account in this analysis. The prison population in the United States increased rapidly from 1970 to 1980 and this must be a worrying trend.
雅思图表作文经典句型 一.上升增长 1.…add up to…增加了 e.g. The total amount of …added up to 14 billion pounds(14%) in 1994. 2.to jump to / to soar to.. 一跃达到/ 猛增到… e.g. The total working days lost soaredto 10 million in 1979. 3.…an increase of about…percent as compared with.. 与…相比大约增加了… e.g. In August as many as 39 car accidents were reported, indicating an increase of about 79% as compared with the number of January. 4.…to experience an increase/incline …有了增长 e.g. Tobacco consumption is experiencing an incline. 二.下降,减少 1.…to sink/drop/reduce to…减少到… e.g. The rate of strikes sank/dropped to the lowest point in 1979. 2.…to experience a decrease/decline …有了减少 e.g. Tobacco consumption is experiencing a decrease. 注意:
雅思7分大作文范文批改和解析 距离雅思写作7分你大概还有3个步骤要走,是的,不是谁都可以轻轻松松活动雅思高分的。今天给大家带来了雅思7分大作范文批改和解析,希望能够帮助到大家,一起来学习吧。 雅思7分大作范文批改和解析 雅思写作提高第一步:结构(5.0 - 5.5) 问题:出国留学的优点(the advantages of disadvantages of study abroad) 同学:One reason for those who decide to go overseas to get a higher degree is that they believe they can get better education in certain fields. That is to say, different universities in different countries have their specialized courses and rich resources can be provided according to their needs and requirements. Another reason is that they can learn a foreign language in a more efficient way. There is no denying that living in an all-round English environment and being affected by local culture make people quick learners. 解析:出国留学和高学历完全是两回事(出去读初中和高中都算出国);出国就是better education,在国内就不是better? 出
科技类future for humans' robots are very important 1.Some people think that development. Others, however, think that robots are a dangerous invention that could have negative effects on society. Discuss both views and give your opinion. The field of science and technology has advanced throughout the past decades and has changed our perspectives of life. Among those advancements, robots have become significant by trying to get close to human lives. While some people argue that though these robots have managed to solve most of our day-are robots I believe that create to-day problems, they can still problems, significant for humans' current and future development.It is normal for people to be worried about the rise of robotics in every aspects of our lives. In workplace, one of the real impacts humans face is the loss of jobs and the economic displacement of workers. As prices continue to
# 43. You should spend about 20 minutes on this task. The table below shows CO2 emissions for different forms of transport in the European Union. The Pie Chart shows the percentage of European Union funds being spent on different forms of transport. You should write at least 150 words.
model answer: The chart shows CO2 emissions per passenger kilometre for variuos methods of transport in the European Union while the pie chart shows European Union spending on transport. Flying by air produces by far the greatest CO2 emissions, approximately three times as much as passenger cars which are the next largest producers. Very little is spent by the EU on air travel while roads make up more than half of the EU transport budget. Trains produce about three times less CO2 emissions per passenger kilometre than passenger cars and eight times less than air travel. Nearly a third of EU transport funds are spent on railways. Ships are a clean form of transport and produce about the same amount of CO2 per passenger kilometre as trains do. However, only 2 percent of EU funds are spent on ports. A further one percent is spent on inland waterways. Coaches are the cleanest form of transport. Emissions of CO2 per passenger kilometre from coaches are half those of buses. Buses emit less than half as much CO2 per passenger kilometre as cars. The European Union spends 10 percent of its transport budget on public transport, such as buses and coaches. (197 words)
1 起伏不定go up and down / fluctuate/ be unstable/ be in flexible 2 The first point to note is the huge increase in the number of 需要注意的第一点就是…的急剧增 长 3 The statistics show that 这些数据表明 4 占百分之几 Form/comprise/make up/constitute/ account for ….percent 5 This graph describes the trend of 该图描述了…的趋势
6 The statistics lead us to the conclusion that 由这些数据,我们可以做出如下结论 8 增加:Increase / raise / rise / go up/ soar/ ascend/ mount/ climb 9 减少:Decrease / go down / drop / fall/ reduce/ descend/ shrink /decline/sink 10 稳定:Remain stable / stabilize / level off/ remain unchanged 11 It can be seen from the table that 由表格我们可以看出 12 The table shows the changes in the number of… over the period from…to… 该表格展示了从…到…数据的变化
G类雅思7分作文范文 Topic Some people say that older people should live with their adult children. Others say that they shouldn't. Which do you think is good practice. TEXT(257 Words) One of the topics in daily life is whether or not the older people should live with their adult children. My answer is the question is that it is better for them not to. Firstly, people of different ages have different ways of life. The old people like a quiet, peaceful and regular life whereas the young prefer noises, activities and unrestrained enjoyment. If they live together, old may feel that they are always disturbed and the young may feel that they are often handicapped. Secondly, people of different generations have different views and values. What is quite normal to the parents may seem to be old-fashioned or wrong to the children. When they live together, they may disagree on matters ranging from minor domestic matters to national and international issues. Consequently, family life may be unpleasant or even unbearable to both the old and the young. Last but not the least, adult children, like their parents, love independence and freedom, but their parents still take them as children and unintentionally interfere in their affairs. The situation will be worse if the adult children are already married. In this case, the children have already built a new and closed world and any outside interference may lead to conflicts. From what has been discussed above, we may safely draw the conclusion that if the parents and their adult children do not live together, both the old and the young can enjoy complete independence and freedom, live a life they like, and keep intact their affections for each other 雅思范文:电脑是否现代教育所必须? 成因 You should spend about 40 minutes on this task. Present a written argument or case to an educated non-specialist audience on the following topic. Are computers an essential feature of modern education? What subjects can be better taught using computers? Are there aspects of a good education that cannot be taught using computers? You should write at least 250 words. 提示 You should you your own ideas, knowledge and experience and support your arguments with examples and relevant evidence. Topic words: Computers Essential features / absolutely necessary Modern education / good education Task words: There are no specific task words. Three separate questions are given. Questions I should ask myself: Do I think computers are essential for education? What subjects do I think are best be learnt using computers? What do I think are the features of a good education, and are computers important in it?
最新雅思图表小作文范文品读 最新雅思图表小作文范文品读,今天就给大家带来了最新雅思图表小作文范文品读,希望能够帮助到大家,下面就和大家分享,来欣赏一下吧。 最新雅思图表小作文范文品读混合图之成人教育现状 The charts below show the results of a survey of adult education. The first chart shows the reasons why adults decide to study. The pie chart shows how people think the costs of adult education should be shared.Write a report for a university lecturer, describing the information shown above.Write at least 150 Words. 图表展示的是成人继续接受教育培训的理由,以及它的费用该由谁来承担的调查统计。请为大学讲座写一篇150字以上的报告。 雅思图表小作文混合图(线图+饼图)9分范文: The summary of a survey on adult education is presented in the 2 charts. The bar chart summarizes the factors that caused adults to continue their education, while the pie chart shows the public opinion regarding the funding of adult education.(简要概括导入)
英语考试作文 9分雅思图表写作范文全集之地图篇学校 变迁 9分雅思图表小作文范文全集之地图学校变迁The diagrams below show the site of a school in 2004 and the plan for changes to the school site in 2024. 真题传送门:2017全年雅思写作真题范文大汇总(第一时间更新) 范文集结:全部9篇9分雅思写作地图范文汇总放送 范文 The two pictures compare the layout of a school as it was in the year 2004 with a proposed site design for the year 2024. It is clear that the main change for 2024 involves the addition of a new school building. The school will then be able to accommodate a considerably larger number of students. In 2004, there were 600 pupils attending the school,
and the two school buildings were separated by a path running from the main entrance to the sports field. By 2024, it is expected that there will be 1000 pupils, and a third building will have been constructed. Furthermore, the plan is to join the two original buildings together, creating a shorter path that links the buildings only. As the third building and a second car park will be built on the site of the original sports field, a new, smaller sports field will need to be laid. A new road will also be built from the main entrance to the second car park. Finally, no changes will be made to the main entrance and original car park. (183 words, band 9)
雅思写作满分范文:雅思图表作文怎样才能拿满分 The table below gives information on consumer spending on different items in five different countries in 2002. Percentage of national consumer expenditure by category - 2002 构思过程: I know that I can write a short introduction by paraphrasing the question. I look for an overall trend. I can see that the food/drinks/tobacco category has the highest percentages, and leisure/education has the lowest. Now I want to write two main body paragraphs. I need to select something to say about each country. Remember, there is no rule about what information you select; everyone will do this differently. I look for the highest figures in each category: I can see that Turkey has the highest figure for food/drinks/tobacco AND for education/leisure. Italy has the highest figure for clothing/footwear. So, I'll write a paragraph about Turkey and Italy. My final paragraph needs to talk about Ireland, Spain and Sweden. Maybe I'll point out that Ireland has a high figure for the first category, Spain has the lowest figure for education/leisure, and Sweden has the lowest figures for the first AND second categories.
雅思图表作文数据描述例句 表示上升和下降的说法: 1.The proportion of the people who were divorced went up from 2.5% in 1981 to 7.5% in 1991, rising further to 8% in 2001. 2.The crop yields worldwide in 1990 were 15% up on those of 1985. 3. The number of shoppers during the Christmas period plunged by up to 23 per cent since then on. 4. After five years of steady decline, the high-school drop-out rate started to rise. 5. Oil consumption grew steadily from 1980 to 2000, apart from in 1990, when there was a drop of 5 per cent. 6. House prices fell as much as 40% between 1980 and 1985, compared with the period 1986 to 1990, when prices roughly doubled. 7. Arable land was being lost at the rate of over 38 thousand square miles per year throughout the 1980s. 8. Exports topped $10 billion in 2006, with those to Asia Pacific in excess of $2 billion. 9. The smoking rate in young girls was on the rise, similar to that among adult women. 10. Motorcycle casualities were in decline, down from a total of 54,037 in 1995 to 38,090 in 2000. 11. Gender equality would lead to 13.4 million fewer homeless children, a 13% reduction. 12. Inflation is likely to moderate through the early months of 2007. 13. The number of married couples showed a significant decline, accounting for 50.7% of the adult population, compared with 68% in 1971. 14. The smaller gap between movie-goers and television viewers reflected a 5% drop in the number of people who g to the cinema and a 1.2% increase in those who enjoy watching TV at home. 表示占据的说法: 15. Volunteers constitute nearly half of the work force of the health care sector. 16. While Asians account for 11% of the American population, Hispanics comprise 8%. 17. Women make up 52 % of the population of Britain.\18. 18. Landfill is composed of 36% municipal waste, 24% commercial and industrial waste and 40% construction waste. 表示倍数的说法: 19. Rent as a percentage of the household expenditure more than doubled between 1974 and 1998, from 5% to 12%. 20. Britons were twice as likely to die from hear attacks as Italians and three times as Chinese. 21. Women working as childminders in the under-35 age group in 1995 were almost twice as many as in 1990. 22. Television was twice as popular as washing machine in 1990, with close to 10% of households owning one TV set at home. 23. Young people used the Internet more than three times as often as the general population in 1999. 24. The study found that people who earned more than $100,000 received nearly 50% more junk mails than lower carners. 25. It also found that those on higher incomes lost on average four times more money than other victims in property-related crime. 26. China’s agricultural trade deficit against US jumped 1.5 times to $ 35 billion over the five-year period. 读数据的方法: 27. A quarter of the customers were African origin. 28. Some 700 migrants arrived to live in Australia every week in 2005. 29. Of course UK residents who traveled overseas, some 210,000 went to America. 30. The overall UK population was some 58 million in 2001, 17% higher than in 1951. 31. With an estimated 100 million international migrants worldwide, the proportion of people living outside their country of birth approached 2% of the world’s population in 2002.
Task:Some people think getting old is entirely bad. However, others think that life of the elderly in modern world is much easier than in the past. Discuss both views and give your own opinion. 思路解析: 2016年雅思收官之战的作文来了一道新题,问当今社会老年人的生活是不是很 糟糕?说是新题,因为本题以前从未原题出现过,但关于年龄的话题却不缺少。 比如2010年7月10日“年轻人是否适合担任政府要职”,2012年3月10日“老 龄化现象的原因及解决方法”,2012年3月31日“年轻人和老年人谁的价值更 高?”,2013年6月8日“政府是否应该对老年人养老提供财政支持?”,2015 年1月1日“年轻人当领导,行不行?”,2015年4月11日“老年人与年轻人 争夺工作职位,怎么办?”等等。 本题需要论证的对立观点是:年老很糟糕 vs. 当今社会年老没有那么糟糕。那 么,变老有哪些坏处呢?首先,当然是身体条件没有以前好了,甚至可能出现多 种疾病(物质层面);其次,不工作了,与人的联系少了,心里可能会感觉孤单, 甚至感觉没有价值了(精神层面);最后,变老后对社会的依赖程度更高,给社会 增加了压力(社会层面)。那么,这些问题在当今社会是不是得到了解决呢?首先, 医疗条件的改善有助于保持老年人的身体状况;互联网的出现有助于缓解老年人 的心理孤单问题;物质水平的提高也降低了老年人给社会造成的压力。如此观之, 现代社会老年人的生活的确容易多了,但我的观点是:外部条件只是改善老年人 生活的一个方面,最重要的还是老年人自己要积极调整心态,努力适应退休后的 生活,从而过一个更幸福更祥和的晚年。 Sample answer: Getting old is a natural process that nobody really likes. When you reach a certain age, your physical conditions will inevitably deteriorate, and you may suffer from various kinds of diseases. When you retire, you will feel isolated because your previous work contacts may be all gone, then you may feel useless to the world. Furthermore, when you get too old, you’ ll have to rely heavily on the support from others, either physically or emotionally, and your life will become a great pressure to your family and the whole society as well. For all these bad things about getting old, many people argue that the life of the elderly today is much easier than in the past. In the first place, medical advances nowadays have made it possible for the old people to stay sound and healthy for quite a long while even after they retire. Diseases such as diabetes, hypertension and heart attack which might have
秋风清,秋月明,落叶聚还散,寒鸦栖复惊。 雅思教父刘洪波:服装类雅思作文高分范文及点评 雅思教父刘洪波2010权威作品 《最简化雅思写作》 8月光芒上市 从零开始,单词、词组、句式、思想 完全应对官方四大评分标准 最新研发最简化15句写作框架模板 涵盖雅思题库各类型高分范文 幽默通俗的语言手把手教出写作高分 中国区前任雅思考官强力推荐 1.流行时尚 In modern society, fashion is becoming more highly valued in people's choice of clothes. Why? Do you think it is a positive or negative development? It seems that in recent years more and more people, especially in urban areas, are dressing more stylishly. Nowadays it is not uncommon to see people walking around in brand name clothes and sunglasses like celebrities. But why is this happening and is it a positive development? Personally I feel that whether it’s good or bad depends on the individual’s attitude. The cause of this fashion obsession surely is connected to movies and pop culture. In today’s society, we are constantly seeing images of attractive movies stars and MTV videos with pop icons wearing the most recent styles. To some extent, and perhaps even subconsciously, this affects our own behaviour as we imitate wha t we see. One on level, being fashionable is quite healthy. It is natural for us to want to look good, because if we look good we feel good about ourselves. Especially in today’s world of work and relationships, it’s important to have good self-esteem and be confident. Looking good can help us achieve that. But from another angle, being too fashion-conscious has its problems. Sometimes people end up obsessing about buying the most expensive things and look down upon others who can’t afford them. Such people become superficial and often don’t pay enough attention to the important things in life, like friendship and being a good
A类图表作文各个击破(流程图、柱图、曲线图、表格) .5.2表格 4.5.2.1解题关键 F 1表格与饼图一样,都是静态图。切入点在描述分配; F 2表格题考查列举数字的能力和方法。通过举一些有代表性的数据来说明问题; F 3横向比较。介绍横向各个数据的区别、变化和趋势; F 4纵向比较。介绍纵向各个数据的区别、变化和趋势; F 5不需要将每一个数据分别说明,突出强调数据最大值和最小值; F 6对比时要总结出数据对比最悬殊的和最小的。 4.5.2.2表格举例 Topic 4-4:The table below shows carbon dioxide emissions from transport in three European countries in 1994 and 2004.Summarise the information by selecting and reporting the main features and make comparisons where relevant.(表格贴不上,大家看附件吧~ ^_^)范文
The given table provides an overview of carbon dioxide emissions from four main transport sources (namely,road transport,railways,civil aviation and shipping) in the United Kingdom,France and Germany in 1994 and 2004. Germany,although having higher emissions than either the United Kingdom or France did,saw the amount decrease slightly from 47.2 to 46.7 million tonnes.By comparison,France recorded an increase of four million tonnes from 34.7 million in 1994,while the United Kingdom had a smaller growth,2.5 million tonnes over the same period.(纵向比较三个国家1994到2004年间二氧化碳释放量的整体趋势变化。) In all the three countries, road transport was responsible for the majority of emissions.(横向对四个二氧化碳释放源进行比较,点明最大释放源)In the United Kingdom,road transport produced emissions up to 32.6 million tonnes in 2004,2 million more than ten years earlier,while other three transport sources did not show any remarkable growth.(接着对三个国家的释放源进行描述说明,说明从1994年到2004年间的变化)A similar pattern was seen in France,where road transport added 3.6 million tonnes to the total emissions within ten